In the fast-evolving world of technology, Elastic N.V. (ESTC) and PagerDuty, Inc. (PD) stand out as key players in the software application industry. Both companies deliver innovative platforms that enhance data management and operational efficiency, targeting overlapping markets such as IT and digital operations. This article will analyze their strengths and strategies to help you decide which company presents the most compelling investment opportunity in 2026.

Table of contents
Companies Overview
I will begin the comparison between Elastic N.V. and PagerDuty, Inc. by providing an overview of these two companies and their main differences.
Elastic N.V. Overview
Elastic N.V. is a technology company specializing in search solutions designed for multi-cloud environments. Founded in 2012 and headquartered in Mountain View, CA, it offers the Elastic Stack, a suite of software products that enable data ingestion, storage, search, and analytics across various data types. The company serves a broad market with products like Elasticsearch, Kibana, Beats, and Logstash, supporting use cases from application performance management to synthetic monitoring.
PagerDuty, Inc. Overview
PagerDuty, Inc. operates a digital operations management platform that leverages machine learning to analyze data from software-enabled systems globally. Founded in 2009 and based in San Francisco, CA, PagerDuty serves diverse industries including technology, telecommunications, retail, and financial services. Its platform helps organizations predict and resolve operational issues by correlating digital signals, enhancing reliability and responsiveness in complex environments.
Key similarities and differences
Both Elastic and PagerDuty operate in the software application industry within the technology sector and are listed on the NYSE. Elastic focuses on search and data analytics across multi-cloud environments with a broader software stack, while PagerDuty concentrates on digital operations management using machine learning for incident prediction and resolution. Elastic employs roughly 3,400 staff, significantly more than PagerDuty’s 1,200, reflecting differences in scale and product complexity.
Income Statement Comparison
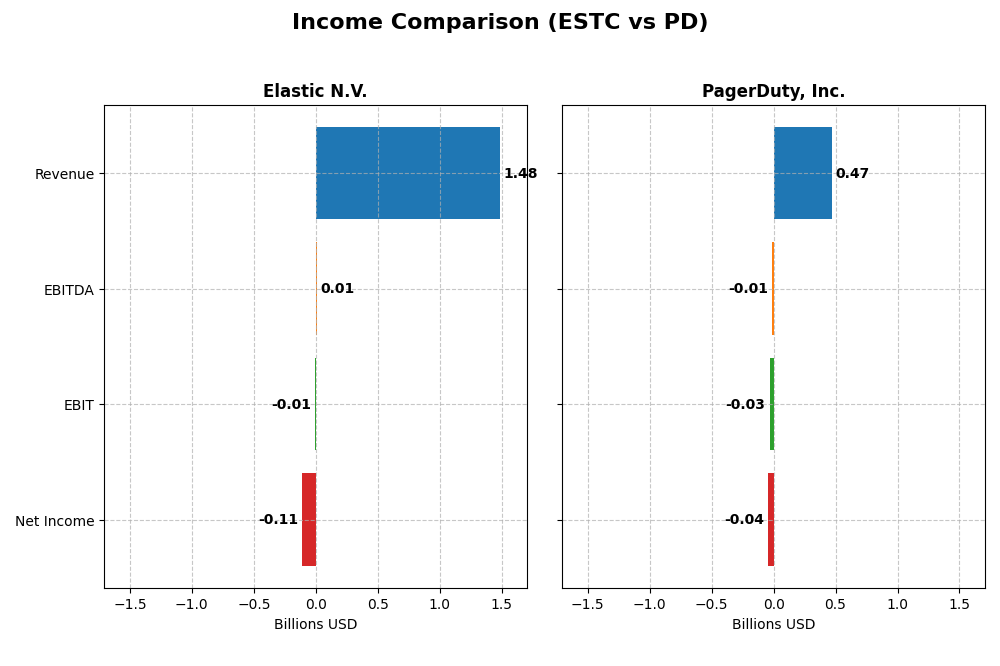
The table below compares key income statement metrics for Elastic N.V. and PagerDuty, Inc. for their most recent fiscal years, providing a snapshot of their financial performance.
| Metric | Elastic N.V. (ESTC) | PagerDuty, Inc. (PD) |
|---|---|---|
| Market Cap | 7.52B | 1.03B |
| Revenue | 1.48B | 467.5M |
| EBITDA | 6.05M | -11.89M |
| EBIT | -6.26M | -32.50M |
| Net Income | -108.11M | -54.46M |
| EPS | -1.04 | -0.59 |
| Fiscal Year | 2025 | 2025 |
Income Statement Interpretations
Elastic N.V.
Elastic N.V. experienced strong revenue growth from 2021 to 2025, increasing by 144% overall, with a notable 17% rise in the latest fiscal year. Gross margins remained favorable at 74.4%, reflecting stable cost control. However, the net income turned negative in 2025 at -$108M, with net margin declining to -7.3%, indicating profitability challenges despite improved EBIT margins.
PagerDuty, Inc.
PagerDuty showed consistent revenue growth of approximately 119% over five years, with an 8.5% increase in the last year. Its gross margin is higher than Elastic’s at 83%, but the company still reported a net loss of $43M in 2025, with a net margin of -9.1%. Nonetheless, PagerDuty demonstrated positive trends in net margin and EPS growth, suggesting operational improvements.
Which one has the stronger fundamentals?
PagerDuty’s higher gross margin and stronger overall income statement evaluation, with 86% favorable indicators, suggest more resilient fundamentals compared to Elastic’s 71%. However, Elastic’s larger revenue base and significant revenue growth provide a solid foundation despite its recent net losses. Both companies face profitability challenges but exhibit favorable revenue and margin trends.
Financial Ratios Comparison
The following table compares key financial ratios for Elastic N.V. (ESTC) and PagerDuty, Inc. (PD) based on their most recent fiscal year data, providing insight into their operational efficiency, profitability, liquidity, and leverage.
| Ratios | Elastic N.V. (ESTC) 2025 | PagerDuty, Inc. (PD) 2025 |
|---|---|---|
| ROE | -11.7% | -32.9% |
| ROIC | -3.4% | -9.7% |
| P/E | -82.7 | -39.9 |
| P/B | 9.64 | 13.12 |
| Current Ratio | 1.92 | 1.87 |
| Quick Ratio | 1.92 | 1.87 |
| D/E (Debt-to-Equity) | 0.64 | 3.57 |
| Debt-to-Assets | 23.0% | 50.0% |
| Interest Coverage | -2.17 | -6.46 |
| Asset Turnover | 0.57 | 0.50 |
| Fixed Asset Turnover | 51.3 | 16.6 |
| Payout Ratio | 0 | 0 |
| Dividend Yield | 0% | 0% |
Interpretation of the Ratios
Elastic N.V.
Elastic N.V. presents a mixed ratio profile with 43% favorable and 43% unfavorable ratings, resulting in a neutral overall view. Key weaknesses include negative net margin (-7.29%) and return on equity (-11.66%), while liquidity ratios (current and quick at 1.92) and debt to assets (22.95%) are favorable. The company does not pay dividends, likely reflecting reinvestment priorities or growth strategy.
PagerDuty, Inc.
PagerDuty shows a generally weaker ratio set, with 57% unfavorable and 36% favorable ratios, leading to an unfavorable assessment. It suffers from negative profitability metrics such as net margin (-9.14%) and return on equity (-32.92%), and higher leverage indicated by debt to equity (3.57) and debt to assets (50%). PagerDuty also does not pay dividends, possibly due to ongoing investments and a high-growth focus.
Which one has the best ratios?
Elastic N.V. holds a more balanced ratio profile with a neutral global opinion, stronger liquidity, and lower leverage than PagerDuty. PagerDuty’s ratios indicate higher financial risk and weaker profitability. Based on these evaluations, Elastic N.V. demonstrates relatively better financial health and operational efficiency in 2025.
Strategic Positioning
This section compares the strategic positioning of Elastic N.V. and PagerDuty, Inc. in terms of Market position, Key segments, and Exposure to technological disruption:
Elastic N.V.
- Large market cap of 7.5B USD in software application, facing typical industry competition.
- Focused on Elastic Stack subscription and professional services, driving growth through cloud-based data search and analytics.
- Provides multi-cloud search and analytics solutions; technological disruption risk tied to cloud and data processing advances.
PagerDuty, Inc.
- Smaller market cap of 1B USD, operating in software application with moderate competitive pressure.
- Concentrated on digital operations management platform serving diverse industries like telecom and retail.
- Uses machine learning for data correlation and issue prediction; exposed to disruption in AI and digital operations.
Elastic N.V. vs PagerDuty, Inc. Positioning
Elastic offers diversified revenue streams with subscription and professional services, supporting growth in cloud and data analytics. PagerDuty concentrates on digital operations management with a focus on machine learning, serving varied industries but with narrower product scope.
Which has the best competitive advantage?
Both companies show slightly unfavorable MOAT evaluations due to ROIC below WACC but with growing profitability, indicating value destruction yet improving returns. Neither demonstrates a strong sustainable competitive advantage based on current MOAT data.
Stock Comparison
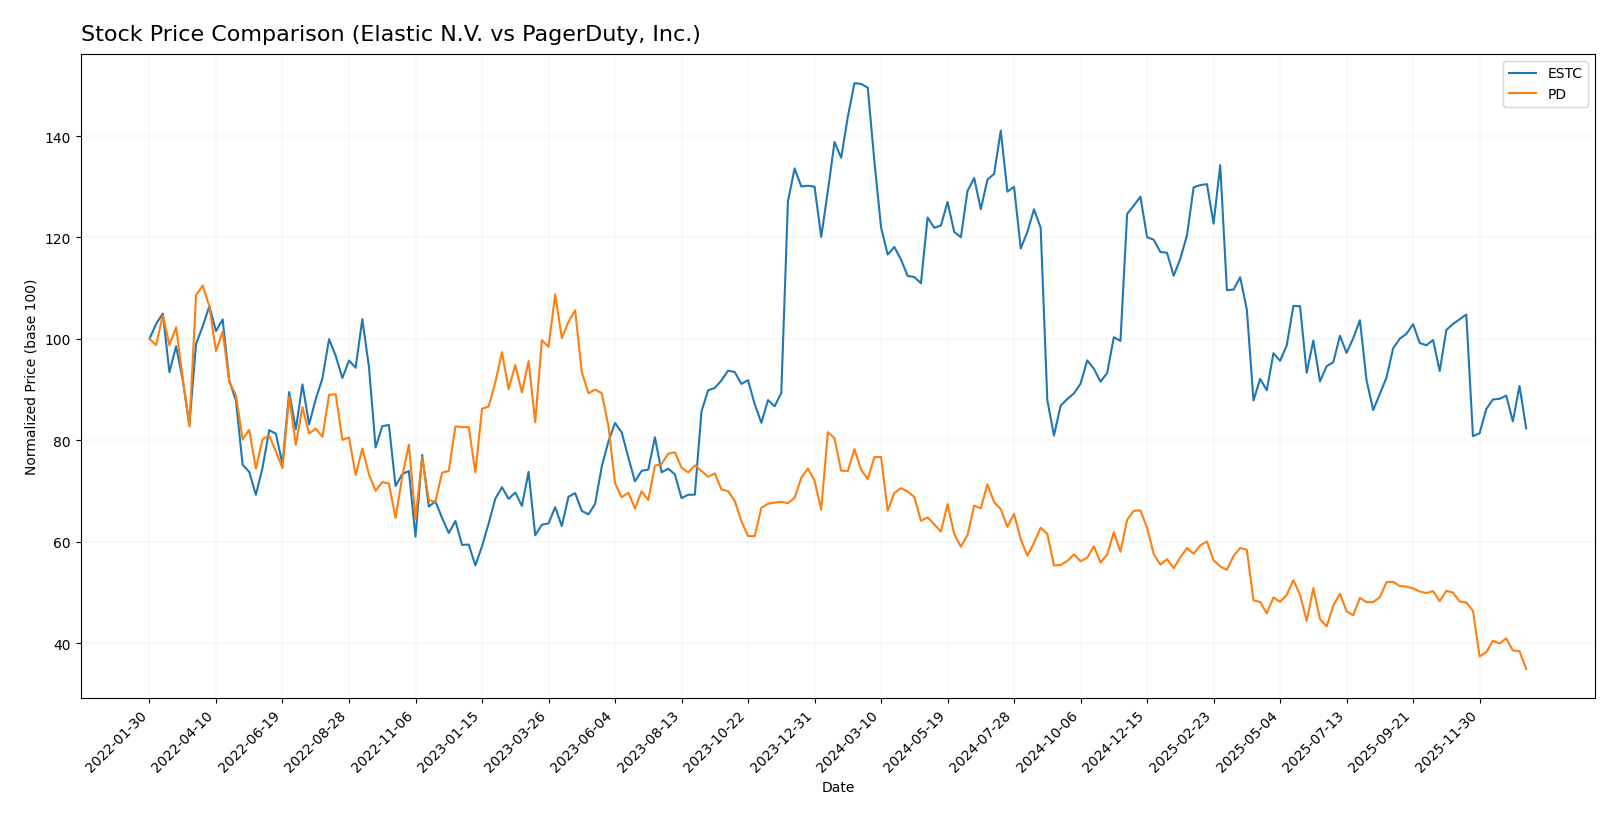
The stock prices of Elastic N.V. and PagerDuty, Inc. have both exhibited significant declines over the past 12 months, with notable bearish trends and decelerating momentum reflecting challenging trading dynamics.
Trend Analysis
Elastic N.V. (ESTC) experienced a -44.93% price decline over the past year, indicating a bearish trend with deceleration. The stock showed high volatility, with a standard deviation of 14.08, peaking at 129.62 and bottoming at 70.04.
PagerDuty, Inc. (PD) recorded a -51.76% price drop over the same period, also bearish with deceleration. Its volatility was lower, at a 2.92 standard deviation, reaching a high of 24.66 and a low of 11.22.
Comparing both stocks, ESTC outperformed PD by delivering a smaller percentage loss over the past year, despite both showing bearish trends and decelerating declines.
Target Prices
The consensus target prices for Elastic N.V. and PagerDuty, Inc. indicate potential upside from current levels.
| Company | Target High | Target Low | Consensus |
|---|---|---|---|
| Elastic N.V. | 134 | 76 | 108 |
| PagerDuty, Inc. | 19 | 15 | 16.2 |
Analysts expect Elastic N.V.’s stock to rise significantly above its current price of $71.38, while PagerDuty’s consensus target of $16.2 also suggests notable upside from its current $11.22 level.
Analyst Opinions Comparison
This section compares analysts’ ratings and grades for Elastic N.V. and PagerDuty, Inc.:
Rating Comparison
Elastic N.V. Rating
- Rating: C-, considered very favorable overall.
- Discounted Cash Flow Score: 3, indicating a moderate valuation.
- ROE Score: 1, rated very unfavorable for profitability.
- ROA Score: 1, rated very unfavorable for asset use efficiency.
- Debt To Equity Score: 1, very unfavorable, suggesting high financial risk.
- Overall Score: 1, very unfavorable financial standing.
PagerDuty, Inc. Rating
- Rating: A-, considered very favorable overall.
- Discounted Cash Flow Score: 5, indicating a very favorable valuation.
- ROE Score: 5, rated very favorable for profitability.
- ROA Score: 5, rated very favorable for asset use efficiency.
- Debt To Equity Score: 1, also very unfavorable, indicating high financial risk.
- Overall Score: 4, considered favorable financial standing.
Which one is the best rated?
PagerDuty, Inc. is better rated than Elastic N.V., with a higher overall score (4 vs. 1) and superior scores in discounted cash flow, ROE, and ROA. Both share an unfavorable debt-to-equity score.
Scores Comparison
Here is a comparison of the Altman Z-Score and Piotroski Score for Elastic N.V. and PagerDuty, Inc.:
Elastic N.V. Scores
- Altman Z-Score: 3.51, indicating financial safety
- Piotroski Score: 4, reflecting average financial strength
PagerDuty, Inc. Scores
- Altman Z-Score: 1.26, indicating financial distress
- Piotroski Score: 7, reflecting strong financial strength
Which company has the best scores?
Based on the provided data, Elastic N.V. has a safer Altman Z-Score, while PagerDuty, Inc. has a stronger Piotroski Score. Each company shows strength in different financial assessments.
Grades Comparison
The following section compares the recent grades assigned by reputable financial institutions for Elastic N.V. and PagerDuty, Inc.:
Elastic N.V. Grades
This table summarizes the latest grades assigned to Elastic N.V. by established grading companies.
| Grading Company | Action | New Grade | Date |
|---|---|---|---|
| Barclays | Maintain | Overweight | 2026-01-12 |
| RBC Capital | Maintain | Outperform | 2026-01-05 |
| Jefferies | Maintain | Buy | 2026-01-05 |
| Citigroup | Maintain | Buy | 2025-11-24 |
| Wedbush | Maintain | Outperform | 2025-11-21 |
| B of A Securities | Maintain | Neutral | 2025-11-21 |
| Guggenheim | Maintain | Buy | 2025-11-21 |
| Wells Fargo | Maintain | Equal Weight | 2025-11-21 |
| RBC Capital | Maintain | Outperform | 2025-11-21 |
| Canaccord Genuity | Maintain | Buy | 2025-11-21 |
Elastic N.V. consistently receives positive ratings, predominantly “Buy” and “Outperform,” with no recent downgrades.
PagerDuty, Inc. Grades
This table presents the current grades assigned to PagerDuty, Inc. by recognized grading companies.
| Grading Company | Action | New Grade | Date |
|---|---|---|---|
| Truist Securities | Maintain | Buy | 2026-01-07 |
| RBC Capital | Downgrade | Sector Perform | 2026-01-05 |
| TD Cowen | Maintain | Buy | 2025-11-26 |
| Craig-Hallum | Downgrade | Hold | 2025-11-26 |
| Morgan Stanley | Maintain | Equal Weight | 2025-11-26 |
| RBC Capital | Maintain | Outperform | 2025-11-26 |
| Truist Securities | Maintain | Buy | 2025-11-19 |
| Baird | Maintain | Neutral | 2025-09-04 |
| RBC Capital | Maintain | Outperform | 2025-09-04 |
| Canaccord Genuity | Maintain | Buy | 2025-09-04 |
PagerDuty, Inc. shows a mixed trend with recent downgrades and a broader range of ratings from “Buy” to “Hold” and “Sector Perform.”
Which company has the best grades?
Elastic N.V. holds stronger and more consistent positive grades compared to PagerDuty, Inc., whose ratings include recent downgrades and more neutral stances. This difference may affect investor confidence and perceived risk profiles.
Strengths and Weaknesses
Below is a comparative table outlining the key strengths and weaknesses of Elastic N.V. (ESTC) and PagerDuty, Inc. (PD) based on recent financial and operational metrics:
| Criterion | Elastic N.V. (ESTC) | PagerDuty, Inc. (PD) |
|---|---|---|
| Diversification | Moderate: Revenue mainly from Subscriptions (1.38B USD in 2025) and Professional Services (98.8M USD) | Limited: No detailed segment data; reliant on core incident management services |
| Profitability | Unfavorable: Negative net margin (-7.29%) and ROIC (-3.45%), but improving ROIC trend | Unfavorable: Negative net margin (-9.14%) and ROIC (-9.66%), slight ROIC growth |
| Innovation | Strong: High asset turnover (51.28) indicating efficient use of assets | Moderate: Lower asset turnover (16.61), but some innovation reflected in service offerings |
| Global presence | Established: Large subscription base suggests broad market reach | Growing: Increasing presence but higher debt levels may constrain expansion |
| Market Share | Significant in search and analytics software market | Niche leader in digital operations management but faces high competition |
Key takeaways: Both companies are currently shedding value with negative profitability metrics, though they show improving ROIC trends. Elastic demonstrates stronger diversification and operational efficiency, while PagerDuty must manage higher leverage and profitability challenges. Cautious monitoring of their profitability recovery is advised before making investment decisions.
Risk Analysis
Below is a comparative table outlining key risks for Elastic N.V. (ESTC) and PagerDuty, Inc. (PD) based on the most recent data from 2025:
| Metric | Elastic N.V. (ESTC) | PagerDuty, Inc. (PD) |
|---|---|---|
| Market Risk | Beta 0.93, moderate volatility | Beta 0.63, lower volatility |
| Debt level | Debt-to-Equity 0.64 (neutral), Debt-to-Assets 23% (favorable) | Debt-to-Equity 3.57 (unfavorable), Debt-to-Assets 50% (unfavorable) |
| Regulatory Risk | Moderate, US-based tech regulations | Moderate, US and international exposure |
| Operational Risk | Medium, relies on Elastic Stack ecosystem | Medium, dependent on digital operations platform |
| Environmental Risk | Low, software company with limited direct impact | Low, primarily software services |
| Geopolitical Risk | Moderate, US-centric but global cloud customers | Moderate, operates internationally, some exposure |
In synthesis, PagerDuty faces the most impactful risk from its high leverage and weak interest coverage, which could strain financial stability in adverse conditions. Elastic’s risks are more balanced, but its negative profitability and returns on equity signal operational challenges. Market volatility remains moderate for both, with PagerDuty showing slightly lower beta, suggesting marginally less price fluctuation. Investors should weigh debt risks heavily, especially for PagerDuty, while monitoring operational efficiency trends for Elastic.
Which Stock to Choose?
Elastic N.V. (ESTC) shows a favorable income evolution with 17% revenue growth in 2025 and a positive overall income trend since 2021. Its financial ratios are balanced with 43% favorable and unfavorable each, and it carries moderate debt. Profitability remains negative but improving, with a slightly unfavorable economic moat and a very favorable rating of C-.
PagerDuty, Inc. (PD) posts steady income growth with 8.5% revenue increase in 2025 and a strong overall income statement. Its financial ratios are less favorable, with 36% positive and 57% negative indicators, and it holds higher debt levels. Profitability is also negative yet improving, with a slightly unfavorable moat but a very favorable rating of A-.
For investors seeking growth potential with moderate financial stability, Elastic’s improving profitability and balanced ratios might appear attractive. Conversely, those prioritizing higher rating scores and stronger income statement growth could find PagerDuty more aligned with risk-tolerant profiles. Each stock’s characteristics might suggest suitability depending on one’s investment strategy and risk appetite.
Disclaimer: Investment carries a risk of loss of initial capital. The past performance is not a reliable indicator of future results. Be sure to understand risks before making an investment decision.
Go Further
I encourage you to read the complete analyses of Elastic N.V. and PagerDuty, Inc. to enhance your investment decisions: