In today’s fast-evolving tech landscape, Elastic N.V. (ESTC) and monday.com Ltd. (MNDY) stand out as innovative players within the software application industry. Both companies deliver cloud-based solutions that enhance data management and operational efficiency, targeting overlapping markets such as enterprise software and digital transformation. This article will explore their strengths and strategies to help you decide which company could be the smarter addition to your investment portfolio.
Table of contents
Companies Overview
I will begin the comparison between Elastic N.V. and monday.com Ltd. by providing an overview of these two companies and their main differences.
Elastic N.V. Overview
Elastic N.V. is a technology company specializing in search solutions that operate in public and private multi-cloud environments. Founded in 2012 and based in Mountain View, California, Elastic offers the Elastic Stack, a suite of software products for ingesting, storing, searching, analyzing, and visualizing data of various types. Its flagship product, Elasticsearch, supports diverse data formats and use cases such as app search and application performance management.
monday.com Ltd. Overview
monday.com Ltd., established in 2012 and headquartered in Tel Aviv, Israel, develops cloud-based software applications for work management. Its flagship product, Work OS, is a visual operating system composed of modular blocks that enables users to build custom applications for marketing, CRM, project management, and software development. The company serves a broad range of sectors including education, government, and business units internationally.
Key similarities and differences
Both Elastic and monday.com operate in the software application industry, offering cloud-based platforms that enhance organizational workflows and data management. Elastic focuses on data search, analysis, and visualization technologies, while monday.com emphasizes customizable work operating systems for project and process management. Additionally, Elastic is listed on the NYSE with a market cap of 7.5B USD, whereas monday.com trades on NASDAQ with a market cap of 6.5B USD.
Income Statement Comparison
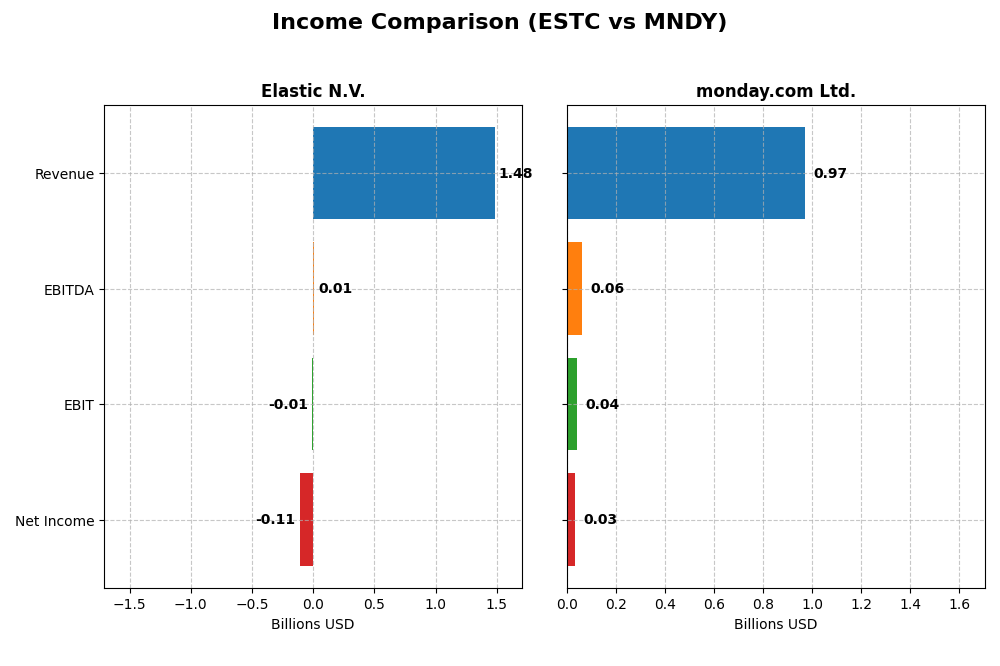
This table presents a side-by-side comparison of key income statement metrics for Elastic N.V. and monday.com Ltd. for their most recent fiscal years.
| Metric | Elastic N.V. (ESTC) | monday.com Ltd. (MNDY) |
|---|---|---|
| Market Cap | 7.5B | 6.5B |
| Revenue | 1.48B | 972M |
| EBITDA | 6.1M | 58M |
| EBIT | -6.3M | 40M |
| Net Income | -108M | 32M |
| EPS | -1.04 | 0.65 |
| Fiscal Year | 2025 | 2024 |
Income Statement Interpretations
Elastic N.V.
Elastic N.V. showed consistent revenue growth from 608M in 2021 to 1.48B in 2025, with a favorable gross margin around 74%. However, net income remained negative in 2025 at -108M, despite a 17% revenue increase the prior year. EBIT margin stayed unfavorable at -0.42%, reflecting ongoing operational challenges despite improved EBIT growth.
monday.com Ltd.
monday.com Ltd. achieved strong revenue growth from 161M in 2020 to 972M in 2024, maintaining an excellent gross margin above 89%. The company turned profitable in 2024 with a net income of 32M and a positive EBIT margin of 4.09%. Recent performance shows significant margin improvement and a net margin growth exceeding 1300%, indicating accelerating profitability.
Which one has the stronger fundamentals?
monday.com Ltd. displays stronger fundamentals with higher revenue growth (503% vs. 144%), robust profitability, and improving margins. Elastic N.V. posts steady revenue gains but faces persistent net losses and negative EBIT margins. Both companies have favorable income statement evaluations, but monday.com’s consistent positive net income and margin expansion are notable advantages.
Financial Ratios Comparison
The table below presents a side-by-side comparison of key financial ratios for Elastic N.V. (ESTC) and monday.com Ltd. (MNDY) based on their most recent fiscal year data.
| Ratios | Elastic N.V. (ESTC) | monday.com Ltd. (MNDY) |
|---|---|---|
| ROE | -11.66% | 3.14% |
| ROIC | -3.45% | -1.73% |
| P/E | -82.65 | 362.98 |
| P/B | 9.64 | 11.41 |
| Current Ratio | 1.92 | 2.66 |
| Quick Ratio | 1.92 | 2.66 |
| D/E | 0.64 | 0.10 |
| Debt-to-Assets | 22.95% | 6.29% |
| Interest Coverage | -2.17 | 0 |
| Asset Turnover | 0.57 | 0.58 |
| Fixed Asset Turnover | 51.28 | 7.13 |
| Payout ratio | 0 | 0 |
| Dividend yield | 0 | 0 |
Interpretation of the Ratios
Elastic N.V.
Elastic N.V. shows a mixed ratio profile with strengths in liquidity, low debt to assets at 22.95%, and impressive fixed asset turnover of 51.28, signaling efficient use of fixed assets. However, the company faces concerns with negative net margin (-7.29%) and return on equity (-11.66%), reflecting unprofitable operations. Elastic does not pay dividends, likely due to ongoing reinvestment and growth priorities.
monday.com Ltd.
monday.com Ltd. also presents a neutral overall ratio assessment with strong liquidity ratios (current and quick at 2.66) and low debt levels (debt to assets 6.29%). The company faces challenges with modest net margin (3.33%) and negative return on invested capital (-1.73%), while high price multiples suggest valuation risks. monday.com does not distribute dividends, consistent with its growth and reinvestment strategy.
Which one has the best ratios?
Both Elastic N.V. and monday.com Ltd. have an equal proportion of favorable and unfavorable ratios, leading to a neutral overall evaluation. Elastic excels in asset efficiency but struggles with profitability, while monday.com maintains stronger liquidity and lower leverage but contends with weak earnings metrics. Neither company currently pays dividends, reflecting growth-focused capital allocation.
Strategic Positioning
This section compares the strategic positioning of Elastic N.V. and monday.com Ltd., focusing on market position, key segments, and exposure to technological disruption:
Elastic N.V.
- Mid-cap software player with moderate competitive pressure in application software industry.
- Primarily driven by subscription revenues from Elastic Stack products and professional services.
- Operates in multi-cloud environments with software solutions for search, analytics, and monitoring.
monday.com Ltd.
- Mid-cap software company facing higher beta and competitive pressure in application software.
- Focused on cloud-based Work OS, offering modular applications for work management and CRM.
- Provides cloud-based visual work management platform with modular building blocks.
Elastic N.V. vs monday.com Ltd. Positioning
Elastic’s strategic approach centers on subscription-based solutions for data ingestion and search, offering diversified use cases, while monday.com concentrates on cloud-based work management software with modular applications, representing a more concentrated business model.
Which has the best competitive advantage?
Both companies have slightly unfavorable MOAT evaluations, shedding value despite growing ROIC trends, indicating improving profitability but currently limited sustainable competitive advantages based on invested capital efficiency.
Stock Comparison
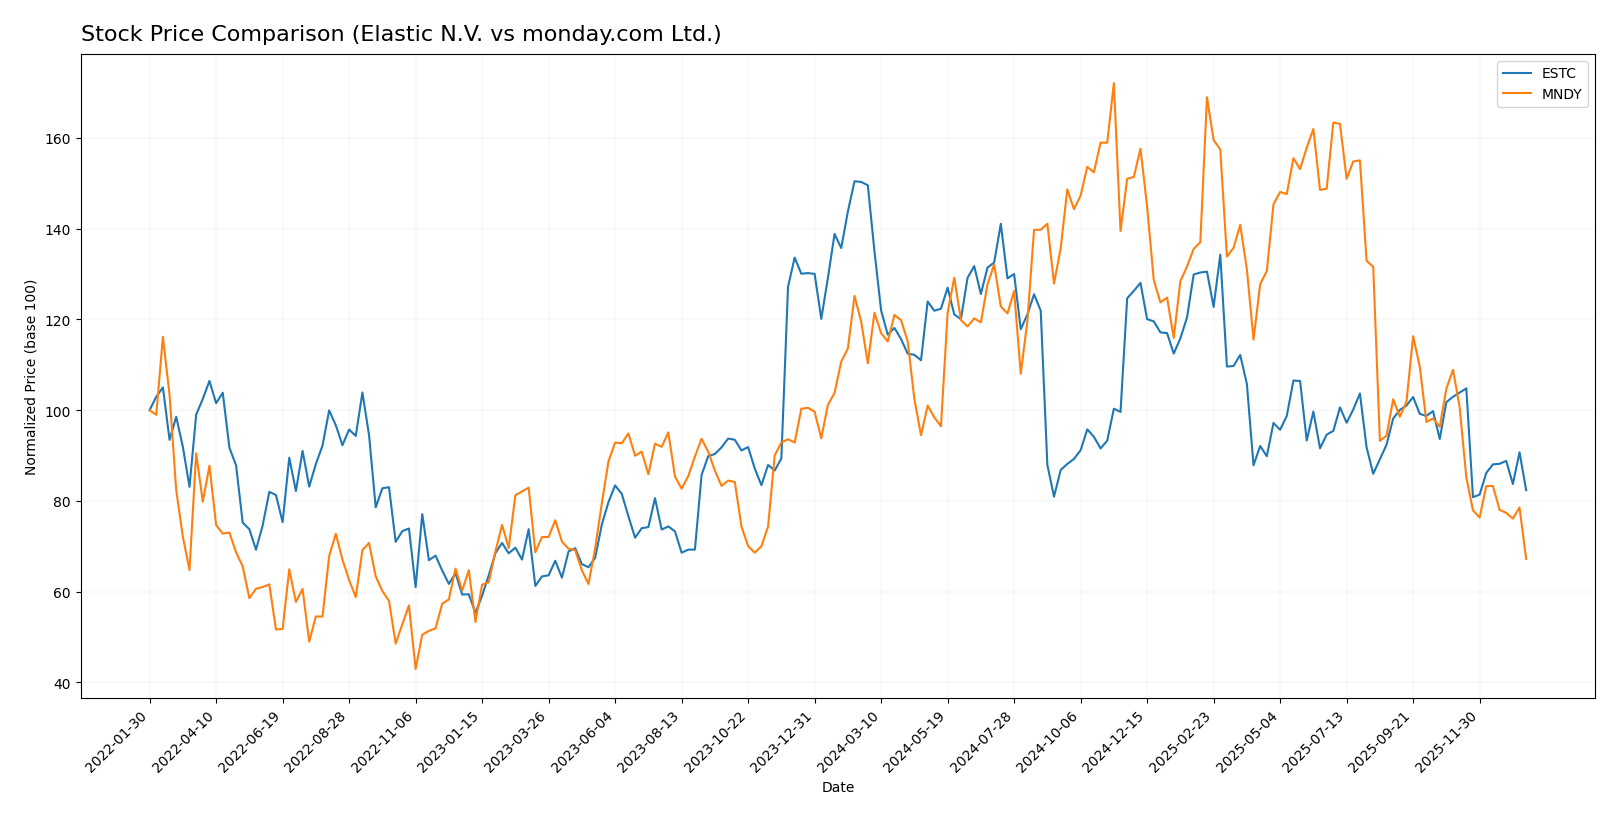
The stock price movements over the past year reveal significant declines for both Elastic N.V. and monday.com Ltd., with ESTC showing a notable deceleration in its bearish trend and MNDY experiencing sharper losses and higher volatility.
Trend Analysis
Elastic N.V. (ESTC) recorded a -44.93% price change over the past year, confirming a bearish trend with decelerating losses and moderate volatility (14.08 std deviation). The highest and lowest prices were 129.62 and 70.04, respectively.
monday.com Ltd. (MNDY) showed a -39.06% price drop in the same period, also bearish with deceleration. Volatility was substantially higher at 47.32 std deviation, with price extremes from 324.31 to 126.7.
Comparing the two, ESTC had the larger price decrease and thus the weaker market performance, while MNDY’s decline was less severe despite more pronounced volatility.
Target Prices
The current analyst consensus indicates optimistic target prices for both Elastic N.V. and monday.com Ltd.
| Company | Target High | Target Low | Consensus |
|---|---|---|---|
| Elastic N.V. | 134 | 76 | 108 |
| monday.com Ltd. | 330 | 194 | 264.42 |
Analysts expect Elastic N.V.’s stock to trade significantly above its current price of $71.38, while monday.com’s consensus target of $264.42 is more than double its current price of $126.7, reflecting strong growth potential.
Analyst Opinions Comparison
This section compares analysts’ ratings and grades for Elastic N.V. and monday.com Ltd.:
Rating Comparison
Elastic N.V. Rating
- Rating: C-, considered Very Favorable by analysts.
- Discounted Cash Flow Score: 3, indicating a Moderate valuation.
- ROE Score: 1, marked as Very Unfavorable for profitability.
- ROA Score: 1, rated Very Unfavorable for asset efficiency.
- Debt To Equity Score: 1, showing Very Unfavorable financial risk.
- Overall Score: 1, considered Very Unfavorable overall.
monday.com Ltd. Rating
- Rating: B-, considered Very Favorable by analysts.
- Discounted Cash Flow Score: 4, indicating a Favorable valuation.
- ROE Score: 3, marked as Moderate for profitability.
- ROA Score: 3, rated Moderate for asset efficiency.
- Debt To Equity Score: 3, showing Moderate financial risk.
- Overall Score: 3, considered Moderate overall.
Which one is the best rated?
Based strictly on the provided data, monday.com Ltd. is better rated than Elastic N.V., with higher scores in discounted cash flow, profitability, asset efficiency, debt risk, and overall assessment.
Scores Comparison
Here is a comparison of the Altman Z-Score and Piotroski Score for Elastic N.V. and monday.com Ltd.:
Elastic N.V. Scores
- Altman Z-Score: 3.51, indicating a safe zone with low bankruptcy risk.
- Piotroski Score: 4, reflecting average financial strength.
monday.com Ltd. Scores
- Altman Z-Score: 6.33, indicating a safe zone with very low bankruptcy risk.
- Piotroski Score: 5, reflecting average financial strength.
Which company has the best scores?
monday.com Ltd. has a higher Altman Z-Score and a slightly better Piotroski Score than Elastic N.V., indicating comparatively stronger financial health based on the provided scores.
Grades Comparison
Here is a comparison of recent reliable grades for Elastic N.V. and monday.com Ltd.:
Elastic N.V. Grades
The following table presents recent grades from major financial institutions for Elastic N.V.:
| Grading Company | Action | New Grade | Date |
|---|---|---|---|
| Barclays | Maintain | Overweight | 2026-01-12 |
| RBC Capital | Maintain | Outperform | 2026-01-05 |
| Jefferies | Maintain | Buy | 2026-01-05 |
| Citigroup | Maintain | Buy | 2025-11-24 |
| Wedbush | Maintain | Outperform | 2025-11-21 |
| B of A Securities | Maintain | Neutral | 2025-11-21 |
| Guggenheim | Maintain | Buy | 2025-11-21 |
| Wells Fargo | Maintain | Equal Weight | 2025-11-21 |
| RBC Capital | Maintain | Outperform | 2025-11-21 |
| Canaccord Genuity | Maintain | Buy | 2025-11-21 |
Elastic N.V.’s grades predominantly indicate a positive outlook, with several “Buy” and “Outperform” ratings and some moderate neutral stances, showing consistent confidence from analysts.
monday.com Ltd. Grades
The table below shows recent grades from recognized grading companies for monday.com Ltd.:
| Grading Company | Action | New Grade | Date |
|---|---|---|---|
| BTIG | Maintain | Buy | 2026-01-15 |
| Barclays | Maintain | Overweight | 2026-01-12 |
| Jefferies | Maintain | Buy | 2026-01-05 |
| Citigroup | Maintain | Buy | 2025-12-23 |
| Tigress Financial | Maintain | Buy | 2025-12-11 |
| Baird | Maintain | Outperform | 2025-11-11 |
| Wells Fargo | Maintain | Overweight | 2025-11-11 |
| DA Davidson | Maintain | Buy | 2025-11-11 |
| Morgan Stanley | Maintain | Overweight | 2025-11-11 |
| Piper Sandler | Maintain | Overweight | 2025-11-11 |
monday.com Ltd. receives strong buy-side support with mostly “Buy,” “Outperform,” and “Overweight” ratings across multiple firms, indicating robust analyst confidence.
Which company has the best grades?
Both Elastic N.V. and monday.com Ltd. have a consensus “Buy” rating with strong analyst support. monday.com Ltd. shows a slightly higher concentration of “Overweight” and “Outperform” grades, which may suggest a marginally stronger positive sentiment among analysts. This could influence investor perception of growth potential and risk.
Strengths and Weaknesses
Below is a comparative table highlighting key strengths and weaknesses of Elastic N.V. (ESTC) and monday.com Ltd. (MNDY) based on the most recent financial and operational data.
| Criterion | Elastic N.V. (ESTC) | monday.com Ltd. (MNDY) |
|---|---|---|
| Diversification | Moderate: Revenue primarily from subscriptions (1.38B USD in 2025) and professional services (98.8M USD) | Limited data available; focus on collaborative work management software |
| Profitability | Unfavorable: Negative net margin (-7.29%), ROIC (-3.45%), and ROE (-11.66%) | Unfavorable: Positive net margin (3.33%) and ROE (3.14%) but negative ROIC (-1.73%) |
| Innovation | Growing ROIC trend (+85.8%) suggests improving operational efficiency despite current losses | Strong ROIC growth (+99.6%) indicates rising profitability potential |
| Global presence | Strong global footprint supported by subscription growth | Global presence expected but less documented; SaaS model implies scalability |
| Market Share | Well-established in search and analytics platforms | Emerging player in work management with growth potential |
Key takeaways: Both companies are currently shedding value as ROIC remains below WACC, but their improving ROIC trends signal potential profitability gains. Elastic shows stronger subscription revenue and a more diversified service mix, while monday.com demonstrates rapid operational improvement with a scalable SaaS business model. Investors should weigh current profitability challenges against growth prospects and market positioning.
Risk Analysis
Below is a summary table outlining key risk factors for Elastic N.V. (ESTC) and monday.com Ltd. (MNDY) based on the most recent data available.
| Metric | Elastic N.V. (ESTC) | monday.com Ltd. (MNDY) |
|---|---|---|
| Market Risk | Moderate (Beta 0.93) | Higher (Beta 1.26) |
| Debt level | Moderate (Debt/Equity 0.64) | Low (Debt/Equity 0.10) |
| Regulatory Risk | Moderate (US-based tech sector) | Moderate (Israel-based, global) |
| Operational Risk | Medium (Cloud software reliance) | Medium (Cloud-based Work OS) |
| Environmental Risk | Low (Software industry) | Low (Software industry) |
| Geopolitical Risk | Low (US headquartered) | Elevated (Israel location) |
The most impactful risks are market volatility and operational dependencies on cloud infrastructure for both firms. monday.com faces somewhat higher geopolitical risk due to its Israeli base and higher market beta, increasing sensitivity to global shocks. Elastic’s moderate debt and negative profitability metrics suggest caution despite a safer geopolitical stance. Both companies show sound liquidity but require close monitoring of profitability trends.
Which Stock to Choose?
Elastic N.V. (ESTC) shows favorable income growth and gross margin but struggles with negative profitability metrics and mixed financial ratios. Its debt level is moderate, and the overall rating is very favorable, though key profitability scores remain very unfavorable.
monday.com Ltd. (MNDY) exhibits strong revenue and profit growth with a high gross margin and favorable liquidity ratios. Despite low profitability ratios and elevated valuation multiples, it maintains a very favorable rating and a solid financial safety score.
For risk-averse investors seeking stability, ESTC’s improving profitability alongside a very favorable rating might appear more suitable. Conversely, growth-oriented investors could find MNDY’s robust income expansion and financial strength appealing, despite its higher valuation and moderate rating.
Disclaimer: Investment carries a risk of loss of initial capital. The past performance is not a reliable indicator of future results. Be sure to understand risks before making an investment decision.
Go Further
I encourage you to read the complete analyses of Elastic N.V. and monday.com Ltd. to enhance your investment decisions: