Intuit Inc. and Elastic N.V. are two prominent players in the software application industry, each excelling in distinct yet overlapping domains. Intuit focuses on financial management solutions for consumers and businesses, while Elastic specializes in data search and analytics platforms. Both companies emphasize innovation to maintain competitive edges in rapidly evolving markets. In this article, I will analyze their strengths and risks to help you decide which stock deserves a place in your investment portfolio.
Table of contents
Companies Overview
I will begin the comparison between Intuit Inc. and Elastic N.V. by providing an overview of these two companies and their main differences.
Intuit Inc. Overview
Intuit Inc. is a technology company focused on financial management and compliance products for consumers, small businesses, and accounting professionals across multiple countries. Operating through four segments, it offers software solutions such as QuickBooks and TurboTax, alongside payment processing and personal finance services. Founded in 1983, Intuit is headquartered in Mountain View, California, and has a market cap of $151.6B.
Elastic N.V. Overview
Elastic N.V. specializes in search technology designed for public and private cloud environments, primarily offering its Elastic Stack software suite. This includes Elasticsearch for real-time search and analytics, Kibana for management, and other data processing tools. Incorporated in 2012 and based in Mountain View, California, Elastic serves multi-cloud users with a market cap of $7.6B, targeting data ingestion, search, and visualization needs.
Key similarities and differences
Both Intuit and Elastic operate in the software application industry and are headquartered in Mountain View, California. Intuit focuses on financial management solutions and small business services, while Elastic delivers search and data analytics platforms for cloud environments. Intuit’s business model emphasizes financial compliance and consumer services, whereas Elastic centers on data processing and search technology, reflecting distinct market niches despite shared industry classification.
Income Statement Comparison
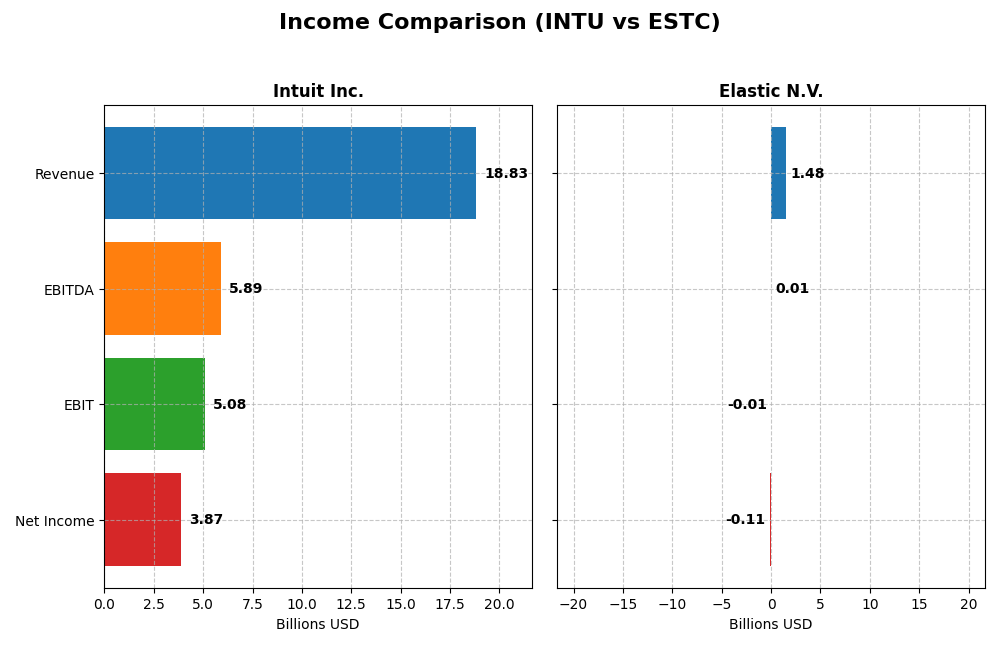
The following table compares key income statement metrics for Intuit Inc. and Elastic N.V. for their most recent fiscal year, providing a snapshot of their financial performance.
| Metric | Intuit Inc. (INTU) | Elastic N.V. (ESTC) |
|---|---|---|
| Market Cap | 151.6B | 7.6B |
| Revenue | 18.83B | 1.48B |
| EBITDA | 5.89B | 6.1M |
| EBIT | 5.08B | -6.3M |
| Net Income | 3.87B | -108.1M |
| EPS | 13.82 | -1.04 |
| Fiscal Year | 2025 | 2025 |
Income Statement Interpretations
Intuit Inc.
Intuit showed strong revenue growth from 9.63B in 2021 to 18.83B in 2025, nearly doubling over five years. Net income rose from 2.06B to 3.87B, reflecting robust profitability. Margins remained healthy, with a gross margin above 80% and net margin around 20%. In 2025, revenue growth accelerated by 15.63%, and net income improved by 12.92%, signaling solid margin stability and operational efficiency.
Elastic N.V.
Elastic’s revenue grew from 608M in 2021 to 1.48B in 2025, more than doubling, with net income fluctuating and a loss of 108M in 2025. Gross margin was favorable at 74.39%, but the EBIT margin was negative at -0.42%, and net margin stood at -7.29%. Despite 17% revenue growth in 2025, net margin declined sharply, reflecting ongoing profitability challenges despite improving operational scale.
Which one has the stronger fundamentals?
Intuit displays stronger fundamentals with consistently favorable margins, solid net income growth, and a high proportion of favorable income statement metrics. Elastic, while showing impressive revenue growth, struggles with negative net margins and erratic profitability. Intuit’s stable and improving profitability contrasts with Elastic’s ongoing losses, suggesting more resilient earnings quality and operational performance.
Financial Ratios Comparison
The table below presents a side-by-side comparison of key financial ratios for Intuit Inc. and Elastic N.V. based on their most recent fiscal year data, highlighting operational efficiency, profitability, liquidity, and leverage.
| Ratios | Intuit Inc. (INTU) FY 2025 | Elastic N.V. (ESTC) FY 2025 |
|---|---|---|
| ROE | 19.6% | -11.7% |
| ROIC | 14.8% | -3.4% |
| P/E | 56.8 | -82.7 |
| P/B | 11.2 | 9.6 |
| Current Ratio | 1.36 | 1.92 |
| Quick Ratio | 1.36 | 1.92 |
| D/E | 0.34 | 0.64 |
| Debt-to-Assets | 18.0% | 22.9% |
| Interest Coverage | 19.9 | -2.2 |
| Asset Turnover | 0.51 | 0.57 |
| Fixed Asset Turnover | 12.5 | 51.3 |
| Payout ratio | 30.7% | 0% |
| Dividend yield | 0.54% | 0% |
Interpretation of the Ratios
Intuit Inc.
Intuit presents predominantly favorable financial ratios, with strong net margin (20.55%), return on equity (19.63%), and return on invested capital (14.78%), indicating solid profitability and efficient capital use. However, high price-to-earnings (56.82) and price-to-book (11.15) ratios suggest valuation concerns. The company pays dividends, but with a modest yield of 0.54%, reflecting cautious shareholder returns supported by free cash flow.
Elastic N.V.
Elastic shows weaker financial health, with negative net margin (-7.29%), return on equity (-11.66%), and return on invested capital (-3.45%), highlighting ongoing losses and operational challenges. Its strong current and quick ratios (both 1.92) demonstrate good liquidity. The company does not pay dividends, consistent with its negative earnings and focus on reinvestment and growth, while maintaining a neutral debt position.
Which one has the best ratios?
Intuit exhibits a more favorable overall ratio profile, with a majority of key metrics indicating profitability, efficiency, and financial stability. Elastic’s ratios reflect financial strain and losses, despite some liquidity strengths. Therefore, Intuit’s ratios are generally stronger and more consistent with positive financial performance compared to Elastic’s mixed and neutral evaluation.
Strategic Positioning
This section compares the strategic positioning of Intuit Inc. and Elastic N.V., including market position, key segments, and exposure to technological disruption:
Intuit Inc.
- Large market cap of 151.6B USD in software sector with competitive pressure from diverse financial tech firms.
- Diverse segments: Small Business, Consumer, Credit Karma, and Professional Tax drive revenues across finance and accounting.
- Moderate exposure, providing cloud-based financial management tools with some innovation in payment and personal finance services.
Elastic N.V.
- Smaller market cap of 7.55B USD, focused on search technology with competition in multi-cloud environments.
- Revenue mainly from Subscription and Professional Services centered on Elastic Stack search and analytics solutions.
- High exposure, offering cloud-native, multi-cloud search and analytics software addressing data ingestion and visualization.
Intuit Inc. vs Elastic N.V. Positioning
Intuit shows a diversified business model spanning multiple financial software segments, offering broad market coverage. Elastic is more concentrated on search and analytics software, emphasizing cloud and data solutions, resulting in focused but potentially more technologically sensitive positioning.
Which has the best competitive advantage?
Intuit holds a slightly favorable moat by creating value with positive ROIC above WACC despite a declining trend. Elastic has a slightly unfavorable moat with negative ROIC but improving profitability, indicating value destruction but potential future gains.
Stock Comparison
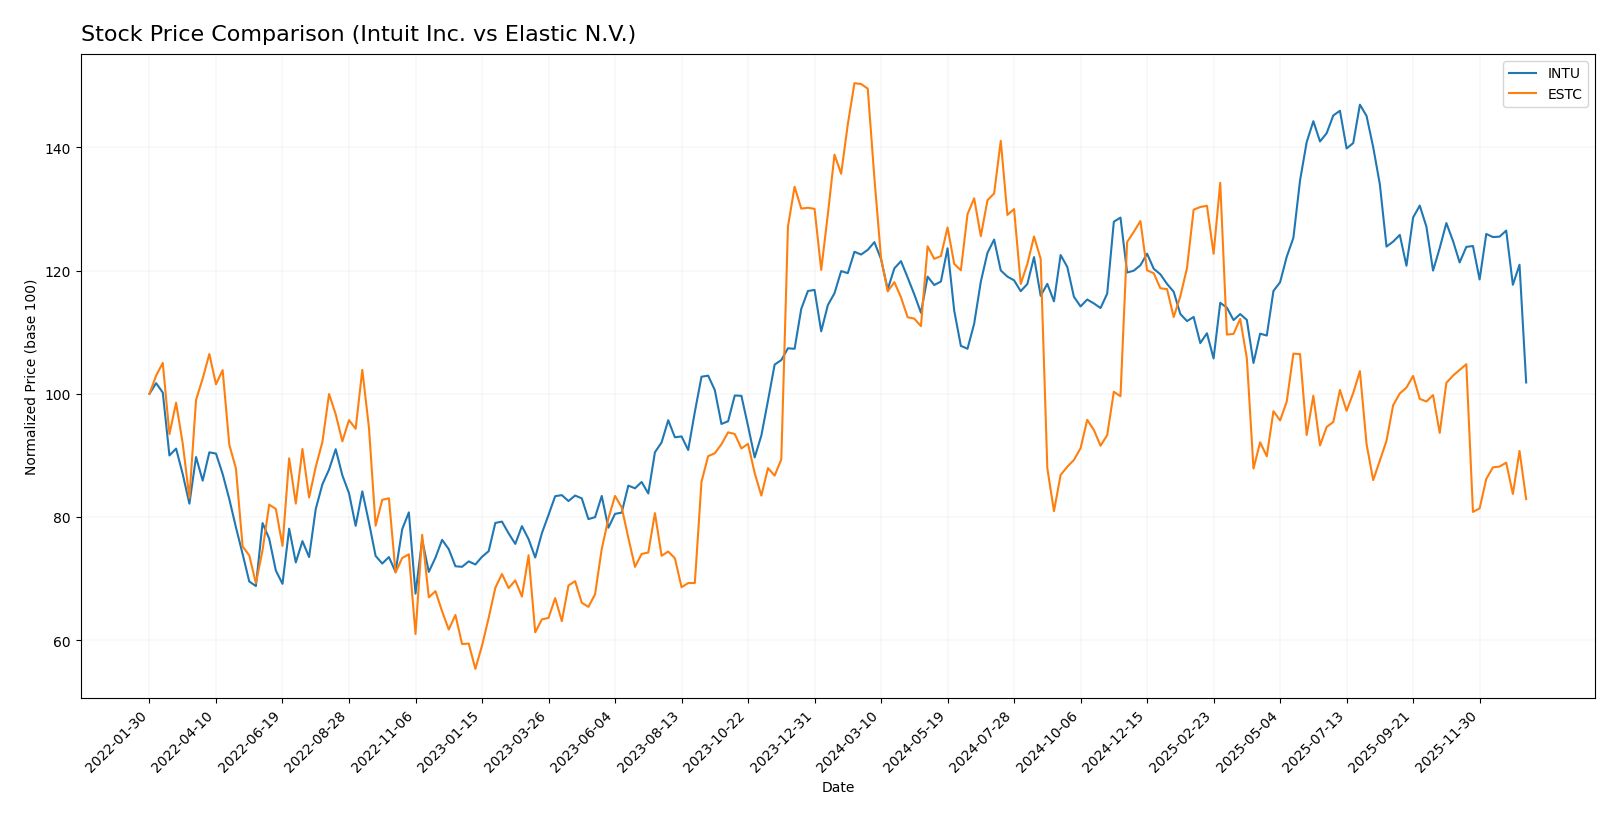
The stock price chart highlights significant bearish trends for both Intuit Inc. and Elastic N.V. over the past year, with marked declines and decelerating momentum in their trading dynamics.
Trend Analysis
Intuit Inc. (INTU) experienced a bearish trend with a -17.46% price change over the last 12 months, showing deceleration and volatility marked by a 51.52 standard deviation and a price range from 785.95 to 544.62.
Elastic N.V. (ESTC) also faced a bearish trend, with a sharper -44.58% price decline over the same period, decelerating and less volatile at 14.08 standard deviation, with prices fluctuating between 129.62 and 70.04.
Comparing both, Intuit delivered a higher market performance with a smaller loss than Elastic, indicating relatively less severe depreciation in share value over the past year.
Target Prices
Analysts present a clear target price consensus for Intuit Inc. and Elastic N.V., indicating potential upside for both stocks.
| Company | Target High | Target Low | Consensus |
|---|---|---|---|
| Intuit Inc. | 880 | 700 | 798.4 |
| Elastic N.V. | 134 | 76 | 108 |
The consensus target prices for Intuit Inc. and Elastic N.V. exceed their current stock prices of $544.51 and $71.66 respectively, suggesting analysts expect substantial growth potential.
Analyst Opinions Comparison
This section compares analysts’ ratings and financial scores for Intuit Inc. and Elastic N.V.:
Rating Comparison
Intuit Inc. Rating
- Rating: B, classified as Very Favorable
- Discounted Cash Flow Score: 4, Favorable
- Return on Equity Score: 4, Favorable
- Return on Assets Score: 5, Very Favorable
- Debt To Equity Score: 2, Moderate
- Overall Score: 3, Moderate
Elastic N.V. Rating
- Rating: C-, classified as Very Favorable
- Discounted Cash Flow Score: 3, Moderate
- Return on Equity Score: 1, Very Unfavorable
- Return on Assets Score: 1, Very Unfavorable
- Debt To Equity Score: 1, Very Unfavorable
- Overall Score: 1, Very Unfavorable
Which one is the best rated?
Based on the provided data, Intuit Inc. holds higher ratings and superior financial scores across key metrics compared to Elastic N.V., indicating a stronger overall analyst evaluation for Intuit.
Scores Comparison
The following table compares the Altman Z-Score and Piotroski Score for Intuit Inc. and Elastic N.V.:
Intuit Inc. Scores
- Altman Z-Score: 9.35, indicating a safe zone.
- Piotroski Score: 9, classified as very strong.
Elastic N.V. Scores
- Altman Z-Score: 3.51, indicating a safe zone.
- Piotroski Score: 4, classified as average.
Which company has the best scores?
Intuit Inc. has notably higher scores, with a stronger Piotroski score and a much higher Altman Z-Score compared to Elastic N.V., indicating better financial health based on the provided data.
Grades Comparison
The following presents the latest verified grades and ratings for Intuit Inc. and Elastic N.V.:
Intuit Inc. Grades
This table summarizes recent grades and rating actions from reputable financial institutions for Intuit Inc.:
| Grading Company | Action | New Grade | Date |
|---|---|---|---|
| Wells Fargo | Downgrade | Equal Weight | 2026-01-08 |
| Wells Fargo | Maintain | Overweight | 2025-11-21 |
| RBC Capital | Maintain | Outperform | 2025-11-21 |
| BMO Capital | Maintain | Outperform | 2025-11-21 |
| Evercore ISI Group | Maintain | Outperform | 2025-11-18 |
| RBC Capital | Maintain | Outperform | 2025-09-02 |
| RBC Capital | Maintain | Outperform | 2025-08-22 |
| UBS | Maintain | Neutral | 2025-08-22 |
| Morgan Stanley | Maintain | Overweight | 2025-08-22 |
| Barclays | Maintain | Overweight | 2025-08-22 |
Intuit’s grades predominantly show strong confidence with multiple “Outperform” and “Overweight” ratings, despite a recent downgrade to “Equal Weight” by Wells Fargo.
Elastic N.V. Grades
Below is a summary of recent grades and rating actions from verified grading firms for Elastic N.V.:
| Grading Company | Action | New Grade | Date |
|---|---|---|---|
| Barclays | Maintain | Overweight | 2026-01-12 |
| RBC Capital | Maintain | Outperform | 2026-01-05 |
| Jefferies | Maintain | Buy | 2026-01-05 |
| Citigroup | Maintain | Buy | 2025-11-24 |
| Wedbush | Maintain | Outperform | 2025-11-21 |
| B of A Securities | Maintain | Neutral | 2025-11-21 |
| Guggenheim | Maintain | Buy | 2025-11-21 |
| Wells Fargo | Maintain | Equal Weight | 2025-11-21 |
| RBC Capital | Maintain | Outperform | 2025-11-21 |
| Canaccord Genuity | Maintain | Buy | 2025-11-21 |
Elastic’s grades consistently indicate positive outlooks, with numerous “Buy,” “Outperform,” and “Overweight” ratings and no recent downgrades.
Which company has the best grades?
Both Intuit Inc. and Elastic N.V. have a consensus “Buy” rating, but Elastic shows a higher frequency of “Buy” and “Outperform” grades without recent downgrades, suggesting slightly stronger endorsement. This may imply a more favorable analyst sentiment for Elastic, potentially influencing investor confidence and portfolio positioning.
Strengths and Weaknesses
Below is a comparative table summarizing the key strengths and weaknesses of Intuit Inc. and Elastic N.V. based on the most recent financial and operational data.
| Criterion | Intuit Inc. (INTU) | Elastic N.V. (ESTC) |
|---|---|---|
| Diversification | Highly diversified with strong Consumer, Small Business & Self-Employed, and Credit Karma segments totaling over $17B in 2025 | Highly concentrated with 93% revenue from subscriptions ($1.38B in 2025) and smaller professional services segment |
| Profitability | Strong profitability with net margin 20.55%, ROIC 14.78%, and positive value creation (ROIC > WACC by 5.37%) | Negative profitability: net margin -7.29%, ROIC -3.45%, value destroying (ROIC < WACC by -11.24%), but improving ROIC trend |
| Innovation | Moderate innovation with established product ecosystem, but ROIC trend is declining (-5.26%) | High innovation indicated by rapid ROIC growth (+85.85%), focusing on subscription-based software |
| Global presence | Established global business solutions segment generating $11B+ | Growing global presence via cloud subscription services but smaller scale overall |
| Market Share | Large market share in tax and financial management software | Niche player in search and data analytics software with smaller market share |
Key takeaways: Intuit shows strong and diversified revenue streams with solid profitability but faces a declining profitability trend. Elastic is less profitable currently but demonstrates rapid improvement and innovation potential in a growing market niche. Investors should weigh Intuit’s stable cash flow against Elastic’s growth opportunity and risk.
Risk Analysis
Below is a risk comparison table for Intuit Inc. (INTU) and Elastic N.V. (ESTC) based on the most recent data from 2025:
| Metric | Intuit Inc. (INTU) | Elastic N.V. (ESTC) |
|---|---|---|
| Market Risk | Moderate (Beta 1.25) | Lower (Beta 0.93) |
| Debt Level | Low (D/E 0.34, favorable) | Moderate (D/E 0.64, neutral) |
| Regulatory Risk | Moderate | Moderate |
| Operational Risk | Low | Moderate |
| Environmental Risk | Low | Low |
| Geopolitical Risk | Moderate | Moderate |
Intuit faces moderate market and regulatory risks but benefits from low debt and strong operational stability. Elastic shows higher operational challenges and weaker profitability, with moderate debt risk. Market volatility and Elastic’s negative margins are the most impactful risks currently.
Which Stock to Choose?
Intuit Inc. (INTU) shows strong income growth with a 95% revenue increase over 2021-2025 and favorable profitability metrics, including a 20.55% net margin and 19.63% ROE. It maintains moderate debt levels (net debt to EBITDA 0.64) and a solid rating of B with a favorable global financial ratio evaluation.
Elastic N.V. (ESTC) posts a 144% revenue growth over the same period but suffers from a negative net margin of -7.29% and ROE of -11.66%. Debt levels are moderate, but the company’s global financial ratio evaluation is neutral, with a lower rating of C- and signs of value destruction despite improving profitability trends.
For investors, Intuit’s very favorable rating and consistent value creation with strong income and financial ratios might appeal to those prioritizing stability and quality. Conversely, Elastic’s rapid growth and improving profitability could be of interest to risk-tolerant investors seeking potential turnaround or growth opportunities.
Disclaimer: Investment carries a risk of loss of initial capital. The past performance is not a reliable indicator of future results. Be sure to understand risks before making an investment decision.
Go Further
I encourage you to read the complete analyses of Intuit Inc. and Elastic N.V. to enhance your investment decisions: