In today’s fast-evolving tech landscape, Figma, Inc. and Elastic N.V. stand out as innovative leaders within the software application industry. Both companies focus on enhancing productivity—Figma through collaborative design tools, and Elastic by delivering powerful data search and analytics solutions. Their market overlap and cutting-edge strategies make them compelling investment candidates. Join me as we explore which company offers the most promising opportunity for your portfolio.

Table of contents
Companies Overview
I will begin the comparison between Figma, Inc. and Elastic N.V. by providing an overview of these two companies and their main differences.
Figma Overview
Figma, Inc. develops a browser-based tool focused on designing user interfaces, targeting design and development teams. Its product suite includes collaborative design, prototyping, and presentation tools that streamline product development. Founded in 2012 and headquartered in San Francisco, Figma operates in the software application industry with a market cap of $14.4B, emphasizing innovation in design collaboration.
Elastic Overview
Elastic N.V. offers cloud-compatible technology solutions centered on data ingestion, search, and analysis. Its Elastic Stack product portfolio includes Elasticsearch, Kibana, Beats, and Logstash, catering to diverse data management needs across multi-cloud environments. Established in 2012 and based in Mountain View, Elastic holds a $7.5B market cap and specializes in real-time search and analytics software.
Key similarities and differences
Both Figma and Elastic operate in the software application sector, serving technology-driven markets with cloud-oriented solutions. While Figma focuses on collaborative design tools for product development, Elastic emphasizes data search and analytics across multi-cloud environments. Figma’s platform targets creative workflows, whereas Elastic provides infrastructure for data management, highlighting distinct but complementary business models.
Income Statement Comparison
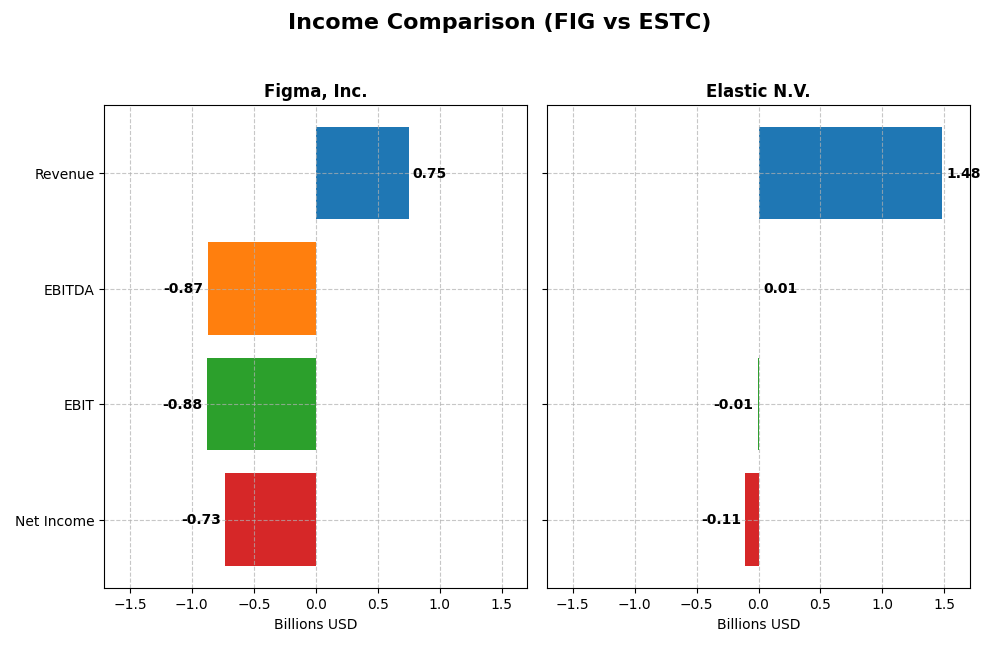
This table compares key income statement metrics for Figma, Inc. and Elastic N.V. based on their most recent fiscal year results.
| Metric | Figma, Inc. (FIG) | Elastic N.V. (ESTC) |
|---|---|---|
| Market Cap | 14.4B | 7.5B |
| Revenue | 749M | 1.48B |
| EBITDA | -870M | 6.05M |
| EBIT | -877M | -6.26M |
| Net Income | -732M | -108M |
| EPS | -3.11 | -1.04 |
| Fiscal Year | 2024 | 2025 |
Income Statement Interpretations
Figma, Inc.
Figma experienced a strong revenue increase of 48.36% from 2023 to 2024, with gross margins remaining favorable at 88.32%. However, net income sharply declined, resulting in a negative net margin of -97.74%, reflecting increased operating expenses and significant net losses in 2024. Despite top-line growth, profitability deteriorated markedly in the latest year.
Elastic N.V.
Elastic showed consistent revenue growth over 2021-2025, with a 17.04% rise from 2024 to 2025 and a favorable gross margin of 74.39%. Operating income remained negative but improved in 2025, demonstrating operational progress. Net margin stayed negative at -7.29%, with mixed trends in net income growth, though overall fundamentals improved over the period.
Which one has the stronger fundamentals?
Elastic N.V. displays stronger fundamentals with 71.43% of its income statement metrics rated favorable, including steady revenue and net income growth, and improving margins. In contrast, Figma’s fundamentals are weaker, with 64.29% unfavorable metrics driven by heavy losses despite revenue gains. Elastic’s operational improvements suggest better financial stability comparatively.
Financial Ratios Comparison
The table below presents a side-by-side comparison of key financial ratios for Figma, Inc. (FIG) and Elastic N.V. (ESTC) based on their most recent fiscal year data.
| Ratios | Figma, Inc. (2024) | Elastic N.V. (2025) |
|---|---|---|
| ROE | -55.3% | -11.7% |
| ROIC | -59.7% | -3.4% |
| P/E | -70.7 | -82.7 |
| P/B | 39.1 | 9.6 |
| Current Ratio | 3.66 | 1.92 |
| Quick Ratio | 3.66 | 1.92 |
| D/E (Debt-to-Equity) | 0.022 | 0.64 |
| Debt-to-Assets | 1.6% | 22.9% |
| Interest Coverage | 0 | -2.17 |
| Asset Turnover | 0.42 | 0.57 |
| Fixed Asset Turnover | 17.1 | 51.3 |
| Payout Ratio | 0% | 0% |
| Dividend Yield | 0% | 0% |
Interpretation of the Ratios
Figma, Inc.
Figma exhibits a mixed financial profile with a majority of unfavorable ratios, including negative net margin (-97.74%) and return on equity (-55.29%), indicating profitability and efficiency challenges. Strong points include a low debt-to-equity ratio (0.02) and a high quick ratio (3.66), suggesting solid liquidity and low leverage. The company does not pay dividends, likely due to ongoing reinvestment in growth and innovation.
Elastic N.V.
Elastic shows a more balanced ratio profile with an equal share of favorable and unfavorable metrics. Key weaknesses include a negative net margin (-7.29%) and return on equity (-11.66%), reflecting ongoing profitability pressures. However, it maintains a healthy current and quick ratio (~1.92) and a favorable weighted average cost of capital (7.83%). Elastic also does not distribute dividends, possibly prioritizing reinvestment and growth strategies.
Which one has the best ratios?
Elastic N.V. presents a more neutral ratio outlook, balancing strengths in liquidity and cost of capital against profitability weaknesses. Figma, despite strong liquidity and very low leverage, faces more pronounced unfavorable profitability and operational metrics. Overall, Elastic’s ratios indicate a more stable financial position compared to Figma’s predominantly unfavorable profile.
Strategic Positioning
This section compares the strategic positioning of Figma and Elastic, including Market position, Key segments, and exposure to technological disruption:
Figma, Inc.
- Competes in software application with high volatility and intense competitive pressure.
- Focuses on collaborative design tools for UI/UX and prototyping to streamline product development.
- Faces disruption risk from fast-evolving design and AI tools integrated in its platform.
Elastic N.V.
- Operates in software application with moderate competitive pressure and stable market presence.
- Key segments are subscription software and professional services, driven by Elastic Stack products.
- Exposed to cloud and multi-cloud environment shifts; relies on continuous innovation in search tech.
Figma vs Elastic Positioning
Figma’s strategy centers on concentrated, user-interface design solutions with AI enhancements, while Elastic adopts a diversified approach with subscriptions and services around data search and analytics. Figma risks higher volatility; Elastic benefits from multiple revenue streams but faces cloud technology challenges.
Which has the best competitive advantage?
Elastic shows a slightly unfavorable moat with improving profitability and diversified revenue, signaling potential for value creation. Figma’s very unfavorable moat and declining profitability suggest value destruction, indicating weaker competitive advantage currently.
Stock Comparison
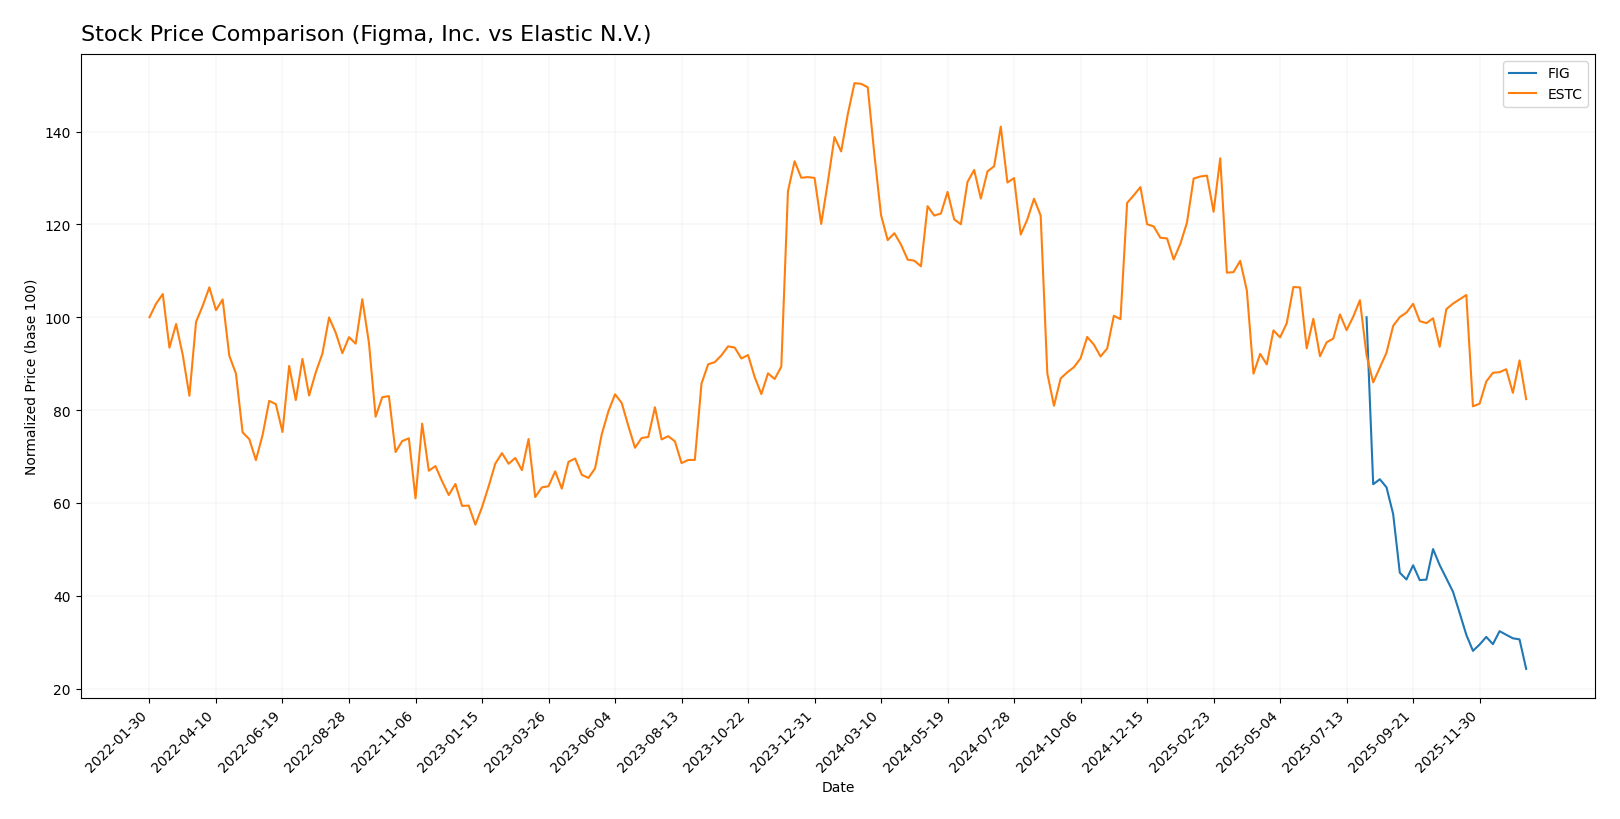
The stock prices of Figma, Inc. (FIG) and Elastic N.V. (ESTC) have both experienced significant declines over the past 12 months, with FIG showing accelerated bearish momentum and ESTC exhibiting decelerating losses amid contrasting volume trends.
Trend Analysis
Figma, Inc. (FIG) has endured a strong bearish trend over the past year, with its stock price falling by 75.76%. The decline has accelerated recently, accompanied by high volatility, as indicated by a 19.95 standard deviation and a recent 40.67% drop.
Elastic N.V. (ESTC) also shows a bearish trend with a 44.93% price decrease over the same period. However, the decline appears to be decelerating with lower volatility (14.08 std deviation) and a smaller recent drop of 20.0%.
Comparing the two, Elastic N.V. has outperformed Figma, Inc. in market performance, delivering a smaller percentage loss and exhibiting signs of trend deceleration versus FIG’s accelerating bearish momentum.
Target Prices
The current analyst consensus reveals promising upside potential for both Figma, Inc. and Elastic N.V.
| Company | Target High | Target Low | Consensus |
|---|---|---|---|
| Figma, Inc. | 52 | 38 | 43.6 |
| Elastic N.V. | 134 | 76 | 108 |
Analysts expect Figma’s stock to rise significantly from its current price of $29.57, while Elastic’s target consensus indicates a potential increase from $71.38, reflecting overall positive sentiment and growth expectations.
Analyst Opinions Comparison
This section compares analysts’ ratings and grades for Figma, Inc. (FIG) and Elastic N.V. (ESTC):
Rating Comparison
FIG Rating
- Rating: C+, considered very favorable by analysts.
- Discounted Cash Flow Score: 4, indicating favorable DCF.
- ROE Score: 1, marked very unfavorable for ROE.
- ROA Score: 1, very unfavorable asset utilization.
- Debt To Equity Score: 4, favorable financial stability.
- Overall Score: 2, moderate overall financial standing.
ESTC Rating
- Rating: C-, also viewed as very favorable overall.
- Discounted Cash Flow Score: 3, assessed as moderate.
- ROE Score: 1, similarly very unfavorable for ROE.
- ROA Score: 1, equally very unfavorable for asset use.
- Debt To Equity Score: 1, very unfavorable balance sheet.
- Overall Score: 1, very unfavorable overall score.
Which one is the best rated?
Based strictly on the provided data, FIG holds a higher overall score (2 vs. 1) and better discounted cash flow and debt to equity scores than ESTC. Both have equally low ROE and ROA scores. Thus, FIG is better rated overall.
Scores Comparison
The following table compares the Altman Z-Score and Piotroski Score for Figma, Inc. and Elastic N.V.:
FIG Scores
- Altman Z-Score: 14.34, indicating a safe zone and very low bankruptcy risk.
- Piotroski Score: 4, reflecting average financial strength.
ESTC Scores
- Altman Z-Score: 3.51, indicating a safe zone with low bankruptcy risk.
- Piotroski Score: 4, reflecting average financial strength.
Which company has the best scores?
Based strictly on the data, FIG shows a much higher Altman Z-Score, suggesting stronger financial stability. Both companies have the same average Piotroski Score, indicating similar financial health levels.
Grades Comparison
Here is a detailed comparison of the recent grades assigned to Figma, Inc. and Elastic N.V.:
Figma, Inc. Grades
The following table summarizes the latest grades issued by reputable financial institutions for Figma, Inc.:
| Grading Company | Action | New Grade | Date |
|---|---|---|---|
| Morgan Stanley | Maintain | Equal Weight | 2026-01-15 |
| Wells Fargo | Upgrade | Overweight | 2026-01-08 |
| RBC Capital | Maintain | Sector Perform | 2026-01-05 |
| Goldman Sachs | Maintain | Neutral | 2025-11-07 |
| JP Morgan | Maintain | Neutral | 2025-11-06 |
| Piper Sandler | Maintain | Overweight | 2025-11-06 |
| Wells Fargo | Maintain | Equal Weight | 2025-11-05 |
| Wells Fargo | Maintain | Equal Weight | 2025-09-04 |
| Morgan Stanley | Maintain | Equal Weight | 2025-09-04 |
| RBC Capital | Maintain | Sector Perform | 2025-09-04 |
Figma’s grades mostly indicate a neutral to slightly positive stance, with repeated “Equal Weight” and “Neutral” ratings and occasional “Overweight” assessments.
Elastic N.V. Grades
Below is the table presenting the recent grades from established rating firms for Elastic N.V.:
| Grading Company | Action | New Grade | Date |
|---|---|---|---|
| Barclays | Maintain | Overweight | 2026-01-12 |
| RBC Capital | Maintain | Outperform | 2026-01-05 |
| Jefferies | Maintain | Buy | 2026-01-05 |
| Citigroup | Maintain | Buy | 2025-11-24 |
| Wedbush | Maintain | Outperform | 2025-11-21 |
| B of A Securities | Maintain | Neutral | 2025-11-21 |
| Guggenheim | Maintain | Buy | 2025-11-21 |
| Wells Fargo | Maintain | Equal Weight | 2025-11-21 |
| RBC Capital | Maintain | Outperform | 2025-11-21 |
| Canaccord Genuity | Maintain | Buy | 2025-11-21 |
Elastic N.V. exhibits a stronger consensus toward positive ratings, with multiple “Buy” and “Outperform” grades and fewer neutral assessments.
Which company has the best grades?
Elastic N.V. has received notably more favorable grades than Figma, Inc., with a majority of “Buy” and “Outperform” ratings versus Figma’s predominance of “Equal Weight” and “Neutral.” This disparity could influence investor sentiment by highlighting Elastic’s stronger growth potential or market confidence.
Strengths and Weaknesses
The table below compares key strengths and weaknesses of Figma, Inc. (FIG) and Elastic N.V. (ESTC) based on recent financial and operational data.
| Criterion | Figma, Inc. (FIG) | Elastic N.V. (ESTC) |
|---|---|---|
| Diversification | Limited product range, focus on design collaboration tools | More diversified with strong subscription and growing professional services revenue |
| Profitability | Negative margins and ROIC; value destroying (-64% vs WACC) | Negative profitability but improving ROIC trend; slightly unfavorable (-11% vs WACC) |
| Innovation | Strong brand in design software but declining profitability may limit R&D | Consistent innovation in search and data analytics with improving returns |
| Global presence | Growing but smaller scale and less mature global footprint | Established global presence with expanding customer base |
| Market Share | Niche leadership in UI/UX design tools | Significant player in enterprise search and analytics markets |
Overall, Elastic shows a more balanced profile with improving profitability trends and diversified revenue streams, while Figma struggles with declining returns and value destruction despite its strong design software niche. Investors should weigh Elastic’s growth trajectory against Figma’s current financial challenges.
Risk Analysis
Below is a comparative table summarizing key risks for Figma, Inc. (FIG) and Elastic N.V. (ESTC) based on the most recent data available in 2026:
| Metric | Figma, Inc. (FIG) | Elastic N.V. (ESTC) |
|---|---|---|
| Market Risk | High volatility, beta -3.80 indicates unusual market sensitivity | Moderate volatility, beta 0.93 indicates typical market sensitivity |
| Debt level | Very low debt, debt-to-equity 0.02, low financial risk | Moderate debt, debt-to-equity 0.64, manageable but notable leverage |
| Regulatory Risk | Moderate, US technology sector subject to evolving data/privacy regulations | Moderate, operates globally with compliance in multi-cloud environments |
| Operational Risk | High, negative margins (-97.7%), weak profitability and asset turnover | Moderate, improving but still negative margins (-7.3%) and returns |
| Environmental Risk | Low, primarily software development with minimal direct environmental impact | Low, mainly software with limited environmental footprint |
| Geopolitical Risk | Low to moderate, US-based with global clients | Moderate, exposure to international markets with potential geopolitical tension |
In synthesis, Figma faces the most impactful risks from operational underperformance and extreme market volatility, reflected in its negative profitability and unusual beta. Elastic, while also showing profitability challenges, maintains moderate market and debt risks with a more stable operational profile. Investors should weigh Figma’s high market risk and poor financial ratios against Elastic’s moderate leverage and geopolitical exposure.
Which Stock to Choose?
Figma, Inc. (FIG) shows strong revenue growth of 48.36% in 2024 but suffers from severe profitability issues, including a net margin of -97.74% and declining returns on equity and capital. Its debt levels are low, and liquidity ratios are mixed; overall, its financial ratios and income statement are unfavorable, with a very unfavorable MOAT and a moderate rating of C+.
Elastic N.V. (ESTC) experienced a revenue increase of 17.04% in 2025 with a more favorable income statement trend, despite a net margin of -7.29%. Financial ratios are mixed but lean toward neutral, with a slightly unfavorable MOAT due to value destruction but improving profitability. ESTC’s rating is slightly lower at C- with safe-zone bankruptcy risk and average Piotroski scores.
Investors seeking growth might find FIG’s high revenue expansion appealing despite its unfavorable profitability and value destruction, while those prioritizing improving profitability and more balanced financial health may view ESTC as a more neutral option given its slight improvement in MOAT and income metrics.
Disclaimer: Investment carries a risk of loss of initial capital. The past performance is not a reliable indicator of future results. Be sure to understand risks before making an investment decision.
Go Further
I encourage you to read the complete analyses of Figma, Inc. and Elastic N.V. to enhance your investment decisions: