Home > Comparison > Technology > FICO vs ESTC
The strategic rivalry between Fair Isaac Corporation and Elastic N.V. shapes the evolution of the technology sector’s software application industry. Fair Isaac operates as a data-driven analytics pioneer focused on decision management and scoring solutions. Elastic N.V. excels as a cloud-centric search and analytics platform provider for multi-cloud environments. This analysis pits Fair Isaac’s established model against Elastic’s innovative stack to identify which offers superior risk-adjusted returns for diversified portfolios.
Table of contents
Companies Overview
Fair Isaac Corporation and Elastic N.V. hold pivotal roles in the software application sector, shaping data-driven decision-making and search technology markets.
Fair Isaac Corporation: Leader in Decision Analytics
Fair Isaac Corporation dominates the decision analytics market by developing software and data management products that automate business decisions. Its revenue stems from two segments: Scores, offering B2B and B2C scoring solutions, and Software, delivering decision management platforms for fraud detection, marketing, and compliance. In 2026, the company focuses strategically on expanding advanced analytic and decision-use cases globally.
Elastic N.V.: Innovator in Search Technology
Elastic N.V. commands the search and analytics software space with its Elastic Stack, a suite designed for multi-cloud environments. Revenue primarily derives from products like Elasticsearch and Kibana, which enable real-time data ingestion, search, and visualization. Its 2026 strategy centers on enhancing platform capabilities to unify data processing and security in hybrid cloud deployments.
Strategic Collision: Similarities & Divergences
Both companies leverage data-centric software to empower enterprises but differ in approach. Fair Isaac offers pre-configured decision management solutions focused on risk and compliance, while Elastic builds open, extensible search infrastructure for diverse data types. Their primary clash occurs in serving analytics-driven business operations. Investment profiles diverge with Fair Isaac’s established market dominance versus Elastic’s growth-oriented platform innovation.
Income Statement Comparison
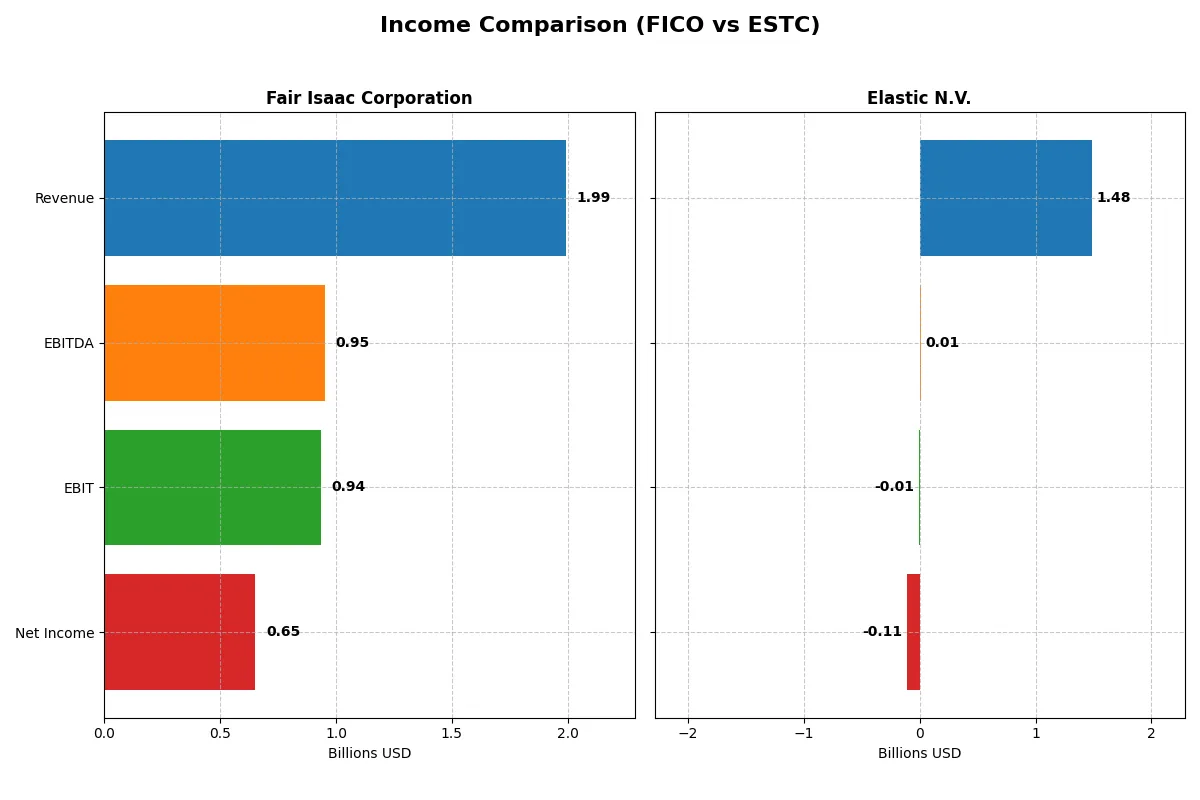
This data dissects the core profitability and scalability of both corporate engines to reveal who dominates the bottom line:
| Metric | Fair Isaac Corporation (FICO) | Elastic N.V. (ESTC) |
|---|---|---|
| Revenue | 1.99B | 1.48B |
| Cost of Revenue | 354M | 380M |
| Operating Expenses | 712M | 1.16B |
| Gross Profit | 1.64B | 1.10B |
| EBITDA | 951M | 6.1M |
| EBIT | 936M | -6.3M |
| Interest Expense | 134M | 25M |
| Net Income | 652M | -108M |
| EPS | 26.9 | -1.04 |
| Fiscal Year | 2025 | 2025 |
Income Statement Analysis: The Bottom-Line Duel
This income statement comparison reveals which company runs a more efficient and profitable engine through their revenue and net income trends.
Fair Isaac Corporation Analysis
Fair Isaac Corporation grows revenue from $1.3B in 2021 to $2.0B in 2025, with net income rising from $392M to $652M. Gross margin stays strong above 82%, while net margin reaches 32.75%, reflecting excellent cost control. The latest year shows accelerating profitability with a 25% EBIT growth and a near 30% EPS surge.
Elastic N.V. Analysis
Elastic N.V. expands revenue from $608M in 2021 to $1.48B in 2025, nearly doubling its scale. Gross margin is healthy at 74%, but the company struggles with a negative EBIT margin and net losses of $108M in 2025. Despite strong topline growth, persistent operating losses and negative net margins highlight profitability challenges.
Margin Dominance vs. Growth Struggles
Fair Isaac leads with superior margins and consistent net income growth, while Elastic impresses with rapid revenue expansion but suffers from unprofitable operations. Fair Isaac’s profile suits investors prioritizing strong, efficient earnings. Elastic requires cautious scrutiny due to ongoing losses despite growth momentum.
Financial Ratios Comparison
These vital ratios act as a diagnostic tool to expose the underlying fiscal health, valuation premiums, and capital efficiency for both companies:
| Ratios | Fair Isaac Corporation (FICO) | Elastic N.V. (ESTC) |
|---|---|---|
| ROE | -37.3% | -11.7% |
| ROIC | 52.96% | -3.45% |
| P/E | 55.64 | -82.65 |
| P/B | -20.78 | 9.64 |
| Current Ratio | 0.83 | 1.92 |
| Quick Ratio | 0.83 | 1.92 |
| D/E | -1.76 | 0.64 |
| Debt-to-Assets | 164.6% | 22.9% |
| Interest Coverage | 6.92 | -2.17 |
| Asset Turnover | 1.07 | 0.57 |
| Fixed Asset Turnover | 21.20 | 51.28 |
| Payout ratio | 0 | 0 |
| Dividend yield | 0 | 0 |
| Fiscal Year | 2025 | 2025 |
Efficiency & Valuation Duel: The Vital Signs
Ratios act as a company’s DNA, revealing hidden risks and operational excellence beyond surface-level financials.
Fair Isaac Corporation
Fair Isaac shows strong operational efficiency with a 32.75% net margin and a robust 52.96% ROIC, far exceeding its 9.39% WACC. However, a stretched P/E of 55.64 signals expensive valuation. Shareholders see no dividends; capital appears reinvested into R&D (9.5% of revenue) to fuel growth, despite a weak current ratio of 0.83.
Elastic N.V.
Elastic posts a negative net margin (-7.29%) and poor returns: ROE at -11.66% and ROIC at -3.45%, reflecting profitability challenges. Its valuation metrics are mixed; a favorable negative P/E contrasts with a high P/B of 9.64. The firm maintains strong liquidity (current ratio 1.92) but offers no dividend, indicating reinvestment focused on R&D (24.7% of revenue).
Premium Valuation vs. Operational Safety
Fair Isaac commands a premium valuation backed by solid profitability and reinvestment strategy but suffers liquidity concerns. Elastic trades cheaper in P/E terms but struggles with losses and weaker returns, offset by stronger liquidity. Investors prioritizing operational strength may prefer Fair Isaac, while those favoring liquidity might lean toward Elastic.
Which one offers the Superior Shareholder Reward?
Fair Isaac Corporation (FICO) and Elastic N.V. (ESTC) both forego dividends in 2026, focusing on capital appreciation. FICO generates robust free cash flow of $31.8/share with no dividend payout, emphasizing buybacks to reward shareholders. ESTC, while free cash flow positive at $2.5/share, operates with negative net margins and no buybacks, reinvesting heavily in growth. FICO’s high operating margins (~47%) and sustainable buyback capacity offer a clearer path to durable shareholder value. I see FICO as the superior total return choice for disciplined investors seeking stability and capital efficiency in 2026.
Comparative Score Analysis: The Strategic Profile
The radar chart reveals the fundamental DNA and trade-offs of Fair Isaac Corporation and Elastic N.V., highlighting their financial strengths and weaknesses side by side:
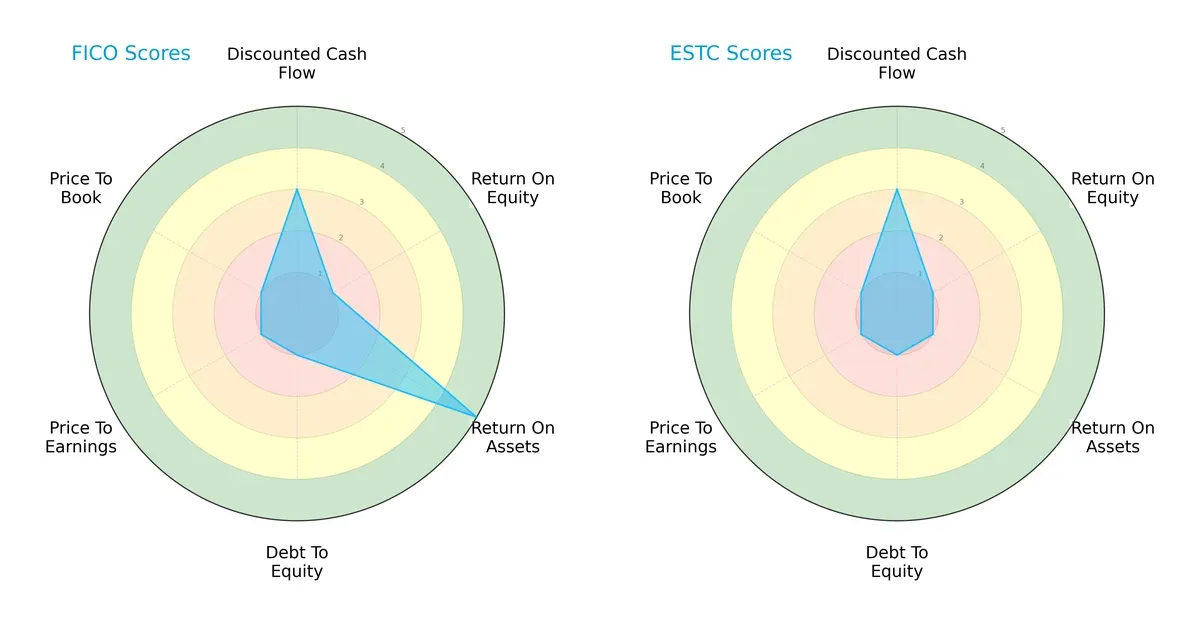
Fair Isaac Corporation (FICO) excels in asset utilization (ROA: 5) but suffers from weak equity returns (ROE: 1) and high leverage (Debt/Equity: 1). Elastic N.V. (ESTC) shows moderate DCF scores but lags significantly in ROA and overall financial health. FICO presents a more balanced profile, leveraging operational efficiency, while ESTC relies on modest cash flow projections but struggles with profitability and balance sheet metrics.
—
Bankruptcy Risk: Solvency Showdown
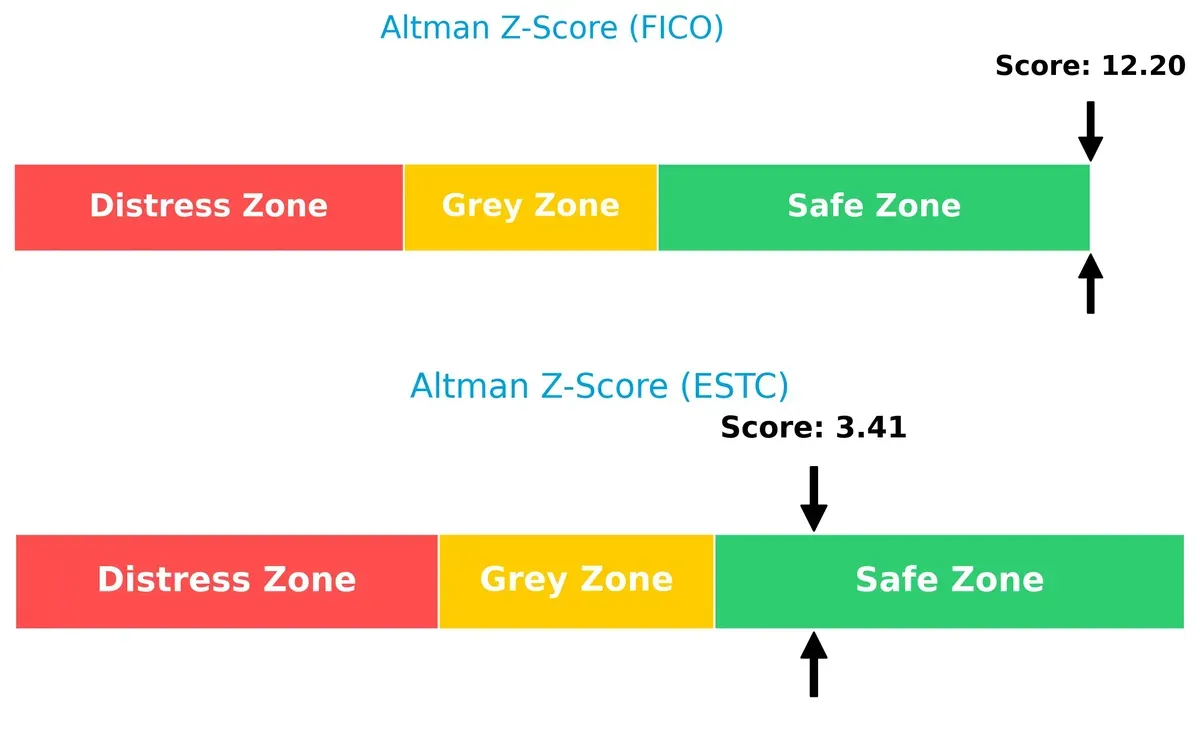
Fair Isaac Corporation’s Altman Z-Score of 12.2 far exceeds Elastic N.V.’s 3.4, signaling stronger long-term solvency and resilience in this economic cycle:
—
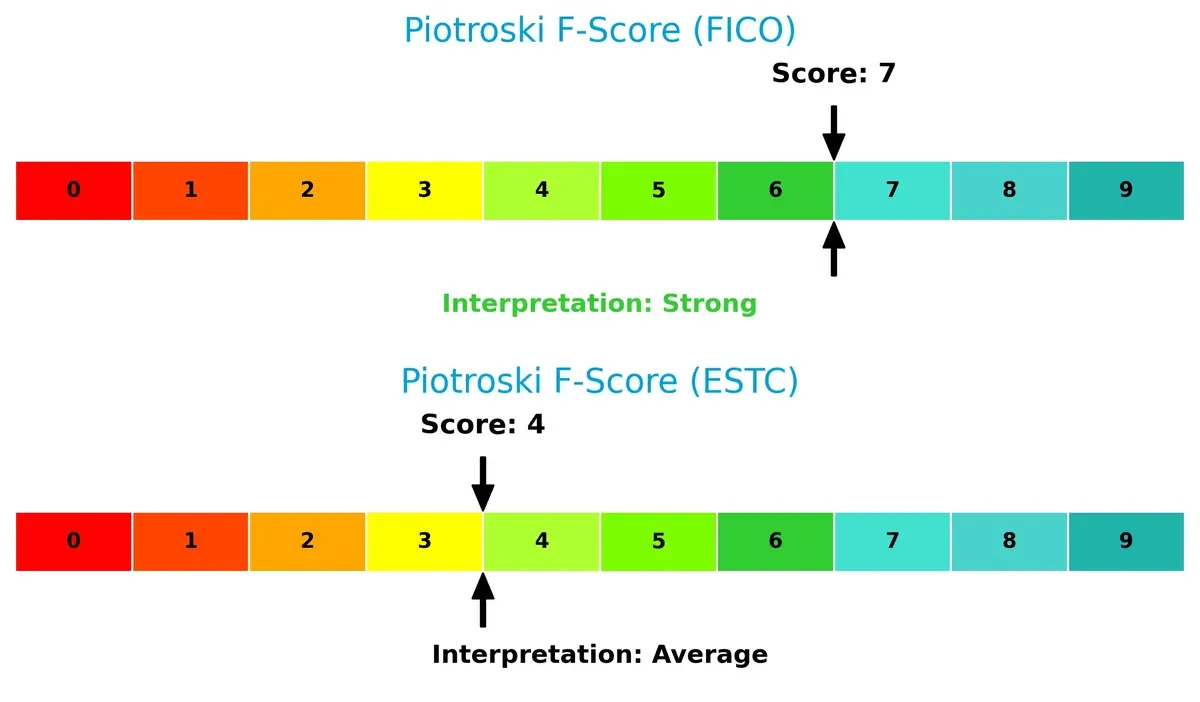
Financial Health: Quality of Operations
Fair Isaac Corporation scores a robust 7 on the Piotroski F-Score, indicating strong internal financial health. Elastic N.V.’s score of 4 signals caution, with potential red flags in operational efficiency and leverage:
How are the two companies positioned?
This section dissects the operational DNA of FICO and ESTC by comparing their revenue distribution and internal dynamics. The goal is to confront their economic moats to identify the most resilient competitive advantage in today’s market.
Revenue Segmentation: The Strategic Mix
This visual comparison dissects how Fair Isaac Corporation and Elastic N.V. diversify their income streams and reveals where their primary sector bets lie:
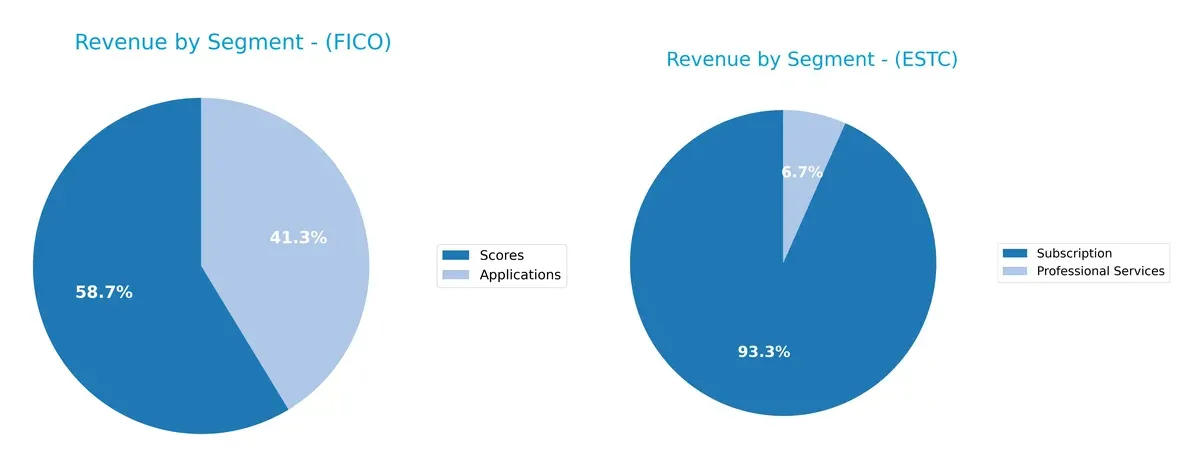
Fair Isaac Corporation pivots on two significant segments: Scores at $1.17B and Applications at $822M in 2025, showing a balanced yet concentrated tech-driven model. Elastic N.V. anchors its revenues overwhelmingly in Subscriptions at $1.38B, with Professional Services trailing at $98.8M, indicating a dominant SaaS focus. FICO’s dual-segment approach mitigates concentration risk, while ESTC’s heavy subscription reliance offers scale but heightens exposure to market shifts in recurring revenue demand.
Strengths and Weaknesses Comparison
This table compares the Strengths and Weaknesses of Fair Isaac Corporation and Elastic N.V.:
FICO Strengths
- Strong net margin at 32.75%
- High ROIC of 52.96% exceeding WACC
- Favorable debt-to-equity and interest coverage
- Solid asset turnover ratios
- Significant revenue from both Software and Scores
- Broad geographic presence, especially Americas
ESTC Strengths
- Favorable WACC at 7.78% supporting cost of capital
- High fixed asset turnover at 51.28
- Strong current and quick ratios above 1.9
- Growing Subscription revenue stream
- Balanced US and Non-US revenue exposure
FICO Weaknesses
- Negative ROE at -37.34%
- Unfavorable PE ratio at 55.64
- Low current ratio at 0.83 signals liquidity risk
- High debt-to-assets at 164.6%
- No dividend yield
- Heavy reliance on Americas region
ESTC Weaknesses
- Negative net margin and ROE
- Negative ROIC signals poor capital returns
- Unfavorable interest coverage at -0.25
- Unfavorable PB ratio at 9.64
- Zero dividend yield
- Lower asset turnover compared to peers
Fair Isaac’s strengths lie in profitability and capital efficiency but face liquidity and leverage concerns. Elastic shows operational efficiency and liquidity yet struggles with profitability and capital returns. These contrasts highlight each company’s distinct strategic and financial challenges.
The Moat Duel: Analyzing Competitive Defensibility
A structural moat is the only thing protecting long-term profits from relentless competition erosion. Let’s dissect the competitive moats of two software leaders:
Fair Isaac Corporation (FICO): Data-Driven Switching Costs
FICO’s moat stems from entrenched switching costs in credit scoring and decision analytics. Its 82% gross margin and 47% EBIT margin confirm deep profitability. Expanding decision management solutions in 2026 should further strengthen this moat.
Elastic N.V. (ESTC): Open-Source Network Effects
Elastic leverages network effects via its Elastic Stack platform, fostering broad user adoption. However, negative EBIT and net margins highlight profitability challenges versus FICO. Growth in multi-cloud deployments offers upside but also intensifies competitive pressure.
Switching Costs vs. Network Effects: The Moat Showdown
FICO’s switching-cost moat is wider and more profitable, reflected in its superior ROIC versus WACC and margin stability. Elastic’s network effects show promise but its value destruction signals a shallower moat. FICO is better equipped to defend market share in 2026.
Which stock offers better returns?
The past year reveals contrasting dynamics: Fair Isaac Corporation (FICO) posts a 12.51% gain with decelerating momentum, while Elastic N.V. (ESTC) suffers a 37.64% loss amid slowing decline.
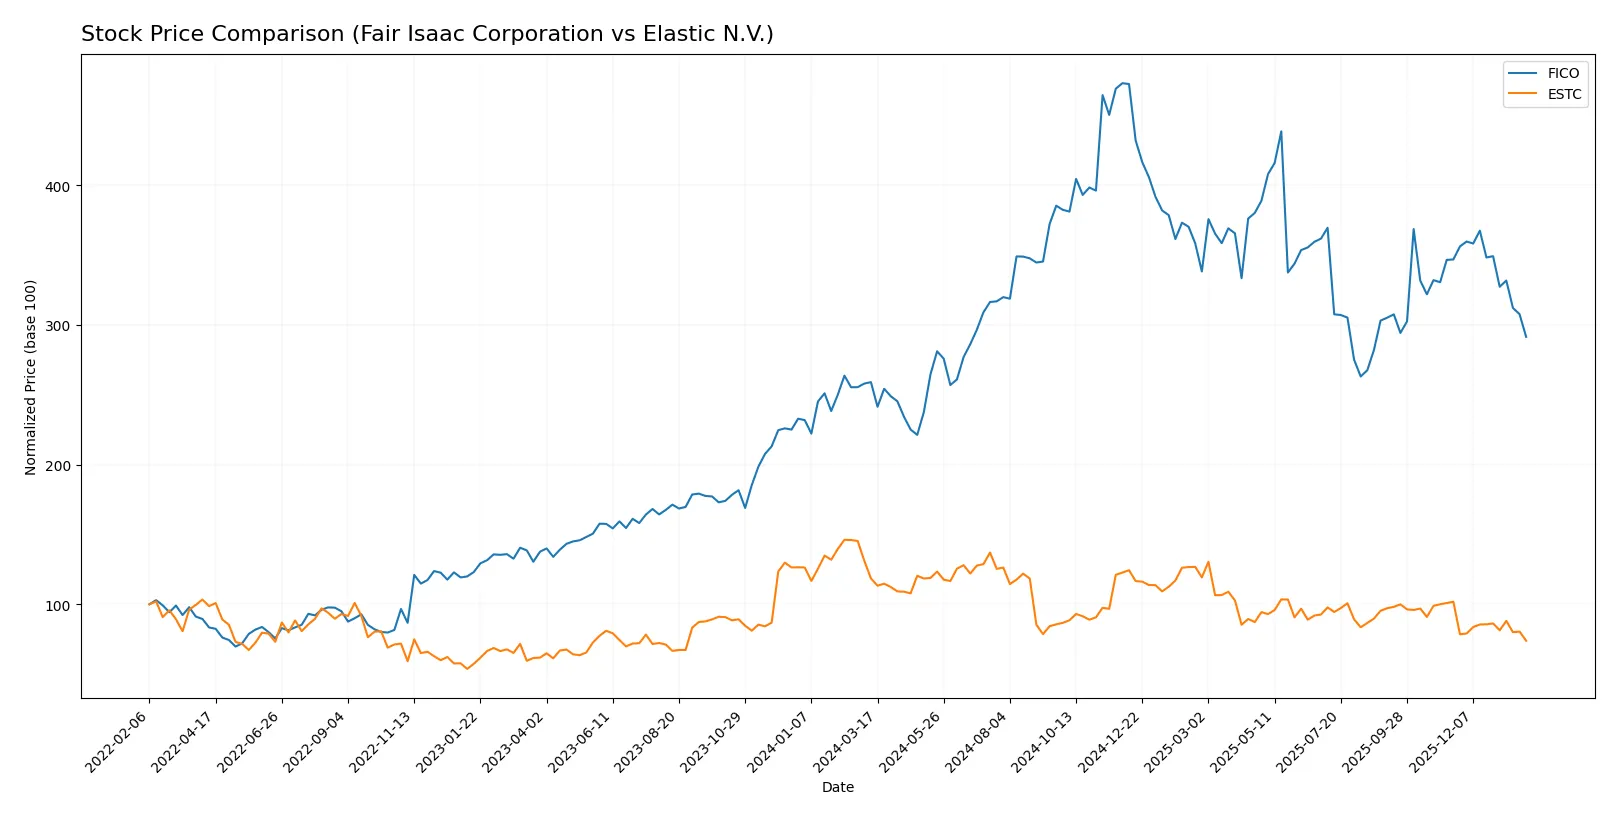
Trend Comparison
FICO’s stock shows a bullish trend over 12 months with a 12.51% rise, highest price at 2375.03, lowest at 1110.85, and decelerating upward momentum. Recent months reversed with a 15.98% drop.
ESTC’s stock faces a bearish trend with a 37.64% decline over 12 months, hitting a low of 65.93 and a high of 122.27. The downtrend decelerates but persists with a 27.41% fall recently.
FICO outperforms ESTC over the year, delivering positive returns versus ESTC’s significant losses, despite recent weakness in FICO’s price trend.
Target Prices
Analysts present a moderately bullish consensus for Fair Isaac Corporation and Elastic N.V.
| Company | Target Low | Target High | Consensus |
|---|---|---|---|
| Fair Isaac Corporation | 1,640 | 2,400 | 2,115 |
| Elastic N.V. | 76 | 134 | 108 |
Fair Isaac’s target consensus sits 45% above its current price of 1,463, signaling significant upside potential. Elastic’s consensus target at 108 implies a 64% premium to its current 65.93 price, reflecting optimistic growth expectations.

Don’t Let Luck Decide Your Entry Point
Optimize your entry points with our advanced ProRealTime indicators. You’ll get efficient buy signals with precise price targets for maximum performance. Start outperforming now!
How do institutions grade them?
Fair Isaac Corporation Grades
The following table summarizes recent institutional grades for Fair Isaac Corporation.
| Grading Company | Action | New Grade | Date |
|---|---|---|---|
| Needham | Maintain | Buy | 2026-01-29 |
| Jefferies | Maintain | Buy | 2026-01-16 |
| Wells Fargo | Maintain | Overweight | 2026-01-14 |
| JP Morgan | Maintain | Neutral | 2025-11-06 |
| Baird | Maintain | Outperform | 2025-11-06 |
| Jefferies | Maintain | Buy | 2025-11-06 |
| BMO Capital | Maintain | Outperform | 2025-11-06 |
| Wells Fargo | Maintain | Overweight | 2025-10-14 |
| Barclays | Maintain | Overweight | 2025-10-02 |
| Needham | Maintain | Buy | 2025-10-02 |
Elastic N.V. Grades
Below is a summary of recent institutional grades for Elastic N.V.
| Grading Company | Action | New Grade | Date |
|---|---|---|---|
| Rosenblatt | Maintain | Buy | 2026-01-30 |
| Barclays | Maintain | Overweight | 2026-01-12 |
| Jefferies | Maintain | Buy | 2026-01-05 |
| RBC Capital | Maintain | Outperform | 2026-01-05 |
| Citigroup | Maintain | Buy | 2025-11-24 |
| Jefferies | Maintain | Buy | 2025-11-21 |
| B of A Securities | Maintain | Neutral | 2025-11-21 |
| Rosenblatt | Maintain | Buy | 2025-11-21 |
| Cantor Fitzgerald | Maintain | Neutral | 2025-11-21 |
| Guggenheim | Maintain | Buy | 2025-11-21 |
Which company has the best grades?
Both companies receive predominantly buy or outperform ratings. Fair Isaac Corporation has multiple consistent “Buy” and “Outperform” grades, while Elastic N.V. shows a mix including “Buy,” “Outperform,” and some “Neutral” ratings. Investors may interpret the stronger consensus buy signals for Fair Isaac as a slightly more favorable institutional outlook.
Risks specific to each company
The following categories identify critical pressure points and systemic threats facing Fair Isaac Corporation and Elastic N.V. in the 2026 market environment:
1. Market & Competition
Fair Isaac Corporation
- Strong market presence with mature scoring and software solutions, but faces pressure from emerging AI competitors.
Elastic N.V.
- Innovative in cloud search but competes with larger cloud and analytics providers, risking market share erosion.
2. Capital Structure & Debt
Fair Isaac Corporation
- High debt-to-assets ratio at 165% signals potential balance sheet risk despite good interest coverage.
Elastic N.V.
- Moderate debt levels with 23% debt-to-assets; interest coverage negative, raising concerns on debt servicing capacity.
3. Stock Volatility
Fair Isaac Corporation
- Beta of 1.29 indicates higher sensitivity to market swings, increasing investor risk.
Elastic N.V.
- Lower beta at 0.93 suggests more stable stock price, reducing volatility risk.
4. Regulatory & Legal
Fair Isaac Corporation
- Operates globally with exposure to data privacy regulations that could increase compliance costs.
Elastic N.V.
- Faces evolving cloud and data security regulations that may impact product deployment and costs.
5. Supply Chain & Operations
Fair Isaac Corporation
- Primarily software-based, thus lower supply chain risk but reliant on skilled labor and data integrity.
Elastic N.V.
- Heavy reliance on cloud infrastructure exposes it to third-party service disruptions and operational risks.
6. ESG & Climate Transition
Fair Isaac Corporation
- Limited direct environmental impact but increasing pressure to disclose ESG practices and governance.
Elastic N.V.
- Faces rising expectations on sustainable cloud operations and corporate social responsibility reporting.
7. Geopolitical Exposure
Fair Isaac Corporation
- Global operations expose it to geopolitical tensions affecting data transfer and cross-border business.
Elastic N.V.
- Cloud-based solutions face risks from geopolitical restrictions on data residency and international trade policies.
Which company shows a better risk-adjusted profile?
Fair Isaac Corporation’s most impactful risk is its stretched capital structure with a debt-to-assets ratio exceeding 160%, signaling balance sheet vulnerability despite strong operating metrics. Elastic N.V. struggles primarily with negative interest coverage, threatening its ability to service debt amid growth investments. I see Fair Isaac’s risk-adjusted profile as better. Its Altman Z-Score of 12.2 confirms strong financial stability, while Elastic’s lower score of 3.4 and average Piotroski score highlight caution. The recent spike in Fair Isaac’s debt ratio justifies my concern about leverage risk in a rising rate environment.
Final Verdict: Which stock to choose?
Fair Isaac Corporation (FICO) stands out as a cash-generating powerhouse with a durable competitive edge, demonstrated by its strong ROIC well above WACC. Its main point of vigilance is a current ratio below 1, signaling liquidity concerns in tight markets. It fits well in aggressive growth portfolios seeking robust profitability and operational efficiency.
Elastic N.V. (ESTC) offers a strategic moat through its cloud-based software platform and recurring revenue model. Compared to FICO, it presents a more conservative balance sheet with a higher current ratio and lower leverage, appealing to investors prioritizing financial stability. It aligns with GARP portfolios balancing growth potential and risk management.
If you prioritize resilient profitability and value creation, FICO is the compelling choice due to its very favorable moat and cash flow profile. However, if you seek steadier financial footing with exposure to cloud innovation, ESTC offers better stability despite its current profitability challenges. Both present distinct analytical scenarios tailored to different investor risk appetites and strategic goals.
Disclaimer: Investment carries a risk of loss of initial capital. The past performance is not a reliable indicator of future results. Be sure to understand risks before making an investment decision.
Go Further
I encourage you to read the complete analyses of Fair Isaac Corporation and Elastic N.V. to enhance your investment decisions: