Investors seeking growth in the software application sector often consider Elastic N.V. (ESTC) and Domo, Inc. (DOMO) for their innovative cloud-based solutions. Both companies deliver advanced data management and analytics platforms, targeting businesses aiming to leverage real-time insights. Despite their market overlap, they differ in scale and strategic focus. In this article, I will analyze their strengths and risks to help you decide which stock might best enrich your investment portfolio.
Table of contents
Companies Overview
I will begin the comparison between Elastic N.V. and Domo, Inc. by providing an overview of these two companies and their main differences.
Elastic N.V. Overview
Elastic N.V. is a software company specializing in search technology designed for multi-cloud environments. Its flagship Elastic Stack product includes Elasticsearch, Kibana, Beats, Elastic Agent, and Logstash, enabling data ingestion, search, analysis, and visualization across various data types. Founded in 2012 and based in Mountain View, California, Elastic serves industries requiring real-time data insights and operational intelligence.
Domo, Inc. Overview
Domo, Inc. operates a cloud-based business intelligence platform that connects organizational roles from executives to frontline employees with real-time data and insights. Its platform facilitates business management via smartphones and integrates people, data, and systems across regions including the U.S. and Japan. Founded in 2010 and headquartered in American Fork, Utah, Domo focuses on enhancing decision-making through accessible analytics.
Key similarities and differences
Both Elastic and Domo operate in the software application industry within the technology sector, providing cloud-based solutions focused on data management and analytics. Elastic emphasizes search and data ingestion infrastructure with a diverse software stack, while Domo prioritizes business intelligence and user-friendly data accessibility. Elastic commands a significantly larger market capitalization and workforce compared to Domo, reflecting differing scales and market penetration strategies.
Income Statement Comparison
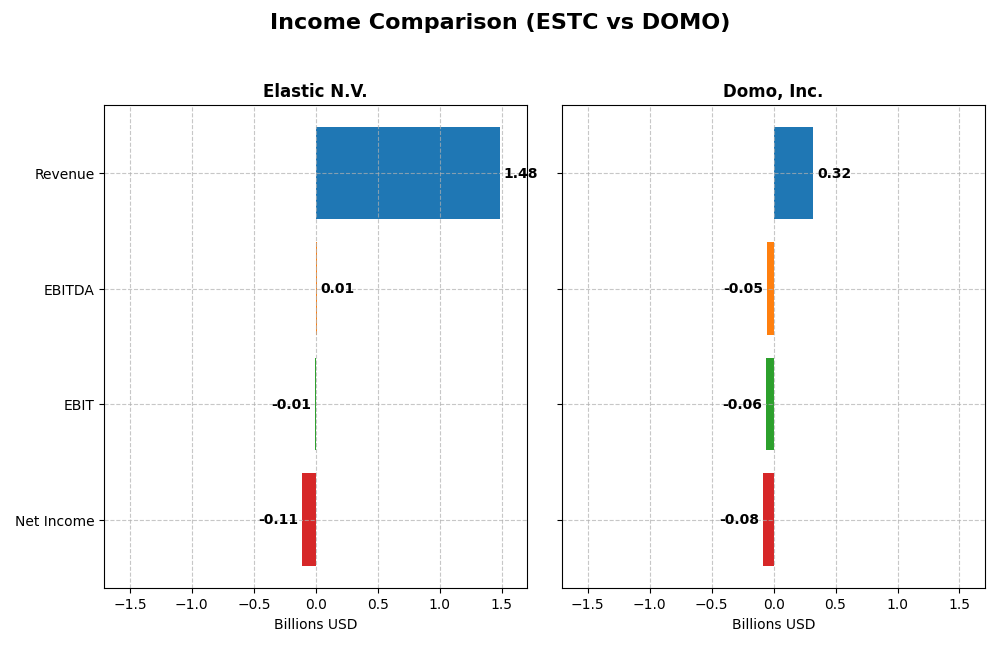
The table below compares key income statement metrics for Elastic N.V. and Domo, Inc. based on their most recent fiscal year results.
| Metric | Elastic N.V. (ESTC) | Domo, Inc. (DOMO) |
|---|---|---|
| Market Cap | 7.6B | 334M |
| Revenue | 1.48B | 317M |
| EBITDA | 6.1M | -50M |
| EBIT | -6.3M | -59M |
| Net Income | -108M | -82M |
| EPS | -1.04 | -2.13 |
| Fiscal Year | 2025 | 2025 |
Income Statement Interpretations
Elastic N.V.
Elastic N.V. has shown strong revenue growth from 2021 to 2025, rising from $608M to $1.48B, with a 17% increase in the most recent year. Gross margin remained favorable at 74.39%, while net income fluctuated, ending with a loss of $108M in 2025. Despite negative net margins, the company improved its EBIT margin and operating expenses aligned with revenue growth.
Domo, Inc.
Domo’s revenue increased from $210M in 2021 to $317M in 2025 but slightly declined by 0.61% recently. Its gross margin held steady around 74.45%, but EBIT and net margins remained deeply negative, with a net loss of $82M in 2025. The company’s profitability deteriorated last year, reflecting challenges in controlling costs amid flat revenue growth.
Which one has the stronger fundamentals?
Elastic demonstrates stronger fundamentals with higher revenue growth (144% over five years), improving EBIT margin, and favorable gross margin trends despite recent net losses. Domo’s revenue growth is more modest (51%), with persistent negative EBIT and net margins and weaker recent performance. Elastic’s income statement shows a more favorable overall trajectory compared to Domo’s unfavorable evaluation.
Financial Ratios Comparison
The table below presents a side-by-side comparison of key financial ratios for Elastic N.V. (ESTC) and Domo, Inc. (DOMO) based on their most recent fiscal year data.
| Ratios | Elastic N.V. (ESTC) FY 2025 | Domo, Inc. (DOMO) FY 2025 |
|---|---|---|
| ROE | -11.7% | 46.2% |
| ROIC | -11.8% | 198.0% |
| P/E | -82.7 | -4.0 |
| P/B | 9.64 | -1.84 |
| Current Ratio | 1.92 | 0.56 |
| Quick Ratio | 1.92 | 0.56 |
| D/E (Debt-to-Equity) | 0.64 | -0.76 |
| Debt-to-Assets | 23% | 63% |
| Interest Coverage | -2.17 | -2.99 |
| Asset Turnover | 0.57 | 1.48 |
| Fixed Asset Turnover | 51.3 | 8.17 |
| Payout ratio | 0 | 0 |
| Dividend yield | 0 | 0 |
Interpretation of the Ratios
Elastic N.V.
Elastic N.V. shows a mixed ratio profile with favorable liquidity and asset turnover ratios but unfavorable profitability metrics such as negative net margin (-7.29%) and return on equity (-11.66%). Its debt-to-assets ratio is low at 22.95%, indicating moderate leverage. The company does not pay dividends, likely due to negative earnings and a reinvestment focus in R&D, consistent with its high research and development to revenue ratio.
Domo, Inc.
Domo exhibits a contrasting ratio set, with strong returns on equity (46.23%) and invested capital (197.65%), but weak liquidity shown by a low current ratio of 0.56 and high debt-to-assets at 63.23%. Profitability remains negative with a net margin of -25.84%. The company does not distribute dividends, possibly prioritizing growth and innovation, as implied by its high R&D spending and negative free cash flow.
Which one has the best ratios?
Both companies present challenges: Elastic N.V. has better liquidity and lower leverage but weaker profitability, while Domo boasts strong returns on equity and capital despite poor liquidity and heavy debt. Each firm’s ratio profile reflects different operational and financial strategies, resulting in a neutral overall evaluation for both.
Strategic Positioning
This section compares the strategic positioning of Elastic N.V. and Domo, Inc. across Market position, Key segments, and Exposure to technological disruption:
Elastic N.V.
- Larger market cap of 7.6B USD, with NYSE listing and moderate beta 0.97, facing typical software competition.
- Focused on Elastic Stack software products, primarily subscription-based with significant professional services revenue.
- Operates in multi-cloud environments with software solutions supporting search, analytics, and monitoring, exposed to cloud tech changes.
Domo, Inc.
- Smaller market cap of 334M USD, NASDAQ-listed, with higher beta 1.77 indicating greater volatility and competition.
- Cloud-based business intelligence platform, subscription-focused with professional services and smaller employee base.
- Digital platform connecting organizational data in real-time, dependent on cloud and mobile technology adaptation.
Elastic N.V. vs Domo, Inc. Positioning
Elastic has a diversified product portfolio centered on data ingestion and analytics, generating higher revenue and employing more staff. Domo concentrates on a cloud BI platform with a smaller scale and workforce. Elastic’s broader offerings contrast with Domo’s specialized focus.
Which has the best competitive advantage?
Domo shows a very favorable moat with ROIC significantly exceeding WACC and a strong upward trend, indicating durable competitive advantage. Elastic, despite growing ROIC, currently destroys value relative to its cost of capital, reflecting a slightly unfavorable moat position.
Stock Comparison
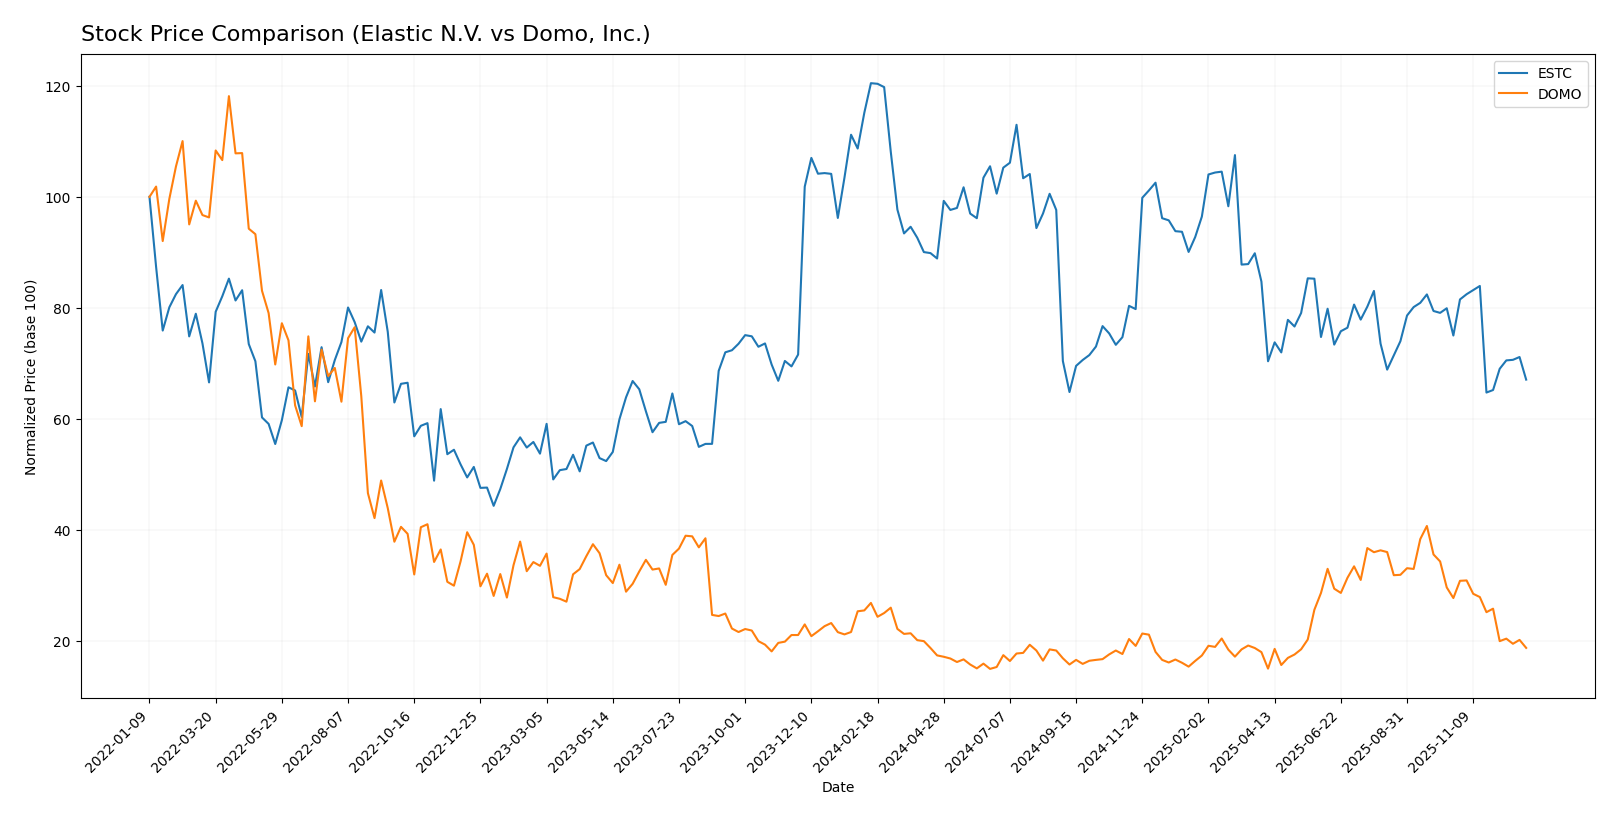
The stock price movements of Elastic N.V. and Domo, Inc. over the past year reveal significant bearish trends with notable price declines, contrasting volume dynamics, and decelerating momentum.
Trend Analysis
Elastic N.V. (ESTC) experienced a bearish trend with a -44.35% price change over the past 12 months, showing deceleration and high volatility (std deviation 14.77), with prices ranging from 130.39 to 70.04.
Domo, Inc. (DOMO) also followed a bearish trend with a -30.25% price decline over the same period, decelerating with lower volatility (std deviation 2.99) and price fluctuations between 18.06 and 6.62.
Comparatively, ESTC’s stock delivered the larger negative market performance, declining more sharply than DOMO in the analyzed timeframe.
Target Prices
The current analyst consensus presents a balanced outlook for Elastic N.V. and Domo, Inc.
| Company | Target High | Target Low | Consensus |
|---|---|---|---|
| Elastic N.V. | 134 | 76 | 108 |
| Domo, Inc. | 13 | 10 | 11.5 |
Analysts expect Elastic N.V. to trade significantly above its current price of $72.56, indicating upside potential. Domo, Inc.’s target consensus at $11.5 also suggests moderate appreciation from its current $8.30 price.
Analyst Opinions Comparison
This section compares analysts’ ratings and financial scores for Elastic N.V. and Domo, Inc.:
Rating Comparison
ESTC Rating
- Rating: C- with a very favorable status
- Discounted Cash Flow Score: 3, moderate valuation
- ROE Score: 1, very unfavorable efficiency
- ROA Score: 1, very unfavorable asset utilization
- Debt To Equity Score: 1, very unfavorable risk
- Overall Score: 1, very unfavorable summary
DOMO Rating
- Rating: C with a very favorable status
- Discounted Cash Flow Score: 1, very unfavorable
- ROE Score: 5, very favorable efficiency
- ROA Score: 1, very unfavorable asset utilization
- Debt To Equity Score: 1, very unfavorable risk
- Overall Score: 2, moderate summary
Which one is the best rated?
Based on the provided data, Domo holds a higher overall score (2 vs. 1) and a superior ROE score, while Elastic has a better discounted cash flow score. Domo is generally better rated overall.
Scores Comparison
The scores comparison between Elastic N.V. and Domo, Inc. highlights their financial stability and strength:
Elastic N.V. Scores
- Altman Z-Score: 3.23, indicates safe zone status.
- Piotroski Score: 4, showing average financial health.
Domo, Inc. Scores
- Altman Z-Score: -10.04, indicates distress zone status.
- Piotroski Score: 3, showing very weak financial health.
Which company has the best scores?
Based on the provided data, Elastic N.V. has better scores with a safe zone Altman Z-Score and average Piotroski Score, while Domo, Inc. is in distress zone with very weak Piotroski Score.
Grades Comparison
Here is a comparison of recent grades assigned to Elastic N.V. and Domo, Inc.:
Elastic N.V. Grades
The following table summarizes the latest grades from recognized grading companies for Elastic N.V.:
| Grading Company | Action | New Grade | Date |
|---|---|---|---|
| Citigroup | Maintain | Buy | 2025-11-24 |
| Cantor Fitzgerald | Maintain | Neutral | 2025-11-21 |
| Stifel | Maintain | Buy | 2025-11-21 |
| B of A Securities | Maintain | Neutral | 2025-11-21 |
| DA Davidson | Maintain | Neutral | 2025-11-21 |
| Scotiabank | Maintain | Sector Perform | 2025-11-21 |
| Piper Sandler | Maintain | Overweight | 2025-11-21 |
| Jefferies | Maintain | Buy | 2025-11-21 |
| Wedbush | Maintain | Outperform | 2025-11-21 |
| Guggenheim | Maintain | Buy | 2025-11-21 |
Elastic N.V.’s grades generally reflect a positive outlook, with multiple firms maintaining Buy or equivalent ratings.
Domo, Inc. Grades
The following table shows recent grades assigned to Domo, Inc. by established grading companies:
| Grading Company | Action | New Grade | Date |
|---|---|---|---|
| DA Davidson | Maintain | Neutral | 2025-12-05 |
| TD Cowen | Maintain | Buy | 2025-12-05 |
| Lake Street | Maintain | Hold | 2025-12-05 |
| DA Davidson | Maintain | Neutral | 2025-12-01 |
| JMP Securities | Maintain | Market Outperform | 2025-09-10 |
| DA Davidson | Maintain | Neutral | 2025-08-28 |
| Cantor Fitzgerald | Maintain | Overweight | 2025-08-28 |
| TD Cowen | Upgrade | Buy | 2025-08-26 |
| JMP Securities | Maintain | Market Outperform | 2025-06-25 |
| Cantor Fitzgerald | Maintain | Overweight | 2025-06-25 |
Domo, Inc.’s grades show a mix of Neutral to Outperform ratings, with some recent upgrades to Buy from TD Cowen.
Which company has the best grades?
Elastic N.V. has received a higher number of Buy and Outperform ratings compared to Domo, Inc., whose grades are more mixed with several Neutral and Hold ratings. This may suggest a relatively stronger analyst confidence in Elastic N.V.’s prospects, potentially impacting investor sentiment toward these stocks differently.
Strengths and Weaknesses
Below is a comparison of key strengths and weaknesses for Elastic N.V. (ESTC) and Domo, Inc. (DOMO) based on their latest financial and operational data.
| Criterion | Elastic N.V. (ESTC) | Domo, Inc. (DOMO) |
|---|---|---|
| Diversification | High subscription revenue growth; stable professional services segment | Moderate subscription growth; smaller professional services segment |
| Profitability | Negative net margin (-7.29%) and ROIC (-11.8%), but improving ROIC trend | Strong ROE (46.23%) and ROIC (197.65%); negative net margin (-25.84%) |
| Innovation | Growing ROIC trend suggests improving efficiency and innovation | Very favorable ROIC trend showing durable competitive advantage |
| Global presence | Solid subscription base with increasing revenues | Growing subscription revenues, but lower current ratio implies liquidity challenges |
| Market Share | Large subscription revenue ($1.38B in 2025) indicates strong market position | Smaller subscription revenue ($286M in 2025) but efficient asset use |
Key takeaways: Elastic shows stable growth and improving profitability despite current value destruction, supported by strong subscription revenue. Domo demonstrates a durable competitive advantage with excellent returns on capital but faces profitability and liquidity headwinds. Both companies warrant cautious consideration with attention to their different risk profiles.
Risk Analysis
Below is a comparison of key risks for Elastic N.V. (ESTC) and Domo, Inc. (DOMO) based on the most recent data from 2025:
| Metric | Elastic N.V. (ESTC) | Domo, Inc. (DOMO) |
|---|---|---|
| Market Risk | Moderate (Beta 0.97) | High (Beta 1.77) |
| Debt level | Moderate (Debt/Equity 0.64) | High (Debt/Equity -0.76 but unfavorable debt-to-assets 63%) |
| Regulatory Risk | Moderate (US tech sector) | Moderate (US tech sector) |
| Operational Risk | Moderate (3.4K employees) | Elevated (888 employees, smaller scale) |
| Environmental Risk | Low (software industry) | Low (software industry) |
| Geopolitical Risk | Moderate (US-based, global clients) | Moderate (US-based, global clients) |
The most impactful risks are Domo’s high financial leverage and poor liquidity, reflected in a distress Altman Z-Score and weak Piotroski score, signaling elevated bankruptcy risk. Elastic shows better financial stability but faces operational and market risks amid profitability challenges. Investors should prioritize risk management given Domo’s distress signals and Elastic’s mixed financial health.
Which Stock to Choose?
Elastic N.V. (ESTC) shows a favorable income evolution with 17% revenue growth in 2025 and a positive long-term trend. Despite negative profitability ratios (ROE -11.66%, ROIC -11.8%), its debt levels are moderate and some liquidity ratios are favorable. The overall rating is very favorable but with mixed financial ratios.
Domo, Inc. (DOMO) displays a less favorable income trend, with a slight revenue decline in 2025 and a negative net margin of -25.84%. However, it has strong ROE (46.23%) and ROIC (197.65%), indicating efficient capital use. Debt and liquidity ratios are weak, and the overall rating is very favorable but with a neutral ratios evaluation.
For investors, ESTC’s favorable income growth and liquidity might appeal to those prioritizing stability and incremental profitability, while DOMO’s strong return on invested capital and equity might attract growth-oriented investors willing to accept higher financial risk. Each stock’s profile could be seen as suitable depending on tolerance for volatility and investment strategy.
Disclaimer: Investment carries a risk of loss of initial capital. The past performance is not a reliable indicator of future results. Be sure to understand risks before making an investment decision.
Go Further
I encourage you to read the complete analyses of Elastic N.V. and Domo, Inc. to enhance your investment decisions: