Home > Comparison > Healthcare > SYK vs EW
The strategic rivalry between Stryker Corporation and Edwards Lifesciences shapes the medical devices sector’s evolution. Stryker operates as a diversified medical technology powerhouse with broad orthopaedics and neurotechnology segments. Edwards Lifesciences focuses on specialized, high-tech structural heart and critical care solutions. This analysis explores their contrasting operational models and competitive positioning to identify which company offers superior risk-adjusted returns for a balanced, growth-oriented healthcare portfolio.
Table of contents
Companies Overview
Stryker Corporation and Edwards Lifesciences dominate distinct niches in the medical devices sector, shaping healthcare innovation globally.
Stryker Corporation: Diversified Medical Technology Leader
Stryker excels as a medical technology powerhouse, generating revenue through two segments: Orthopaedics and Spine, and MedSurg and Neurotechnology. It sells implants, surgical equipment, and neurotechnology products globally. In 2026, Stryker emphasizes expanding its product portfolio across surgical navigation and minimally invasive therapies to capitalize on aging populations and surgical demand.
Edwards Lifesciences Corporation: Structural Heart Device Specialist
Edwards Lifesciences focuses on structural heart disease solutions, primarily transcatheter heart valve replacements and repairs. It also offers critical care monitoring systems. In 2026, Edwards prioritizes innovation in minimally invasive valve therapies and advanced hemodynamic monitoring software to enhance patient outcomes and broaden adoption worldwide.
Strategic Collision: Similarities & Divergences
Both companies lead in medical device innovation but diverge in focus: Stryker pursues a broad surgical device ecosystem, while Edwards targets a specialized heart valve niche. Their primary battleground is advancing minimally invasive procedures. Investors face distinct profiles: Stryker offers diversification and scale, Edwards delivers deep specialization and innovation in cardiovascular care.
Income Statement Comparison
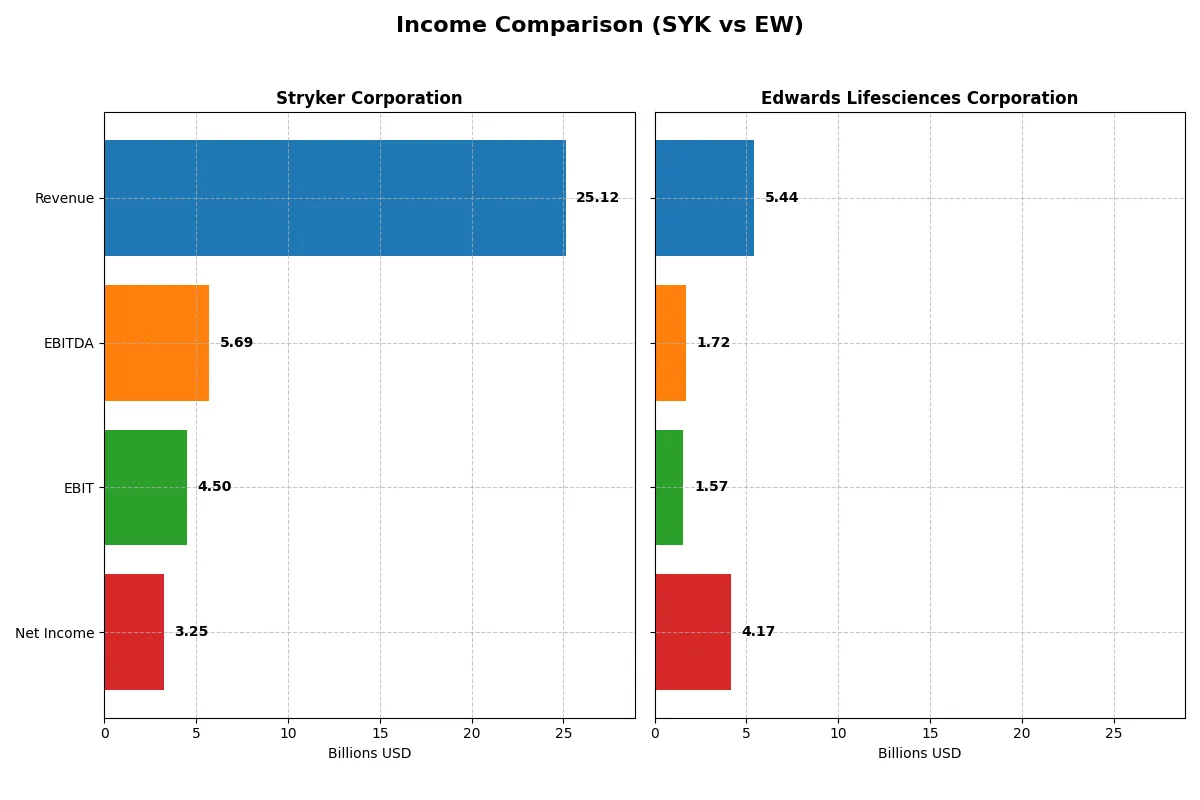
This data dissects the core profitability and scalability of both corporate engines to reveal who dominates the bottom line:
| Metric | Stryker Corporation (SYK) | Edwards Lifesciences Corporation (EW) |
|---|---|---|
| Revenue | 25.1B | 5.4B |
| Cost of Revenue | 9.7B | 1.1B |
| Operating Expenses | 9.8B | 2.9B |
| Gross Profit | 15.4B | 4.3B |
| EBITDA | 5.7B | 1.7B |
| EBIT | 4.5B | 1.6B |
| Interest Expense | 0 | 20M |
| Net Income | 3.2B | 4.2B |
| EPS | 8.49 | 6.98 |
| Fiscal Year | 2025 | 2024 |
Income Statement Analysis: The Bottom-Line Duel
This income statement comparison reveals which company converts revenue into profit most efficiently, exposing the true strength of their business models.
Stryker Corporation Analysis
Stryker’s revenue rose steadily from 17.1B in 2021 to 25.1B in 2025, with net income climbing from 2B to 3.2B. Gross margin holds firm at 61.4%, while net margin remains solid near 13%. In 2025, operational efficiency improved, evidenced by a 15.7% EBIT growth and robust EBITDA of 5.7B, though net margin slightly dipped.
Edwards Lifesciences Corporation Analysis
Edwards Lifesciences’ revenue grew moderately from 4.4B in 2020 to 5.4B in 2024, but net income surged from 823M to 4.2B, largely due to discontinued operations in 2024. Gross margin impresses at 79.5%, with an exceptional net margin of 76.8%. The 2024 year showed strong momentum, with net income more than doubling and EPS rising 203%.
Margin Power vs. Revenue Scale
Stryker dominates in scale and steady revenue growth, with consistent margins and operational improvements. Edwards excels in margin power and explosive net income growth, propelled by one-off gains. For investors, Stryker offers a stable, growing profit engine, while Edwards presents a high-margin profile with episodic earnings spikes that require cautious scrutiny.
Financial Ratios Comparison
These vital ratios act as a diagnostic tool to expose the underlying fiscal health, valuation premiums, and capital efficiency of the companies compared below:
| Ratios | Stryker Corporation (SYK) | Edwards Lifesciences Corporation (EW) |
|---|---|---|
| ROE | 14.48% | 41.75% |
| ROIC | 7.37% | 10.74% |
| P/E | 41.38 | 10.60 |
| P/B | 5.99 | 4.43 |
| Current Ratio | 1.89 | 4.18 |
| Quick Ratio | 1.21 | 3.45 |
| D/E | 0.66 | 0.07 |
| Debt-to-Assets | 31.06% | 5.36% |
| Interest Coverage | 0 | 69.63 |
| Asset Turnover | 0.52 | 0.42 |
| Fixed Asset Turnover | 6.48 | 3.05 |
| Payout ratio | 39.56% | 0% |
| Dividend yield | 0.96% | 0% |
| Fiscal Year | 2025 | 2024 |
Efficiency & Valuation Duel: The Vital Signs
Financial ratios act as the company’s DNA, uncovering hidden risks and revealing operational excellence vital for informed investment decisions.
Stryker Corporation
Stryker shows solid profitability with a 14.48% ROE and a healthy 12.92% net margin, reflecting operational efficiency. However, its high valuation stands out with a P/E of 41.38 and P/B of 5.99, marking the stock as stretched. Shareholders receive modest dividends (0.96%), while the company reinvests heavily in R&D for growth.
Edwards Lifesciences Corporation
Edwards posts an impressive 41.75% ROE and exceptional 76.75% net margin, indicating robust profitability. Its valuation is attractive with a P/E of 10.6 but a less favorable P/B of 4.43, presenting a mixed picture. The firm pays no dividends, favoring reinvestment in R&D to fuel its high-margin growth strategy.
Premium Valuation vs. Operational Safety
Edwards offers superior profitability and a more reasonable P/E, though with a slightly higher risk profile due to no dividend and high margin dependency. Stryker balances steady returns with a stretched valuation but provides income through dividends. Investors seeking growth may prefer Edwards; those valuing income and stability might lean toward Stryker.
Which one offers the Superior Shareholder Reward?
I compare Stryker Corporation (SYK) and Edwards Lifesciences Corporation (EW) on dividends, payout ratios, and buybacks. SYK pays a 0.96% dividend yield with a 40% payout, supported by strong free cash flow coverage (85%). It also executes consistent buybacks, enhancing shareholder value. EW pays no dividend but reinvests heavily in R&D and growth, with free cash flow reinvestment at 53%. Its buyback activity is limited, focusing instead on balance sheet strength with a 6.5% debt-to-capital ratio. Historically, SYK’s balanced distribution with dividends and buybacks offers a more sustainable and attractive total return profile for 2026 investors.
Comparative Score Analysis: The Strategic Profile
The radar chart reveals the fundamental DNA and trade-offs of Stryker Corporation and Edwards Lifesciences Corporation, highlighting their financial strengths and vulnerabilities:
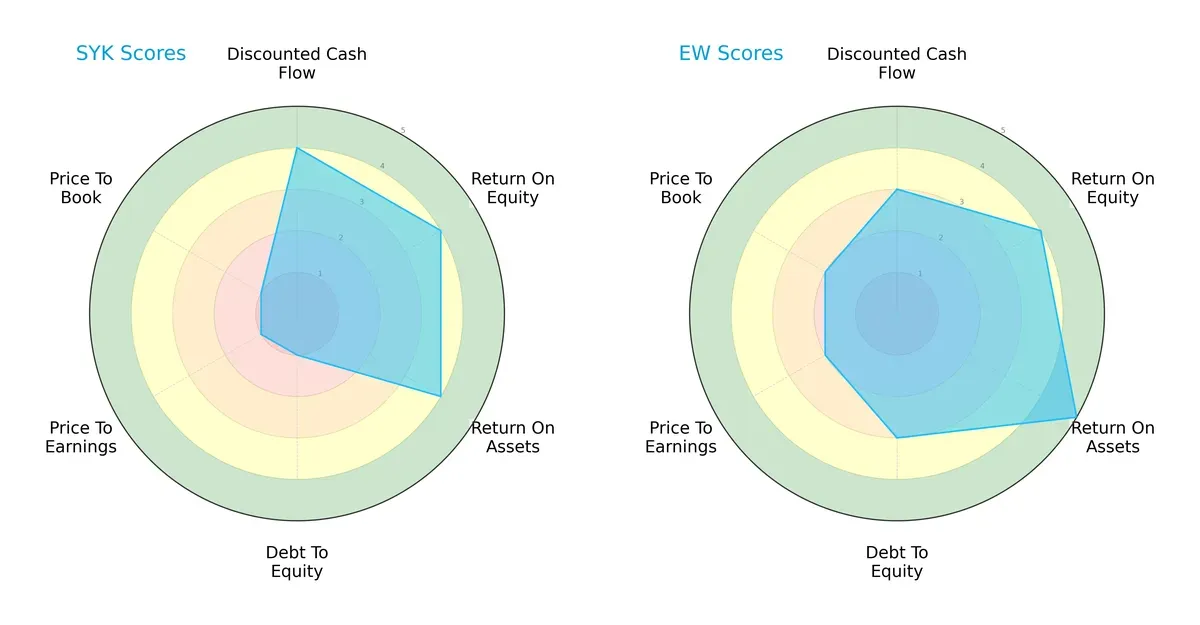
Stryker excels in discounted cash flow, ROE, and ROA, showing operational efficiency but suffers from weak debt and valuation scores. Edwards offers a more balanced profile with moderate DCF and debt metrics and superior asset returns, indicating steadier financial stability and valuation discipline. Edwards leans on asset efficiency, while Stryker relies heavily on cash flow and profitability metrics.
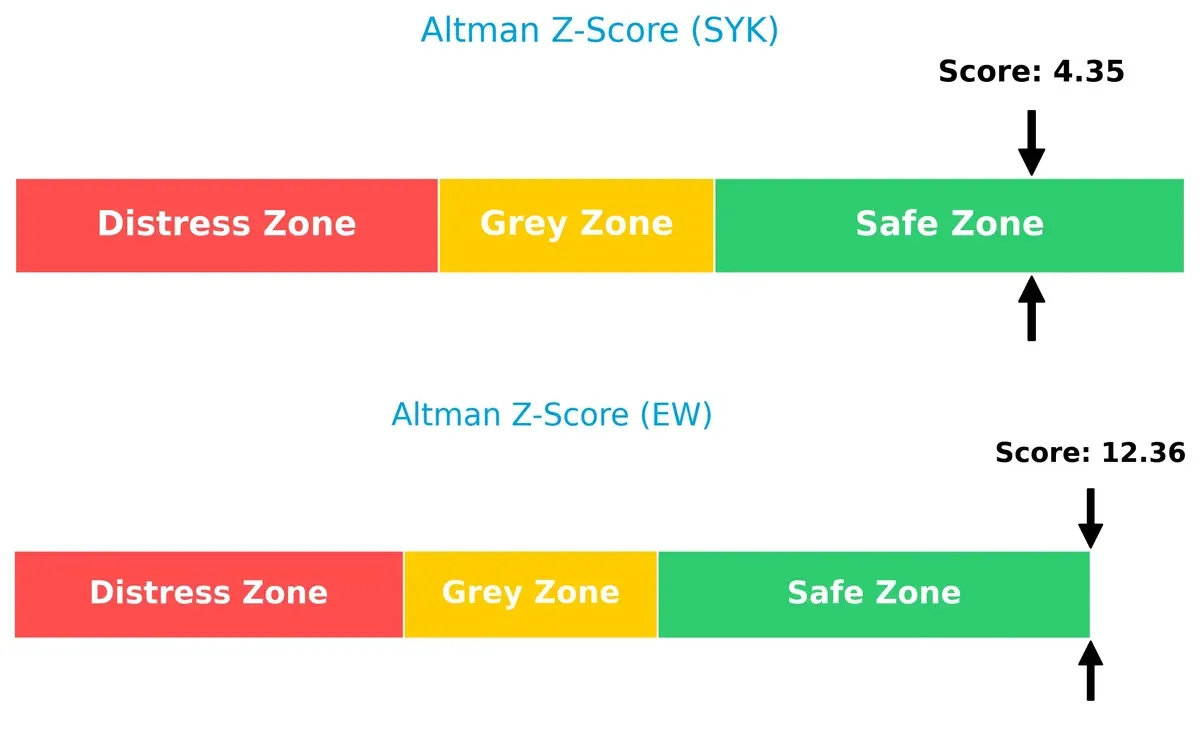
Bankruptcy Risk: Solvency Showdown
Edwards Lifesciences posts a higher Altman Z-Score (12.36) versus Stryker’s 4.35, both safely above distress levels, but Edwards signals a stronger cushion against bankruptcy in this economic cycle:
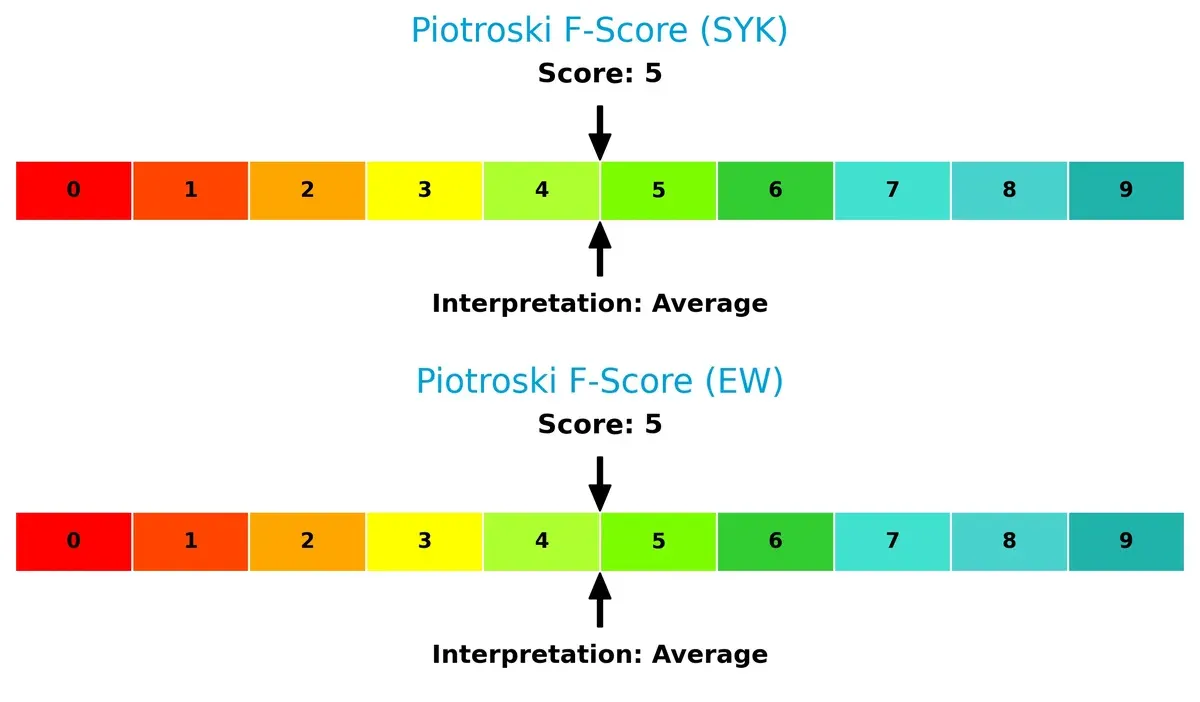
Financial Health: Quality of Operations
Both companies score a moderate Piotroski F-Score of 5, reflecting average financial health without glaring red flags in operational quality or earnings persistence:
How are the two companies positioned?
This section dissects SYK and EW’s operational DNA by comparing revenue distribution and internal dynamics—strengths and weaknesses. The goal is to confront their economic moats and identify the most resilient, sustainable competitive advantage today.
Revenue Segmentation: The Strategic Mix
This comparison dissects how Stryker Corporation and Edwards Lifesciences diversify income streams and where their primary sector bets lie:
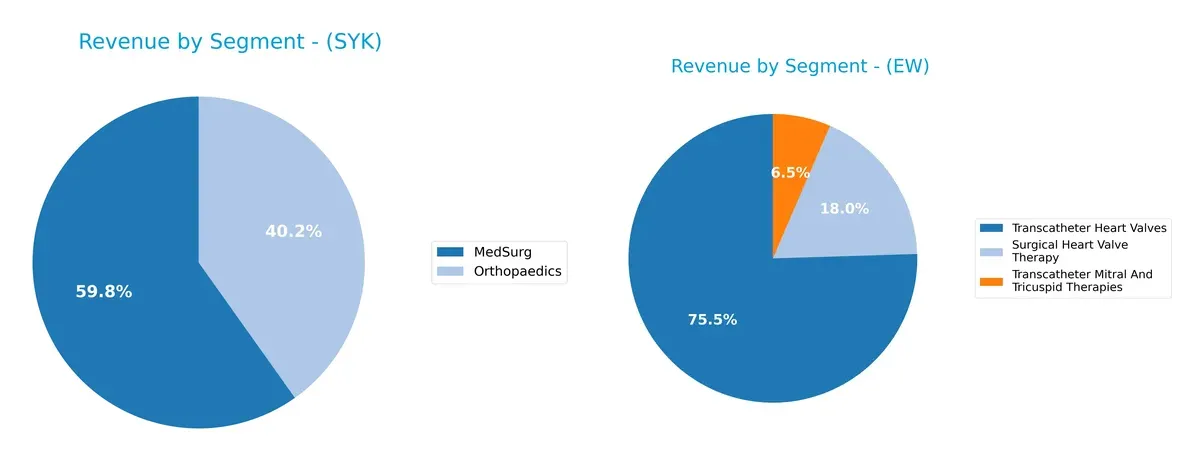
Stryker anchors revenue in MedSurg at $13.5B and Orthopaedics at $9.1B, showing a balanced dual-segment dominance. Edwards Lifesciences pivots heavily on Transcatheter Heart Valves, generating $4.1B, overshadowing its Surgical Heart Valve Therapy at $981M. Stryker’s diversified mix reduces concentration risk, while Edwards’ reliance on a single segment signals strong infrastructure dominance but elevates exposure to market shifts in valve therapy.
Strengths and Weaknesses Comparison
This table compares the Strengths and Weaknesses of Stryker Corporation and Edwards Lifesciences Corporation:
Stryker Corporation Strengths
- Broad product diversification across MedSurg and Orthopaedics segments
- Strong and growing US and international revenue base
- Favorable liquidity ratios with current and quick ratios above 1
- Solid interest coverage indicating ample earnings to cover debt
- Favorable fixed asset turnover showing efficient asset use
Edwards Lifesciences Corporation Strengths
- High profitability with exceptional net margin and ROE
- Low leverage with very favorable debt-to-assets and debt-equity ratios
- Favorable P/E ratio indicating market undervaluation
- Strong liquidity with very favorable quick ratio
- Leading fixed asset turnover in its sector despite lower asset turnover overall
Stryker Corporation Weaknesses
- High P/E and P/B ratios suggest overvaluation risk
- Dividend yield is low and unfavorable for income investors
- Neutral ROIC below WACC signals capital returns close to cost
- Moderate leverage levels may limit financial flexibility
- Asset turnover on par but not leading in efficiency
Edwards Lifesciences Corporation Weaknesses
- Unfavorable current ratio indicates potential short-term liquidity risk
- Moderate unfavorable P/B ratio could reflect market concerns
- Asset turnover underperforms relative to peers
- No dividend yield reduces appeal to income-focused investors
Both companies exhibit strong operational strengths but face distinct challenges. Stryker’s diversified product lines and solid liquidity contrast with valuation concerns. Edwards excels in profitability and low leverage but must address liquidity and asset utilization to sustain growth. These dynamics shape each firm’s strategic financial positioning.
The Moat Duel: Analyzing Competitive Defensibility
A structural moat protects long-term profits from relentless competition and market pressures. Here is how Stryker and Edwards Lifesciences defend their turf:
Stryker Corporation: Diverse Product Portfolio with Scale-Driven Cost Advantage
Stryker’s moat stems from broad product lines and scale, enabling cost advantages and margin stability. Yet, its declining ROIC signals eroding capital efficiency. Innovation in neurotechnology and surgical navigation could deepen its moat if executed well in 2026.
Edwards Lifesciences Corporation: Innovation-Driven Intangible Assets in Structural Heart
Edwards relies on cutting-edge transcatheter valve technology and strong brand reputation, producing high ROIC well above WACC. Despite a recent decline in ROIC trend, its dominant position in minimally invasive heart therapies sustains growth potential and market expansion.
Cost Leadership vs. Innovation Leadership: Which Moat Reigns?
Edwards shows a deeper moat with consistent value creation (ROIC > WACC +2%), while Stryker is losing value with negative spread and declining ROIC. Edwards is better positioned to defend market share through innovation-driven pricing power and product differentiation.
Which stock offers better returns?
The past year shows distinct price movements for Stryker Corporation and Edwards Lifesciences Corporation, with Stryker gaining modestly while Edwards declines amid shifting trading dynamics.
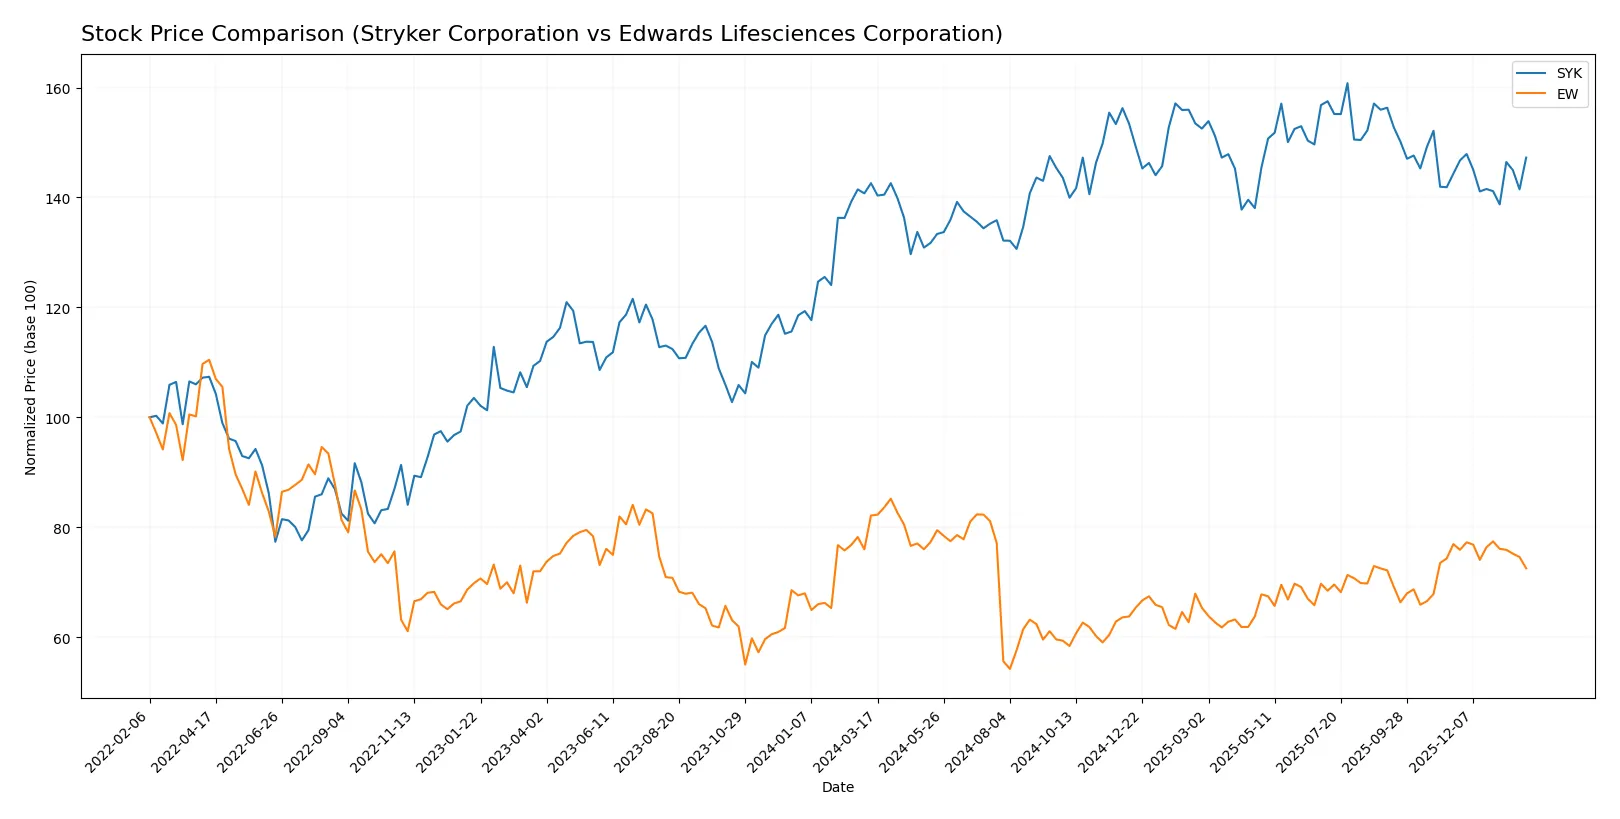
Trend Comparison
Stryker’s stock rose 3.27% over the past 12 months, signaling a bullish trend but with decelerating momentum. It reached a high of 403.53 and a low of 325.43, with a notable volatility of 19.0.
Edwards Lifesciences declined 11.7% over the same period, reflecting a bearish trend with deceleration. The stock fluctuated between 60.83 and 95.56 and showed lower volatility at 8.24.
Comparing both, Stryker outperformed Edwards, delivering the strongest market performance with positive returns, while Edwards experienced a significant downward trend.
Target Prices
Analysts project moderate upside for these medical device leaders based on current consensus targets.
| Company | Target Low | Target High | Consensus |
|---|---|---|---|
| Stryker Corporation | 390 | 465 | 421.64 |
| Edwards Lifesciences Corporation | 87 | 110 | 97.31 |
Stryker’s consensus target of 421.64 implies a 14% premium over its current 369.56 price, signaling confident growth expectations. Edwards Lifesciences’ 97.31 target suggests roughly 20% upside from its 81.36 market price, reflecting strong optimism in its niche.

Don’t Let Luck Decide Your Entry Point
Optimize your entry points with our advanced ProRealTime indicators. You’ll get efficient buy signals with precise price targets for maximum performance. Start outperforming now!
How do institutions grade them?
Stryker Corporation Grades
The following table summarizes recent grades by reputable institutions for Stryker Corporation.
| Grading Company | Action | New Grade | Date |
|---|---|---|---|
| Needham | Maintain | Buy | 2026-01-30 |
| BTIG | Maintain | Buy | 2026-01-30 |
| Bernstein | Maintain | Outperform | 2026-01-09 |
| Citizens | Upgrade | Market Outperform | 2025-12-19 |
| Truist Securities | Maintain | Hold | 2025-12-18 |
| Citigroup | Maintain | Buy | 2025-12-11 |
| Wells Fargo | Maintain | Overweight | 2025-11-14 |
Edwards Lifesciences Corporation Grades
Below are the recent grading updates from major firms for Edwards Lifesciences Corporation.
| Grading Company | Action | New Grade | Date |
|---|---|---|---|
| Stifel | Maintain | Buy | 2026-01-20 |
| Piper Sandler | Maintain | Overweight | 2026-01-20 |
| UBS | Maintain | Neutral | 2026-01-12 |
| Barclays | Maintain | Overweight | 2026-01-12 |
| TD Cowen | Upgrade | Buy | 2026-01-09 |
| JP Morgan | Upgrade | Overweight | 2025-12-18 |
| Citigroup | Maintain | Buy | 2025-12-11 |
Which company has the best grades?
Stryker consistently holds Buy and Outperform ratings, with one upgrade to Market Outperform. Edwards shows more varied ratings, including Neutral but recent upgrades to Buy and Overweight. Investors may view Stryker’s steadier high grades as a sign of more consistent analyst confidence.
Risks specific to each company
The following categories identify the critical pressure points and systemic threats facing both firms in the 2026 market environment:
1. Market & Competition
Stryker Corporation
- Larger market cap (141B) provides scale advantage but faces pricing pressure in MedSurg segment.
Edwards Lifesciences Corporation
- Smaller market cap (48B) but dominates structural heart niche with innovative transcatheter products.
2. Capital Structure & Debt
Stryker Corporation
- Moderate debt-to-equity of 0.66 signals balanced leverage but debt rating scores low.
Edwards Lifesciences Corporation
- Very low debt-to-equity of 0.07 reflects conservative capital structure and strong balance sheet.
3. Stock Volatility
Stryker Corporation
- Beta 0.90 indicates slightly lower volatility than market; stable but less growth upside.
Edwards Lifesciences Corporation
- Beta 0.96 suggests moderate market-correlated volatility with potential for higher returns.
4. Regulatory & Legal
Stryker Corporation
- Exposure to surgical device regulation risks globally; recalls could impact reputation.
Edwards Lifesciences Corporation
- High regulatory scrutiny in heart valve approvals; innovation cycle dependent on FDA clearances.
5. Supply Chain & Operations
Stryker Corporation
- Complex global supply chain in 75 countries; risks from geopolitical disruptions and costs.
Edwards Lifesciences Corporation
- More focused distribution; direct sales model reduces third-party supply chain risks.
6. ESG & Climate Transition
Stryker Corporation
- Increasing pressure to reduce emissions in manufacturing; ESG disclosures improving.
Edwards Lifesciences Corporation
- Faces ESG expectations tied to medical device sustainability and ethical sourcing.
7. Geopolitical Exposure
Stryker Corporation
- Broad international footprint exposes it to trade tensions, especially in Europe and Asia.
Edwards Lifesciences Corporation
- Concentrated in US and Europe markets; less diversified geopolitical risk but vulnerable to US policy shifts.
Which company shows a better risk-adjusted profile?
Edwards Lifesciences faces its greatest risk in regulatory and innovation dependency but has a stronger balance sheet and more favorable financial ratios. Stryker’s main risk lies in its debt profile and exposure to complex supply chains. Edwards’ lower leverage and higher profitability support a superior risk-adjusted stance in 2026.
Final Verdict: Which stock to choose?
Stryker Corporation’s superpower lies in its consistent operational cash flow and solid income quality, making it a reliable cash machine. However, its declining return on invested capital signals a point of vigilance for long-term value creation. It fits well in portfolios seeking steady, moderate growth with resilience in healthcare.
Edwards Lifesciences offers a strategic moat through its strong profitability and efficient use of capital, reflected in a robust ROE and favorable debt profile. Compared to Stryker, it presents a safer balance sheet and higher earnings yield, appealing to investors focused on growth at a reasonable price with a margin of safety.
If you prioritize operational cash flow reliability and moderate growth, Stryker stands out due to its strong income quality despite some value erosion concerns. However, if you seek higher profitability with a more conservative financial structure, Edwards Lifesciences offers better stability and a more compelling valuation profile, though its recent price trend suggests caution.
Disclaimer: Investment carries a risk of loss of initial capital. The past performance is not a reliable indicator of future results. Be sure to understand risks before making an investment decision.
Go Further
I encourage you to read the complete analyses of Stryker Corporation and Edwards Lifesciences Corporation to enhance your investment decisions: