Medtronic plc and Edwards Lifesciences Corporation are two leading players in the medical devices industry, both specializing in innovative cardiovascular and surgical technologies. While Medtronic offers a broad portfolio from implantable devices to diabetes management, Edwards focuses on structural heart disease solutions and critical care monitoring. This comparison aims to uncover which company presents a more compelling investment opportunity in 2026. Let’s explore their strengths and growth potential to guide your portfolio decisions.
Table of contents
Companies Overview
I will begin the comparison between Medtronic plc and Edwards Lifesciences Corporation by providing an overview of these two companies and their main differences.
Medtronic Overview
Medtronic plc develops, manufactures, and sells device-based medical therapies globally. Its business spans cardiovascular, medical surgical, neuroscience, and diabetes portfolios, offering products from implantable cardiac devices to robotic-assisted surgery systems. Founded in 1949 and headquartered in Dublin, Ireland, Medtronic holds a leading position in the medical devices industry with a market cap of $125B and employs around 95,000 people.
Edwards Lifesciences Overview
Edwards Lifesciences Corporation focuses on structural heart disease and critical care monitoring products. It specializes in minimally invasive transcatheter heart valve replacements and repairs, as well as surgical heart solutions and advanced hemodynamic monitoring systems. Founded in 1958 and based in Irvine, California, Edwards has a market cap of about $50B and approximately 15,800 employees, serving markets worldwide.
Key similarities and differences
Both companies operate in the medical devices sector with a focus on cardiovascular therapies, but Medtronic offers a broader product range including diabetes and neuroscience segments. Edwards is more specialized in structural heart and critical care technologies. Medtronic’s larger scale and diversified portfolio contrast with Edwards’ focus on innovative heart valve solutions and monitoring, reflecting different strategic approaches within the healthcare industry.
Income Statement Comparison
This table compares key income statement metrics for Medtronic plc and Edwards Lifesciences Corporation based on their most recent fiscal year results.
| Metric | Medtronic plc (MDT) | Edwards Lifesciences Corporation (EW) |
|---|---|---|
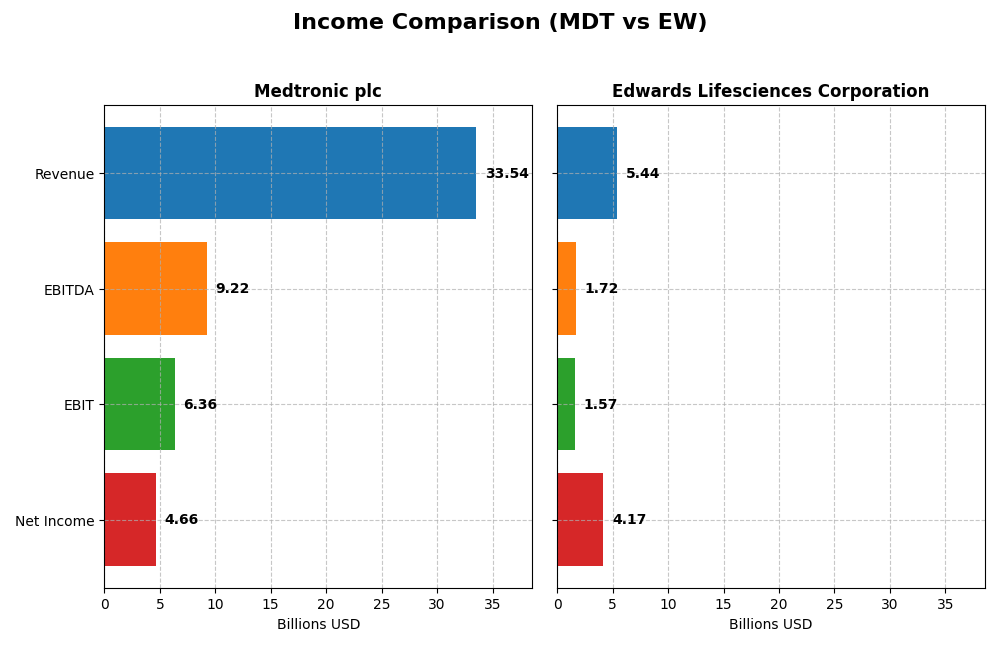
| Market Cap | 125B | 50B |
| Revenue | 33.54B | 5.44B |
| EBITDA | 9.22B | 1.72B |
| EBIT | 6.36B | 1.57B |
| Net Income | 4.66B | 4.17B |
| EPS | 3.63 | 6.98 |
| Fiscal Year | 2025 | 2024 |
Income Statement Interpretations
Medtronic plc
Medtronic showed steady revenue growth from 2021 to 2025, increasing from 30.1B to 33.5B USD. Net income rose from 3.6B to 4.7B USD, with net margins improving favorably to 13.9%. The latest fiscal year saw a moderate revenue growth of 3.6%, while EBIT and net margin growth accelerated, indicating improved profitability and operational efficiency.
Edwards Lifesciences Corporation
Edwards Lifesciences experienced robust revenue growth, from 4.4B USD in 2020 to 5.4B USD in 2024. Net income surged remarkably from 823M to 4.2B USD, driven by a very high net margin of 76.75%. The most recent year reported an 8.6% revenue increase, with significant EPS and net margin expansion, albeit accompanied by unfavorable operating expense growth relative to revenue.
Which one has the stronger fundamentals?
Both companies demonstrate favorable income statement fundamentals, with Edwards Lifesciences showing stronger growth rates and higher net margins, but also some expense growth concerns. Medtronic displays more moderate growth with consistent margin improvements and favorable interest expense ratios. The evaluation reflects Edwards’ rapid expansion versus Medtronic’s stable and efficient profitability.
Financial Ratios Comparison
The table below presents a side-by-side comparison of key financial ratios for Medtronic plc (MDT) and Edwards Lifesciences Corporation (EW) based on their most recent fiscal year data.
| Ratios | Medtronic plc (MDT) 2025 | Edwards Lifesciences (EW) 2024 |
|---|---|---|
| ROE | 9.7% | 41.8% |
| ROIC | 6.1% | 10.7% |
| P/E | 23.4 | 10.6 |
| P/B | 2.27 | 4.43 |
| Current Ratio | 1.85 | 4.18 |
| Quick Ratio | 1.42 | 3.45 |
| D/E (Debt-to-Equity) | 0.59 | 0.07 |
| Debt-to-Assets | 31.1% | 5.4% |
| Interest Coverage | 8.17 | 69.63 |
| Asset Turnover | 0.37 | 0.42 |
| Fixed Asset Turnover | 4.91 | 3.05 |
| Payout Ratio | 77.0% | 0% |
| Dividend Yield | 3.3% | 0% |
Interpretation of the Ratios
Medtronic plc
Medtronic shows a balanced ratio profile with 50% favorable and 35.7% neutral ratios, indicating a slightly favorable financial position. Key strengths include a strong net margin of 13.9%, good liquidity with a current ratio of 1.85, and solid interest coverage at 8.72. However, the return on equity at 9.71% and asset turnover are less favorable, suggesting moderate efficiency concerns. The company pays dividends with a yield of 3.29%, supported by a stable payout ratio and manageable buyback activities, though free cash flow to equity is negative, implying caution on sustainability.
Edwards Lifesciences Corporation
Edwards Lifesciences displays a favorable ratio set, with 64.3% favorable and 7.1% neutral, reflecting robust financial health. The firm excels in profitability metrics, including a high net margin of 76.75%, ROE of 41.75%, and interest coverage near 79. Despite a low dividend yield of 0%, this aligns with a reinvestment strategy in a high-growth phase, supported by strong free cash flow to equity. Some concerns arise from an unfavorable price-to-book ratio of 4.43 and a high current ratio of 4.18, implying potential inefficiencies in asset utilization.
Which one has the best ratios?
Edwards Lifesciences generally outperforms Medtronic in profitability, leverage, and efficiency ratios, with a more favorable global ratio opinion. Medtronic maintains solid liquidity and dividend yield but shows weaker returns on equity and asset management. Both companies have specific strengths and concerns, with Edwards favored for growth metrics and Medtronic for income distribution, reflecting different financial profiles.
Strategic Positioning
This section compares the strategic positioning of Medtronic plc and Edwards Lifesciences Corporation, including market position, key segments, and exposure to technological disruption:
Medtronic plc
- Large market cap of 125B USD with broad competitive pressure in medical devices.
- Diversified segments: Cardiac and Vascular, Diabetes, Medical Surgical, Neuroscience.
- Exposure includes implantable devices, surgical AI, and robotic-assisted surgery technologies.
Edwards Lifesciences Corporation
- Mid-size market cap of 50B USD, focused competition in heart valve devices.
- Concentrated segments: Structural heart disease, critical care, surgical monitoring.
- Focused on transcatheter valve replacements and advanced hemodynamic monitoring.
Medtronic plc vs Edwards Lifesciences Corporation Positioning
Medtronic exhibits a diversified portfolio across multiple medical device areas, offering broad revenue streams but facing varied competitive pressures. Edwards Lifesciences concentrates on heart valve and critical care technologies, enabling specialization but with narrower market exposure.
Which has the best competitive advantage?
Edwards Lifesciences shows a slightly favorable MOAT by creating value with ROIC above WACC, despite declining profitability. Medtronic faces a slightly unfavorable MOAT, shedding value but with improving ROIC trends.
Stock Comparison
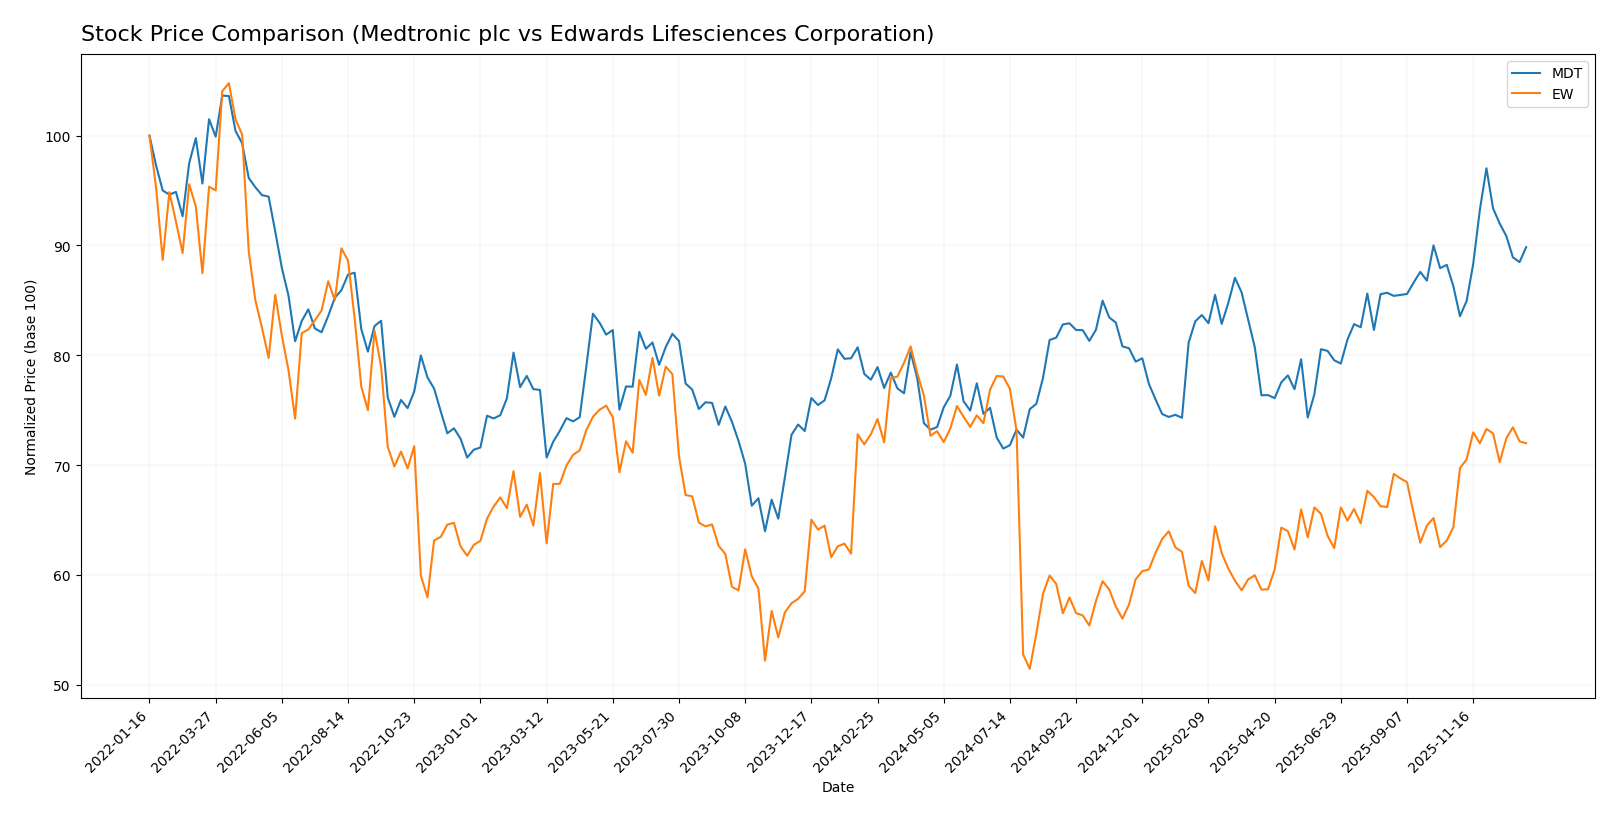
The stock price movements of Medtronic plc and Edwards Lifesciences Corporation over the past year reveal contrasting trading dynamics, with Medtronic showing steady gains and Edwards experiencing recent recovery after an overall decline.
Trend Analysis
Medtronic plc’s stock registered a 15.53% increase over the past 12 months, indicating a bullish trend with accelerating momentum. The price ranged between 77.61 and 105.33, supported by moderate volatility (std deviation 5.91).
Edwards Lifesciences Corporation’s stock showed a slight overall decline of 1.13% over the same period, classifying it as bearish despite acceleration signs. Volatility was higher at 8.32, with prices fluctuating between 60.83 and 95.56.
Comparing both, Medtronic delivered stronger market performance with a clear bullish trend, while Edwards remained bearish overall, despite recent upward movement in the last quarter.
Target Prices
Analysts present a bullish consensus for Medtronic plc and Edwards Lifesciences Corporation with attractive upside potential.
| Company | Target High | Target Low | Consensus |
|---|---|---|---|
| Medtronic plc | 120 | 103 | 111.67 |
| Edwards Lifesciences Corporation | 108 | 87 | 96.47 |
The consensus target prices for both companies exceed their current stock prices, suggesting analysts expect moderate gains in the medium term. Medtronic shows a stronger upside potential compared to Edwards Lifesciences.
Analyst Opinions Comparison
This section compares analysts’ ratings and grades for Medtronic plc and Edwards Lifesciences Corporation:
Rating Comparison
MDT Rating
- Rating: B, considered very favorable overall.
- Discounted Cash Flow Score: 4, favorable valuation.
- ROE Score: 3, moderate efficiency in generating profit.
- ROA Score: 4, favorable asset utilization.
- Debt To Equity Score: 1, very unfavorable financial risk.
- Overall Score: 3, moderate financial standing.
EW Rating
- Rating: A-, also very favorable overall.
- Discounted Cash Flow Score: 4, favorable valuation.
- ROE Score: 4, favorable profit generation efficiency.
- ROA Score: 5, very favorable asset utilization.
- Debt To Equity Score: 3, moderate financial risk.
- Overall Score: 4, favorable financial standing.
Which one is the best rated?
Based strictly on the provided data, Edwards Lifesciences Corporation holds stronger ratings and financial scores overall, particularly excelling in ROE, ROA, and overall score, while Medtronic shows some weaknesses in debt management.
Scores Comparison
Here is a comparison of the Altman Z-Score and Piotroski Score for both companies:
MDT Scores
- Altman Z-Score: 3.20, indicating a safe zone.
- Piotroski Score: 7, indicating strong financial health.
EW Scores
- Altman Z-Score: 12.28, indicating a safe zone.
- Piotroski Score: 5, indicating average financial health.
Which company has the best scores?
EW has a notably higher Altman Z-Score, suggesting stronger bankruptcy safety, while MDT has a higher Piotroski Score, indicating stronger financial health. Both excel in different score aspects based on the data.
Grades Comparison
The following presents the latest reliable grades for Medtronic plc and Edwards Lifesciences Corporation:
Medtronic plc Grades
This table summarizes recent grades assigned to Medtronic plc by reputable grading companies.
| Grading Company | Action | New Grade | Date |
|---|---|---|---|
| Bernstein | Maintain | Outperform | 2026-01-09 |
| Barclays | Maintain | Overweight | 2026-01-08 |
| William Blair | Upgrade | Outperform | 2026-01-06 |
| Truist Securities | Maintain | Hold | 2025-12-18 |
| Truist Securities | Maintain | Hold | 2025-11-20 |
| Barclays | Maintain | Overweight | 2025-11-20 |
| UBS | Maintain | Neutral | 2025-11-19 |
| Morgan Stanley | Maintain | Overweight | 2025-11-19 |
| Goldman Sachs | Upgrade | Neutral | 2025-11-19 |
| Wells Fargo | Maintain | Overweight | 2025-11-19 |
Medtronic’s grades show a generally positive outlook with multiple “Outperform” and “Overweight” ratings, and a recent upgrade from “Market Perform” to “Outperform.”
Edwards Lifesciences Corporation Grades
This table summarizes recent grades assigned to Edwards Lifesciences Corporation by reputable grading companies.
| Grading Company | Action | New Grade | Date |
|---|---|---|---|
| TD Cowen | Upgrade | Buy | 2026-01-09 |
| Stifel | Maintain | Buy | 2026-01-07 |
| JP Morgan | Upgrade | Overweight | 2025-12-18 |
| Canaccord Genuity | Maintain | Hold | 2025-12-17 |
| Baird | Maintain | Neutral | 2025-12-16 |
| Citigroup | Maintain | Buy | 2025-12-11 |
| Barclays | Maintain | Overweight | 2025-12-08 |
| Truist Securities | Maintain | Hold | 2025-12-05 |
| Canaccord Genuity | Maintain | Hold | 2025-12-05 |
| UBS | Maintain | Neutral | 2025-12-05 |
Edwards Lifesciences has consistently received “Buy” and “Overweight” ratings, with recent upgrades indicating a bullish sentiment among analysts.
Which company has the best grades?
Both companies have a consensus “Buy” rating, but Edwards Lifesciences shows a higher frequency of recent “Buy” and “Overweight” grades compared to Medtronic’s mix of “Outperform,” “Overweight,” and “Hold.” This suggests a slightly stronger positive momentum for Edwards Lifesciences, potentially affecting investor confidence and portfolio allocation decisions.
Strengths and Weaknesses
Below is a comparative overview of Medtronic plc (MDT) and Edwards Lifesciences Corporation (EW) across key criteria relevant to investors.
| Criterion | Medtronic plc (MDT) | Edwards Lifesciences Corporation (EW) |
|---|---|---|
| Diversification | Highly diversified across cardiac, diabetes, medical surgical, neuroscience sectors with revenues exceeding $12B in cardiac group | More focused on heart valve therapies and critical care; less diversified but specialized |
| Profitability | Moderate net margin at 13.9%, ROIC at 6.08% (neutral), ROE at 9.71% (unfavorable) | Strong profitability with net margin 76.75%, ROIC 10.72%, ROE 41.75% (all favorable) |
| Innovation | Steady growth in ROIC (+23%), investing in multiple therapeutic areas | Declining ROIC (-41%), indicating challenges in sustaining profitability despite innovation |
| Global presence | Extensive global footprint with broad product portfolio | Strong presence in heart valve market, but narrower global reach than MDT |
| Market Share | Large market share in multiple medical device segments | Leading market share in transcatheter heart valves, a niche but growing market |
Key takeaways: Medtronic offers strong diversification and steady growth potential but faces some profitability and efficiency challenges. Edwards demonstrates superior current profitability and market leadership in its niche, though its declining ROIC suggests a cautionary note on future returns. Investors should weigh diversification against specialized market strength when choosing between these stocks.
Risk Analysis
Below is a comparative risk table for Medtronic plc (MDT) and Edwards Lifesciences Corporation (EW) based on the most recent data available.
| Metric | Medtronic plc (MDT) | Edwards Lifesciences Corporation (EW) |
|---|---|---|
| Market Risk | Beta 0.73 (lower volatility) | Beta 0.96 (moderate volatility) |
| Debt level | Debt/Equity 0.59 (neutral) | Debt/Equity 0.07 (low, favorable) |
| Regulatory Risk | Moderate, global healthcare | Moderate, specialized heart devices |
| Operational Risk | Large scale, diversified ops | More focused product line |
| Environmental Risk | Standard medical device sector | Standard medical device sector |
| Geopolitical Risk | Based in Ireland, global ops | US-based, global presence |
The most impactful risks are regulatory and market risks. Both companies face strict regulatory environments, but Edwards shows lower financial leverage, reducing debt-related risks. Medtronic’s lower beta suggests less market volatility exposure. Investors should monitor regulatory changes and global market trends closely.
Which Stock to Choose?
Medtronic plc (MDT) shows a favorable income evolution with net margin at 13.9% and consistent growth in EPS and net income. Its financial ratios are slightly favorable overall, with strong liquidity and dividend yield but moderate profitability and debt metrics. The rating is very favorable with a “B” grade, supported by a safe-zone Altman Z-score and a strong Piotroski score. However, the moat evaluation indicates value destruction despite growing ROIC.
Edwards Lifesciences Corporation (EW) displays a strong income evolution with a net margin of 76.75% and impressive growth in earnings and net income over the period. Financial ratios are favorable overall, highlighted by excellent profitability, low debt, and solid coverage ratios, though some metrics like price-to-book and current ratio are less favorable. The rating is very favorable with an “A-” grade, backed by a safe-zone Altman Z-score but an average Piotroski score. Its moat evaluation suggests value creation despite a declining ROIC trend.
Investors focused on stability and dividend income might find MDT’s consistent profitability and favorable rating attractive. Conversely, those seeking higher growth potential and value creation could view EW’s superior profitability and favorable financial ratios as more appealing, despite its declining ROIC. The choice might depend on the investor’s risk tolerance and investment strategy.
Disclaimer: Investment carries a risk of loss of initial capital. The past performance is not a reliable indicator of future results. Be sure to understand risks before making an investment decision.
Go Further
I encourage you to read the complete analyses of Medtronic plc and Edwards Lifesciences Corporation to enhance your investment decisions: