Home > Comparison > Utilities > XEL vs EIX
The competitive dynamic between Xcel Energy Inc. and Edison International shapes the U.S. regulated electric utility sector’s future. Xcel operates a diversified generation platform spanning multiple energy sources, emphasizing scale and renewables. Edison specializes in high-capacity transmission and distribution across California, focusing on customer solutions and infrastructure. This analysis contrasts their strategic paths to identify which offers superior risk-adjusted returns for a diversified portfolio in a sector facing regulatory and technological shifts.
Table of contents
Companies Overview
Xcel Energy and Edison International dominate key U.S. regional markets in regulated electric utilities.
Xcel Energy Inc.: Diverse Energy Generation Leader
Xcel Energy Inc. stands as a regulated electric utility serving 3.7M electricity and 2.1M natural gas customers. Its revenue stems from generating and distributing power through coal, nuclear, natural gas, and renewables. In 2026, Xcel sharpened its focus on expanding renewable generation and upgrading natural gas infrastructure across eight states, bolstering its competitive edge in clean energy transition.
Edison International: California Power Provider
Edison International operates as a regulated electric power distributor serving 15M customers across California. It earns primarily by delivering electricity and offering energy solutions to diverse sectors. The company emphasized grid modernization and reliability enhancements in 2026, managing an extensive transmission network and aiming to meet increasing demand amid California’s evolving regulatory environment.
Strategic Collision: Similarities & Divergences
Both companies thrive as regulated utilities anchored in regional monopolies but differ strategically. Xcel’s diversified fuel mix contrasts with Edison’s concentrated California footprint and grid complexity. The primary battleground lies in renewable integration and infrastructure investment. Xcel’s varied energy sources offer resilience, while Edison’s scale in a single state provides operational depth. These profiles reflect distinct risk and growth dynamics within regulated utility frameworks.
Income Statement Comparison
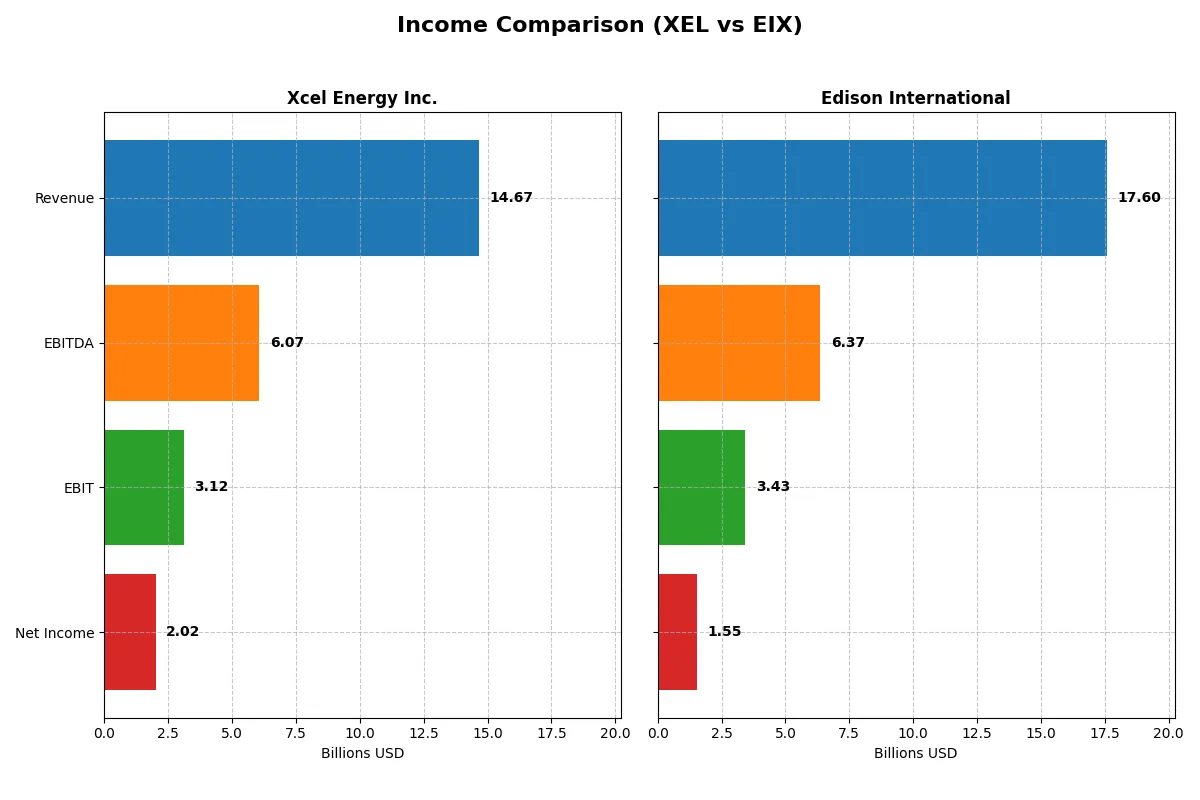
This data dissects the core profitability and scalability of both corporate engines to reveal who dominates the bottom line:
| Metric | Xcel Energy Inc. (XEL) | Edison International (EIX) |
|---|---|---|
| Revenue | 14.7B | 17.6B |
| Cost of Revenue | 11.1B | 10.4B |
| Operating Expenses | 686M | 4.3B |
| Gross Profit | 3.6B | 7.2B |
| EBITDA | 6.1B | 6.4B |
| EBIT | 3.1B | 3.4B |
| Interest Expense | 1.3B | 1.9B |
| Net Income | 2.0B | 1.3B |
| EPS | 3.44 | 3.33 |
| Fiscal Year | 2025 | 2024 |
Income Statement Analysis: The Bottom-Line Duel
This income statement comparison reveals which company drives superior efficiency and profitability in their core operations.
Xcel Energy Inc. Analysis
Xcel Energy’s revenue grew steadily to $14.7B in 2025, with net income reaching $2.0B. Its gross margin slipped sharply year-over-year but remains solid at 24.3%. The company improved EBIT margin to 21.24%, signaling operational momentum despite a slight net margin decline to 13.76%. Efficiency gains support a favorable earnings trajectory.
Edison International Analysis
Edison International reported $17.6B in revenue for 2024, showing moderate growth. Gross margin stands robust at 41.0%, with EBIT margin healthy at 19.5%. Net income rose to $1.55B, reflecting improved profitability and margin expansion. Interest expense pressure is a concern, but overall earnings growth and net margin gains demonstrate solid financial discipline.
Verdict: Margin Strength vs. Earnings Momentum
Xcel Energy excels with a stronger net margin and sustained income growth, while Edison International boasts superior gross margins and revenue scale. Xcel’s consistent margin improvement highlights operational efficiency. Investors seeking stable and improving profitability may favor Xcel, whereas those valuing top-line growth and margin breadth might lean toward Edison.
Financial Ratios Comparison
These vital ratios act as a diagnostic tool to expose the underlying fiscal health, valuation premiums, and capital efficiency of the companies compared below:
| Ratios | Xcel Energy Inc. (XEL) | Edison International (EIX) |
|---|---|---|
| ROE | 9.9% (2024) | 9.9% (2024) |
| ROIC | 3.6% (2024) | 3.6% (2024) |
| P/E | 19.6 (2024) | 19.9 (2024) |
| P/B | 1.95 (2024) | 1.98 (2024) |
| Current Ratio | 0.67 (2024) | 0.85 (2024) |
| Quick Ratio | 0.57 (2024) | 0.78 (2024) |
| D/E | 1.55 (2024) | 2.43 (2024) |
| Debt-to-Assets | 43.1% (2024) | 44.1% (2024) |
| Interest Coverage | 2.14 (2025) | 1.57 (2024) |
| Asset Turnover | 0.19 (2024) | 0.21 (2024) |
| Fixed Asset Turnover | 0.23 (2024) | 0.29 (2024) |
| Payout ratio | 82.2% (2025) | 83.2% (2024) |
| Dividend yield | 3.83% (2025) | 4.17% (2024) |
| Fiscal Year | 2025 | 2024 |
Efficiency & Valuation Duel: The Vital Signs
Financial ratios act as a company’s DNA, exposing hidden risks and operational strengths essential for investment decisions.
Xcel Energy Inc.
Xcel Energy shows a favorable net margin of 13.76%, signaling strong profitability, though ROE and ROIC are unavailable, limiting efficiency insights. Its P/E ratio of 21.48 is neutral, indicating fair valuation. The stock offers a healthy 3.83% dividend yield, rewarding shareholders steadily amid modest capital efficiency concerns.
Edison International
Edison International posts a neutral net margin of 8.78% and a slightly lower ROE of 9.93%, reflecting moderate profitability and operational challenges. The P/E of 19.93 suggests a fair valuation. It yields 4.17% in dividends but faces several unfavorable leverage and liquidity ratios, indicating heightened financial risk.
Profitability and Risk: Dividend Strength vs. Balance Sheet Concerns
Xcel Energy balances strong profitability with a solid dividend, despite limited capital return data. Edison International delivers a marginally higher yield but grapples with unfavorable leverage and liquidity. Investors seeking steady income with moderate risk may lean toward Xcel, while those tolerant of balance sheet weaknesses might consider Edison.
Which one offers the Superior Shareholder Reward?
I compare Xcel Energy Inc. (XEL) and Edison International (EIX) on dividends and buybacks to identify the superior shareholder reward. XEL yields 3.1–3.8% with a payout ratio around 60–82%, showing moderate dividend sustainability. EIX offers a higher 4.2–4.7% yield but pays out over 83–139% of earnings, signaling risk in dividend sustainability. Both companies report negative free cash flow, pressuring long-term payouts. XEL’s dividend payout is more conservative and better covered by operating cash flow. Buyback intensity is not explicitly stated but both appear to prioritize dividend returns. I conclude XEL’s balanced distribution approach offers a more sustainable total return profile in 2026, despite EIX’s higher immediate yield that carries payout risk.
Comparative Score Analysis: The Strategic Profile
The radar chart reveals the fundamental DNA and trade-offs of Xcel Energy Inc. and Edison International, highlighting their financial strengths and vulnerabilities:
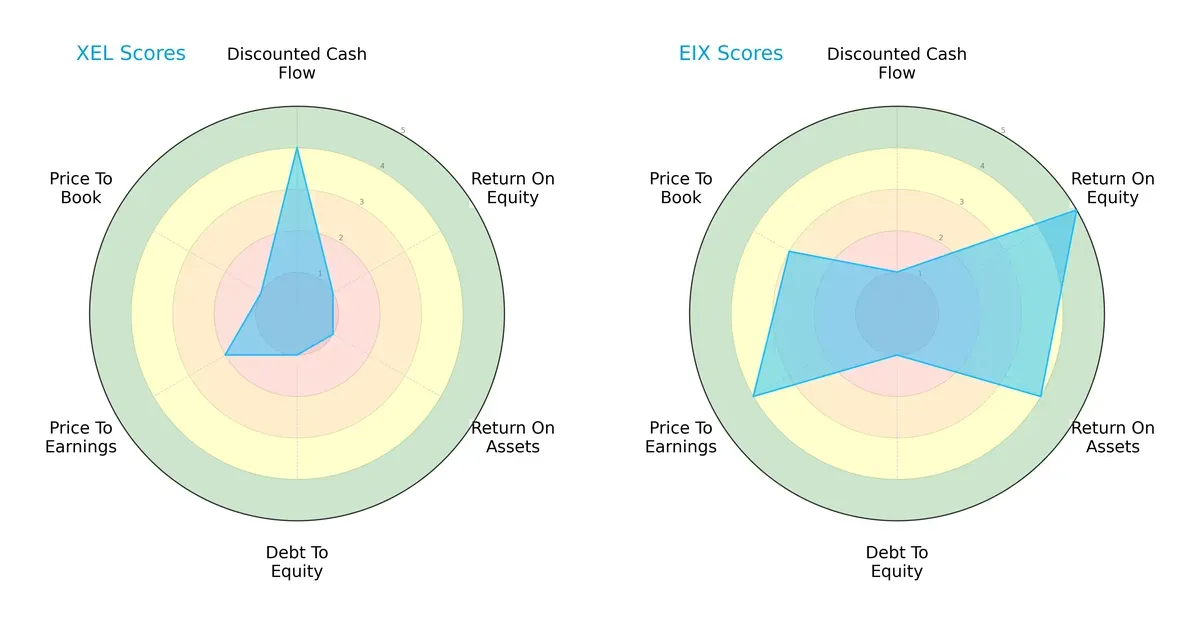
Xcel Energy shows strength in discounted cash flow (4) but suffers poor returns on equity (1) and assets (1), alongside weak debt management and valuation metrics. Edison International excels in return on equity (5) and assets (4), with better price-to-earnings (4) and price-to-book (3) scores, yet struggles with cash flow and leverage equally. Edison holds a more balanced profile driven by operational efficiency, while Xcel relies heavily on valuation appeal.
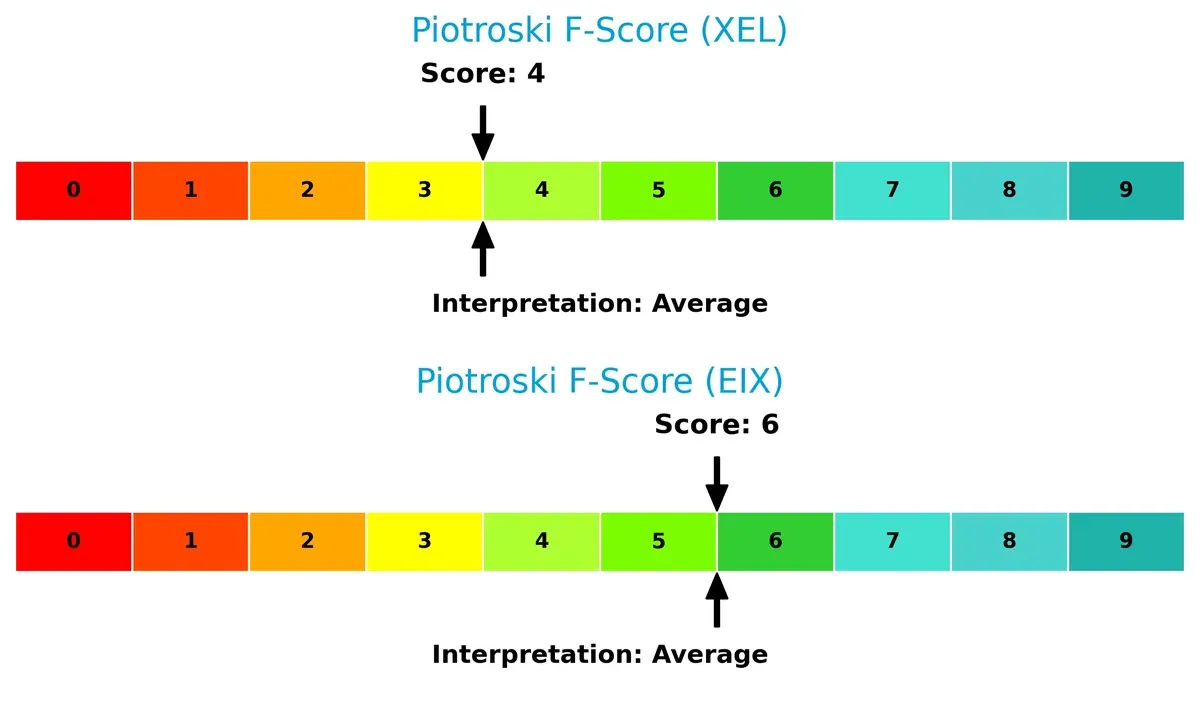
Financial Health: Quality of Operations
Edison International scores a 6 on the Piotroski F-Score, outperforming Xcel Energy’s 4, indicating stronger internal financial health and fewer red flags in profitability, leverage, and liquidity metrics:
How are the two companies positioned?
This section dissects the operational DNA of Xcel Energy and Edison International by comparing their revenue distribution and internal dynamics. The objective is to confront their economic moats and identify which model offers the most resilient competitive advantage today.
Revenue Segmentation: The Strategic Mix
This visual comparison dissects how Xcel Energy Inc. and Edison International diversify income streams and where their primary sector bets lie:
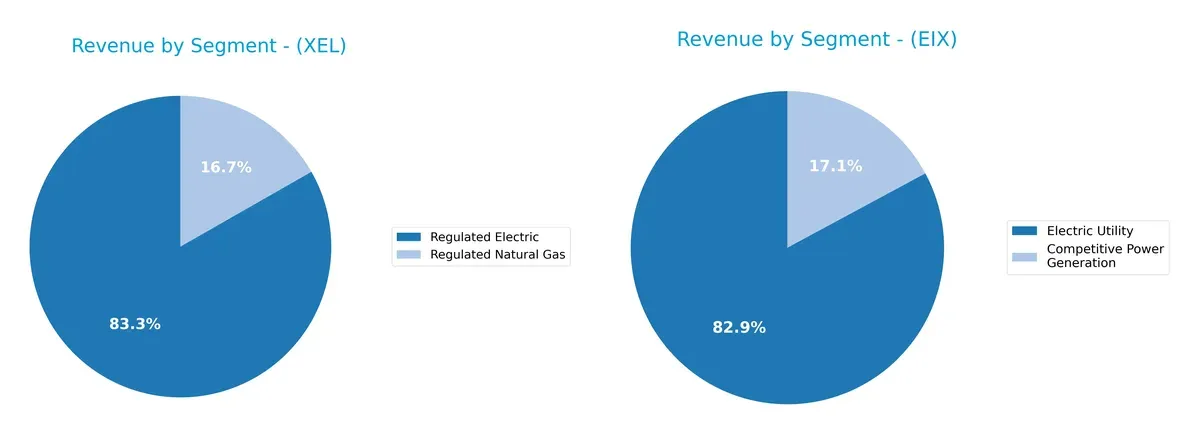
Xcel Energy leans heavily on Regulated Electric, generating $22.3B in 2024, while Regulated Natural Gas adds $4.5B, showing a balanced but electric-centric portfolio. Edison International pivots on Electric Utility with $10.6B in 2011, overshadowing its $2.2B Competitive Power Generation segment. Xcel’s diversification reduces concentration risk, while Edison’s reliance on electric utilities anchors it in infrastructure dominance but increases exposure to regulatory shifts.
Strengths and Weaknesses Comparison
This table compares the strengths and weaknesses of Xcel Energy Inc. and Edison International:
Xcel Energy Inc. Strengths
- Strong net margin at 13.76%
- Favorable debt-to-equity and debt-to-assets ratios
- Attractive dividend yield of 3.83%
- Stable regulated electric and natural gas segments
Edison International Strengths
- Favorable WACC at 5.98% indicating efficient capital cost management
- Neutral P/E of 19.93 supports valuation stability
- Dividend yield slightly higher at 4.17%
- Presence in competitive power generation and electric utility segments
Xcel Energy Inc. Weaknesses
- Unfavorable ROE and ROIC at 0% indicate poor capital returns
- Unfavorable liquidity ratios (current and quick ratios at 0)
- Unfavorable asset turnover metrics
- Slightly unfavorable overall ratio profile
Edison International Weaknesses
- Unfavorable ROE and ROIC below cost of capital
- High debt-to-equity at 2.43 raises financial risk
- Low current and quick ratios below 1 indicate liquidity pressure
- Unfavorable interest coverage ratio limits debt servicing flexibility
Xcel Energy excels in profitability and conservative leverage but struggles with capital efficiency and liquidity. Edison International faces higher financial risk and weaker returns despite efficient capital costs. Both must address operational and financial weaknesses to strengthen competitive positions.
The Moat Duel: Analyzing Competitive Defensibility
A structural moat is the only barrier protecting long-term profits from relentless competition and market pressures:
Xcel Energy Inc. (XEL): Intangible Assets and Regulatory Backbone
Xcel Energy leverages regulatory frameworks and a diversified energy mix as its moat. This creates margin stability and steady returns despite a declining ROIC trend. Expansion into renewables could deepen its moat in 2026.
Edison International (EIX): Operational Efficiency with Growing ROIC
Edison International’s moat stems from operational scale and infrastructure, reflected in improving profitability and a rising ROIC trend. Unlike Xcel, EIX shows stronger growth potential despite currently shedding value.
Infrastructure Scale vs. Regulatory Stability: Who Holds the Deeper Moat?
Edison International displays a deeper moat with rising ROIC and operational leverage, while Xcel’s regulatory moat offers stability but shows signs of weakening. EIX is better positioned to defend market share amid evolving energy demands.
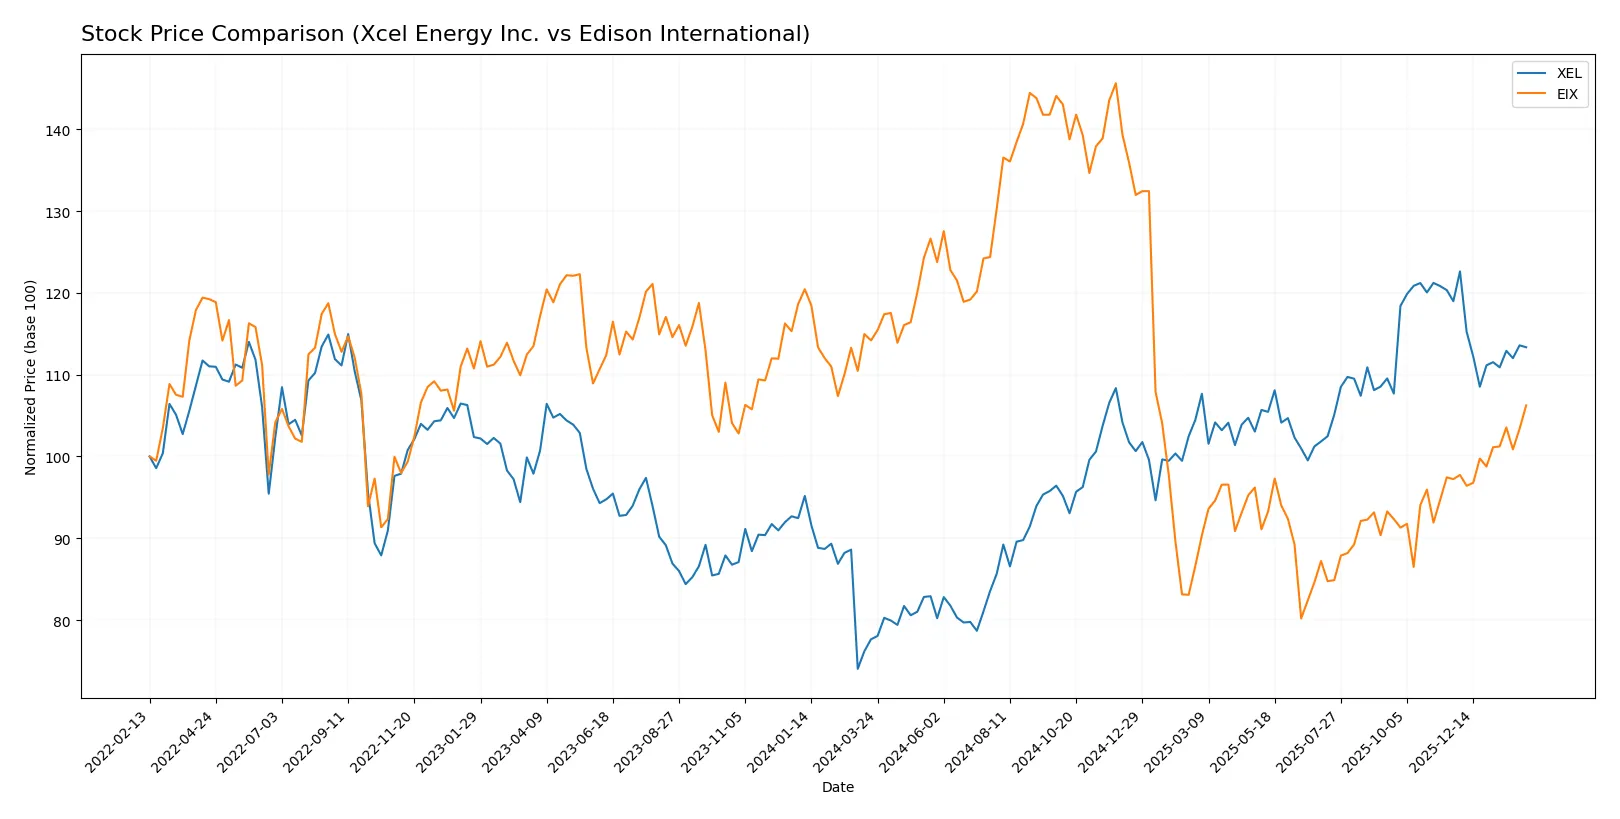
Which stock offers better returns?
The past year shows divergent price movements: Xcel Energy’s stock rose sharply before recent mild decline, while Edison International’s stock fell overall but gained steadily in the latest months.
Trend Comparison
Xcel Energy’s stock increased 46.0% over the past year, signaling a strong bullish trend with deceleration. It peaked at 82.11 and bottomed at 51.99, showing moderate volatility (8.24 std dev).
Edison International’s stock declined 7.0% over the past year, marking a bearish trend with accelerating losses. It reached a high of 87.75 and a low of 48.32, with higher volatility (12.12 std dev).
Xcel Energy outperformed Edison International over the full year. Despite recent weakness, Xcel’s total return exceeds Edison’s overall negative trend.
Target Prices
Analysts show a bullish consensus on Xcel Energy Inc. and Edison International, projecting moderate upside from current prices.
| Company | Target Low | Target High | Consensus |
|---|---|---|---|
| Xcel Energy Inc. | 81 | 95 | 88 |
| Edison International | 57 | 70 | 62.6 |
Xcel Energy’s consensus target of 88 exceeds its current price of 75.9, signaling expected growth. Edison International’s target consensus of 62.6 also suggests moderate appreciation from 64.01.

Don’t Let Luck Decide Your Entry Point
Optimize your entry points with our advanced ProRealTime indicators. You’ll get efficient buy signals with precise price targets for maximum performance. Start outperforming now!
How do institutions grade them?
This section compares the latest institutional grades for Xcel Energy Inc. and Edison International:
Xcel Energy Inc. Grades
The table below summarizes recent grades from major financial institutions for Xcel Energy Inc.
| Grading Company | Action | New Grade | Date |
|---|---|---|---|
| Barclays | Maintain | Overweight | 2026-01-15 |
| UBS | Maintain | Neutral | 2025-12-17 |
| Keybanc | Maintain | Overweight | 2025-12-12 |
| JP Morgan | Maintain | Overweight | 2025-12-11 |
| Barclays | Maintain | Overweight | 2025-11-05 |
| Citigroup | Maintain | Buy | 2025-11-03 |
| UBS | Maintain | Neutral | 2025-10-31 |
| Mizuho | Maintain | Outperform | 2025-10-27 |
| Jefferies | Maintain | Buy | 2025-10-16 |
| Keybanc | Maintain | Overweight | 2025-10-15 |
Edison International Grades
The table below shows recent institutional grades for Edison International.
| Grading Company | Action | New Grade | Date |
|---|---|---|---|
| JP Morgan | Maintain | Neutral | 2026-01-28 |
| Jefferies | Maintain | Hold | 2026-01-28 |
| Barclays | Maintain | Overweight | 2026-01-22 |
| Wells Fargo | Downgrade | Underweight | 2026-01-20 |
| Morgan Stanley | Maintain | Underweight | 2025-12-17 |
| JP Morgan | Maintain | Neutral | 2025-12-12 |
| UBS | Maintain | Buy | 2025-12-02 |
| Ladenburg Thalmann | Maintain | Neutral | 2025-10-30 |
| Barclays | Maintain | Overweight | 2025-10-29 |
| Morgan Stanley | Maintain | Underweight | 2025-10-22 |
Which company has the best grades?
Xcel Energy Inc. consistently receives more favorable grades, including multiple Overweight and Buy ratings. Edison International shows mixed ratings with notable Underweight downgrades. This disparity may influence investors seeking stronger institutional conviction.
Risks specific to each company
In 2026, these categories highlight critical pressure points and systemic threats confronting both Xcel Energy Inc. (XEL) and Edison International (EIX) in today’s volatile market environment:
1. Market & Competition
Xcel Energy Inc. (XEL)
- Operates in multiple states with diverse energy sources, limiting local competitive risk
Edison International (EIX)
- Concentrated in California, facing intense regulatory-driven competition and market saturation
2. Capital Structure & Debt
Xcel Energy Inc. (XEL)
- Favorable debt-to-equity metrics, indicating prudent leverage management
Edison International (EIX)
- High debt-to-equity (2.43), signaling elevated financial risk and pressure on interest coverage
3. Stock Volatility
Xcel Energy Inc. (XEL)
- Low beta (0.476) suggests defensive stock with lower market sensitivity
Edison International (EIX)
- Higher beta (0.829) reflects greater volatility and market risk exposure
4. Regulatory & Legal
Xcel Energy Inc. (XEL)
- Multi-state presence diversifies regulatory risk but requires complex compliance
Edison International (EIX)
- Heavy regulatory scrutiny in California raises legal costs and uncertainty
5. Supply Chain & Operations
Xcel Energy Inc. (XEL)
- Broad energy mix improves operational resilience
Edison International (EIX)
- Extensive grid infrastructure in fire-prone areas increases operational risk
6. ESG & Climate Transition
Xcel Energy Inc. (XEL)
- Invests in renewables and natural gas, aligning with climate goals
Edison International (EIX)
- Faces greater pressure to accelerate clean energy transition in California
7. Geopolitical Exposure
Xcel Energy Inc. (XEL)
- Primarily domestic operations with limited geopolitical risk
Edison International (EIX)
- Similar US focus but California-specific political risks impact business environment
Which company shows a better risk-adjusted profile?
Xcel Energy’s strongest advantage lies in its conservative capital structure and lower stock volatility. Edison International faces its greatest challenge in high leverage coupled with regulatory and operational risks in California. XEL’s diversified footprint and debt discipline grant it a superior risk-adjusted profile. The distress-zone Altman Z-score for EIX confirms its precarious financial position, validating my caution about its elevated risk.
Final Verdict: Which stock to choose?
Xcel Energy Inc. (XEL) stands out for its robust cash generation and consistent net margin, making it a dependable cash machine in a capital-intensive sector. However, its declining return on invested capital signals a need for cautious monitoring. XEL suits portfolios aiming for steady income with moderate growth.
Edison International (EIX) benefits from a strategic moat built on improving operational efficiency and a growing return on invested capital, hinting at potential value creation ahead. While its financial leverage and interest coverage warrant vigilance, EIX offers relatively better growth prospects and fits well in growth-at-a-reasonable-price (GARP) strategies.
If you prioritize stable cash flow and income resilience, XEL is the compelling choice due to its solid net margins and dividend yield. However, if you seek improving profitability and growth potential with a tolerance for leverage risks, EIX offers superior upside opportunities despite current financial headwinds.
Disclaimer: Investment carries a risk of loss of initial capital. The past performance is not a reliable indicator of future results. Be sure to understand risks before making an investment decision.
Go Further
I encourage you to read the complete analyses of Xcel Energy Inc. and Edison International to enhance your investment decisions: