WEC Energy Group, Inc. and Edison International are two prominent players in the regulated electric utility industry, serving millions of customers with electricity and energy solutions. Both companies share a focus on innovation and sustainable energy strategies, positioning themselves as key competitors in the evolving energy market. In this article, I will analyze their strengths and risks to help you decide which company is the more compelling investment opportunity in 2026.
Table of contents
Companies Overview
I will begin the comparison between WEC Energy Group and Edison International by providing an overview of these two companies and their main differences.
WEC Overview
WEC Energy Group, Inc. is a regulated electric utility focused on providing natural gas, electricity, and renewable energy services across the United States. Operating through multiple segments, WEC generates power from coal, natural gas, hydroelectric, wind, solar, and biomass sources. The company emphasizes electric transmission and natural gas distribution, serving a broad customer base with extensive infrastructure including over 35,000 miles of distribution lines.
EIX Overview
Edison International generates and distributes electric power primarily in California, delivering energy to 15 million customers across residential, commercial, industrial, and public sectors. Its infrastructure encompasses a vast network of overhead and underground lines plus numerous substations. Founded in 1886, Edison focuses on regulated electric services and energy solutions for commercial and industrial users within Southern, Central, and Coastal California.
Key similarities and differences
Both WEC and Edison operate in the regulated electric utility industry with a focus on power generation and distribution. They maintain large-scale transmission and distribution infrastructure, serving millions of customers. However, WEC’s operations include a broader geographic footprint and diversified energy sources including natural gas and renewables, while Edison International is concentrated in California with a primary emphasis on electric power delivery and energy solutions within that region.
Income Statement Comparison
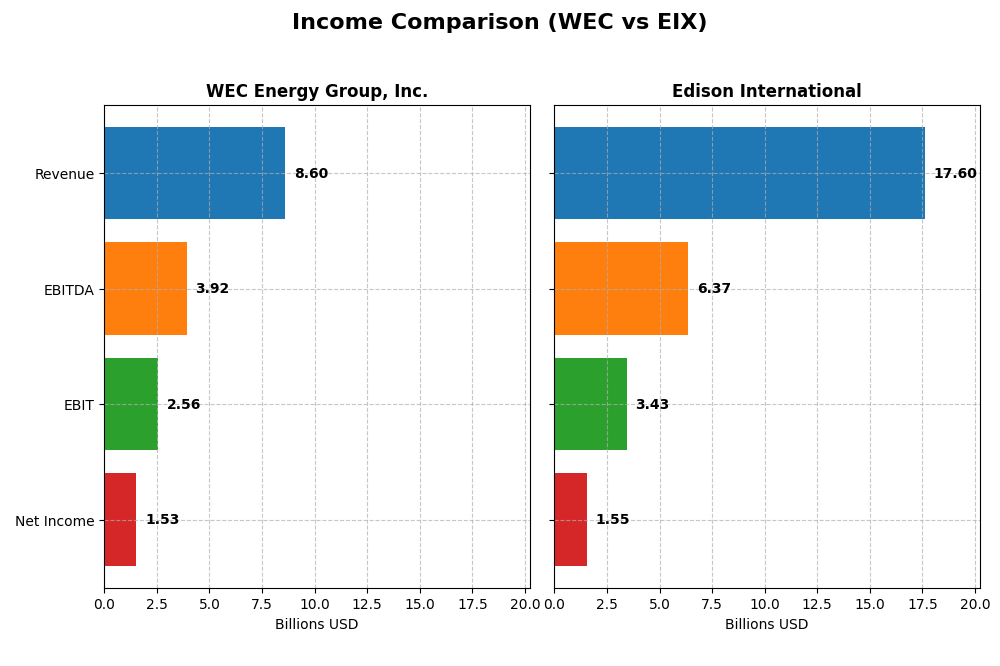
The table below presents a side-by-side comparison of key income statement metrics for WEC Energy Group, Inc. and Edison International for the fiscal year 2024.
| Metric | WEC Energy Group, Inc. | Edison International |
|---|---|---|
| Market Cap | 33.5B | 23.5B |
| Revenue | 8.6B | 17.6B |
| EBITDA | 3.9B | 6.4B |
| EBIT | 2.6B | 3.4B |
| Net Income | 1.53B | 1.55B |
| EPS | 4.81 | 3.33 |
| Fiscal Year | 2024 | 2024 |
Income Statement Interpretations
WEC Energy Group, Inc.
WEC Energy Group showed overall revenue growth of 18.76% from 2020 to 2024, despite a 3.3% decline in revenue in 2024. Net income increased by 27.25% over the period, with a favorable net margin of 17.77% in 2024. The latest year saw improved gross profit and EBIT margins, with net income and EPS growth signaling strengthened profitability.
Edison International
Edison International experienced a 29.61% revenue increase over five years, with a 7.72% rise in 2024. Net income surged 77.5% overall, though 2024’s net margin growth was modest at 2.01%. The company maintained a favorable gross margin of 41.01% and EBIT margin of 19.5%, but interest expenses remain relatively high, impacting net margin.
Which one has the stronger fundamentals?
Both companies have favorable income statement evaluations, with WEC showing higher net and EBIT margins and consistent profitability improvements. Edison International demonstrates stronger revenue and net income growth but faces higher interest expenses that pressure margins. The choice depends on prioritizing margin stability or growth dynamics.
Financial Ratios Comparison
The table below presents a side-by-side comparison of key financial ratios for WEC Energy Group, Inc. (WEC) and Edison International (EIX) based on their most recent fiscal year data for 2024.
| Ratios | WEC Energy Group, Inc. (WEC) | Edison International (EIX) |
|---|---|---|
| ROE | 12.3% | 9.9% |
| ROIC | 4.14% | 3.61% |
| P/E | 19.46 | 19.93 |
| P/B | 2.39 | 1.98 |
| Current Ratio | 0.60 | 0.85 |
| Quick Ratio | 0.43 | 0.78 |
| D/E | 1.64 | 2.43 |
| Debt-to-Assets | 42.9% | 44.1% |
| Interest Coverage | 2.64 | 1.57 |
| Asset Turnover | 0.18 | 0.21 |
| Fixed Asset Turnover | 0.25 | 0.29 |
| Payout ratio | 69.1% | 83.2% |
| Dividend yield | 3.55% | 4.17% |
Interpretation of the Ratios
WEC Energy Group, Inc.
WEC shows a mixed ratio profile with favorable net margin (17.77%) and WACC (5.3%), but weak liquidity indicated by a current ratio of 0.6 and quick ratio of 0.43. Leverage is high with a debt-to-equity of 1.64. Dividend yield is attractive at 3.55%, supported by stable payouts, though free cash flow coverage is limited, suggesting cautious monitoring of distributions.
Edison International
EIX’s ratios reveal challenges with an unfavorable return on equity (9.93%) and interest coverage (1.84), alongside weak liquidity ratios under 1. Debt levels are elevated at 2.43 debt-to-equity. The company maintains a 4.17% dividend yield, but free cash flow deficits may pressure dividend sustainability, requiring attention to capital allocation and financial flexibility.
Which one has the best ratios?
Comparing both, WEC’s ratios are slightly unfavorable but better balanced, with stronger profitability and dividend yield than EIX. Edison International faces more unfavorable ratios, including weaker returns and coverage ratios. Thus, WEC appears to have relatively stronger ratio fundamentals in this comparison.
Strategic Positioning
This section compares the strategic positioning of WEC Energy Group, Inc. and Edison International, focusing on Market position, Key segments, and disruption:
WEC
- Leading regulated electric utility with moderate competitive pressure.
- Diverse regional segments: Wisconsin, Illinois, Other States, plus energy infrastructure.
- Exposure to renewable and nonregulated energy infrastructure segments.
EIX
- Regulated electric utility serving 15M customers in California facing steady competition.
- Main segments: Electric Utility and Competitive Power Generation in California.
- Exposure linked to electric utility and competitive power generation operations.
WEC vs EIX Positioning
WEC pursues a diversified approach across multiple states and business segments, including non-utility infrastructure, while EIX concentrates on California’s electric utility and generation. WEC’s broader footprint contrasts with EIX’s focused market, influencing operational scale and segment risk exposure.
Which has the best competitive advantage?
Both companies show slightly unfavorable economic moats, shedding value despite growing ROIC trends. WEC and EIX face challenges in sustaining returns above capital costs, indicating no clear competitive advantage based on current MOAT evaluations.
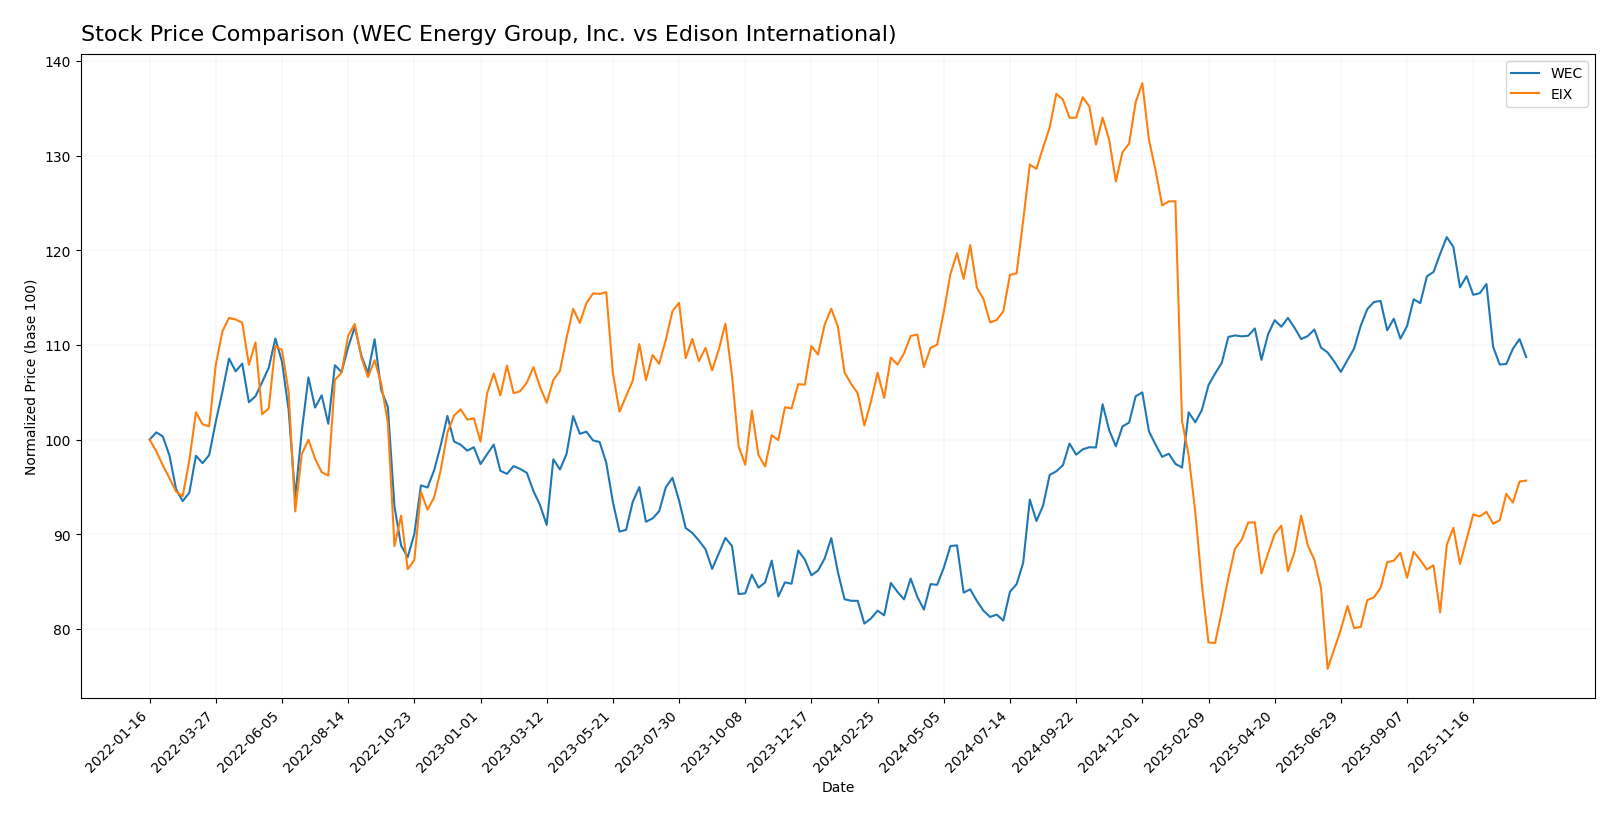
Stock Comparison
The stock prices of WEC Energy Group, Inc. and Edison International have exhibited distinct dynamics over the past year, with WEC showing a strong overall gain despite recent weakness, while Edison has faced an overall decline with a recent modest recovery.
Trend Analysis
WEC Energy Group’s stock rose 34.05% over the past 12 months, reflecting a bullish trend with decelerating momentum. It reached a high of 116.84 and a low of 77.85, with overall volatility at 11.44%.
Edison International’s stock declined 8.02% over the same period, indicating a bearish trend with accelerating downside. The price ranged between 48.32 and 87.75, and volatility stood at 12.11%.
Comparatively, WEC delivered the highest market performance over the last year, outperforming Edison, which experienced a negative total price change despite recent positive gains.
Target Prices
The consensus target prices for WEC Energy Group, Inc. and Edison International show a generally positive outlook from analysts.
| Company | Target High | Target Low | Consensus |
|---|---|---|---|
| WEC Energy Group, Inc. | 136 | 105 | 122.67 |
| Edison International | 70 | 56 | 62 |
Analysts expect WEC’s stock to appreciate moderately above its current price of 104.65 USD, while Edison International’s consensus target price is slightly above its current 60.99 USD, indicating modest upside potential.
Analyst Opinions Comparison
This section compares analysts’ ratings and financial scores for WEC Energy Group, Inc. (WEC) and Edison International (EIX):
Rating Comparison
WEC Rating
- Rating: B-, indicating a very favorable rating
- Discounted Cash Flow Score: 1, very unfavorable
- ROE Score: 4, favorable
- ROA Score: 4, favorable
- Debt To Equity Score: 2, moderate
- Overall Score: 3, moderate
EIX Rating
- Rating: B+, also a very favorable rating
- Discounted Cash Flow Score: 1, very unfavorable
- ROE Score: 5, very favorable
- ROA Score: 4, favorable
- Debt To Equity Score: 1, very unfavorable
- Overall Score: 3, moderate
Which one is the best rated?
EIX holds a higher rating (B+) versus WEC’s B-, with a superior ROE score of 5 compared to 4, though both share the same overall and DCF scores. WEC has a better debt-to-equity score, indicating lower financial risk.
Scores Comparison
The scores comparison between WEC and EIX highlights their financial health and bankruptcy risk:
WEC Scores
- Altman Z-Score: 1.14, in distress zone indicating high risk.
- Piotroski Score: 6, average financial strength rating.
EIX Scores
- Altman Z-Score: 0.72, in distress zone indicating high risk.
- Piotroski Score: 6, average financial strength rating.
Which company has the best scores?
Both WEC and EIX have Altman Z-Scores placing them in the distress zone, signaling financial risk. Their Piotroski Scores are identical at 6, reflecting average financial strength for each company based on the data provided.
Grades Comparison
Here is a comparison of the recent grades assigned to WEC Energy Group, Inc. and Edison International by major grading companies:
WEC Energy Group, Inc. Grades
The table below summarizes WEC Energy Group’s most recent grades from leading financial institutions:
| Grading Company | Action | New Grade | Date |
|---|---|---|---|
| B of A Securities | Maintain | Neutral | 2025-12-31 |
| UBS | Maintain | Neutral | 2025-12-17 |
| Barclays | Maintain | Underweight | 2025-12-16 |
| Keybanc | Maintain | Overweight | 2025-12-12 |
| JP Morgan | Maintain | Neutral | 2025-12-11 |
| Scotiabank | Maintain | Sector Outperform | 2025-10-31 |
| BMO Capital | Maintain | Market Perform | 2025-10-21 |
| Barclays | Maintain | Equal Weight | 2025-10-21 |
| Keybanc | Maintain | Overweight | 2025-10-15 |
| UBS | Maintain | Neutral | 2025-10-10 |
WEC Energy Group’s grades show a mixed but mostly neutral to slightly positive stance, with multiple “Neutral” and “Overweight” ratings and no recent upgrades or downgrades.
Edison International Grades
The table below summarizes Edison International’s most recent grades from leading financial institutions:
| Grading Company | Action | New Grade | Date |
|---|---|---|---|
| Morgan Stanley | Maintain | Underweight | 2025-12-17 |
| JP Morgan | Maintain | Neutral | 2025-12-12 |
| UBS | Maintain | Buy | 2025-12-02 |
| Ladenburg Thalmann | Maintain | Neutral | 2025-10-30 |
| Barclays | Maintain | Overweight | 2025-10-29 |
| Jefferies | Maintain | Hold | 2025-10-22 |
| Morgan Stanley | Maintain | Underweight | 2025-10-22 |
| Barclays | Maintain | Overweight | 2025-10-21 |
| Jefferies | Downgrade | Hold | 2025-10-02 |
| JP Morgan | Maintain | Neutral | 2025-09-25 |
Edison International’s grades range from “Underweight” to “Buy,” with a notable recent “Buy” rating from UBS and several “Overweight” and “Neutral” ratings, reflecting a cautiously optimistic consensus.
Which company has the best grades?
Edison International generally holds more favorable grades with a consensus “Buy” and several overweight and buy recommendations, while WEC Energy Group’s consensus is “Hold” with predominantly neutral ratings. This suggests that Edison International may be perceived as having a slightly stronger growth or value potential by analysts, potentially impacting investor interest and portfolio positioning.
Strengths and Weaknesses
Below is a comparative table highlighting the key strengths and weaknesses of WEC Energy Group, Inc. (WEC) and Edison International (EIX) based on their recent financial and operational data.
| Criterion | WEC Energy Group, Inc. (WEC) | Edison International (EIX) |
|---|---|---|
| Diversification | Moderate: Revenue mainly from Wisconsin and Illinois; limited non-utility energy infrastructure segment (~$691M in 2024) | Limited: Primarily electric utility with some competitive power generation; less diversified geographically |
| Profitability | Moderate profitability with net margin 17.77% (favorable); ROIC 4.14% below WACC indicating value destruction but improving | Lower profitability with net margin 8.78% (neutral); ROIC 3.61% below WACC indicating value destruction but improving |
| Innovation | Limited data, but moderate investment in non-utility infrastructure suggests some innovation in energy infrastructure | Lower innovation visibility; focus on traditional electric utility and power generation |
| Global presence | Regional focus primarily in Wisconsin and Illinois, limited national or global footprint | Regional focus in California, limited national/global presence |
| Market Share | Strong in Wisconsin utility market; steady revenue growth in key states | Strong in California utility market but faces more competition and regulatory challenges |
Key Takeaways
Both companies show slightly unfavorable economic moats with ROIC below WACC, indicating current value destruction despite improving profitability. WEC demonstrates stronger profitability and slightly better diversification, while Edison International faces more financial challenges and a narrower focus. Caution and risk management are advised when considering investments in these utilities.
Risk Analysis
Below is a comparative table summarizing key risks for WEC Energy Group, Inc. (WEC) and Edison International (EIX) as of 2024:
| Metric | WEC Energy Group, Inc. (WEC) | Edison International (EIX) |
|---|---|---|
| Market Risk | Moderate (Beta 0.57) | Moderate-High (Beta 0.83) |
| Debt Level | High (D/E 1.64; Debt/Assets 42.9%) | Very High (D/E 2.43; Debt/Assets 44.1%) |
| Regulatory Risk | Moderate (US utilities, stable regulatory environment) | Moderate-High (California regulations, wildfire liabilities) |
| Operational Risk | Moderate (Aging infrastructure, utility operations) | Moderate-High (Large grid, wildfire risk, infrastructure upgrades) |
| Environmental Risk | Moderate (Transition to renewables ongoing) | High (California wildfire exposure, renewable mandates) |
| Geopolitical Risk | Low (US domestic operations) | Low (US domestic operations) |
In synthesis, both WEC and EIX face significant operational and regulatory risks typical of regulated electric utilities. EIX carries higher environmental and debt risks, mainly due to wildfire liabilities and heavier leverage. WEC shows slightly better debt metrics but remains in financial distress according to Altman Z-score. Investors should weigh these risks carefully, prioritizing risk management given the utilities’ vulnerability to environmental and regulatory shifts.
Which Stock to Choose?
WEC Energy Group, Inc. shows a generally favorable income evolution with net margin at 17.77% and steady growth in earnings per share. Financial ratios reveal some weaknesses such as a low current ratio of 0.6 and a debt-to-equity ratio of 1.64, rated slightly unfavorable overall. Profitability remains solid with return on equity at 12.3%, but the company is shedding value with ROIC below WACC. Its credit rating stands at B- with moderate overall scores.
Edison International exhibits favorable income growth with a 29.61% revenue increase overall and an 8.78% net margin. However, financial ratios indicate challenges including a higher debt-to-equity ratio of 2.43 and weaker interest coverage, resulting in an unfavorable global ratio evaluation. Profitability is moderate with return on equity near 9.9%, while ROIC also trails WACC, signaling value destruction. The rating is B+ with moderate aggregate scores.
For investors prioritizing stable income growth and stronger profitability metrics, WEC may appear more favorable despite some financial ratio concerns. Conversely, those focusing on higher recent revenue growth and a better rating might find Edison International’s profile appealing, albeit with elevated financial risks. Both companies show improving profitability but are currently shedding value relative to their cost of capital.
Disclaimer: Investment carries a risk of loss of initial capital. The past performance is not a reliable indicator of future results. Be sure to understand risks before making an investment decision.
Go Further
I encourage you to read the complete analyses of WEC Energy Group, Inc. and Edison International to enhance your investment decisions: