Investors seeking stable opportunities in the regulated electric utility sector often consider The Southern Company (SO) and Edison International (EIX). Both companies operate extensive power generation and distribution networks, with overlapping markets in the U.S. and strong commitments to innovation in renewable energy and infrastructure modernization. This article will analyze their strengths and risks to help you decide which company offers the most compelling investment potential in 2026.
Table of contents
Companies Overview
I will begin the comparison between The Southern Company and Edison International by providing an overview of these two companies and their main differences.
The Southern Company Overview
The Southern Company operates in the regulated electric industry, focusing on generation, transmission, and distribution of electricity and natural gas. Serving approximately 8.7M customers, it manages diverse energy assets including hydroelectric, fossil fuel, nuclear, solar, and wind facilities. Headquartered in Atlanta, Georgia, it also offers digital wireless communications and fiber optics services, positioning itself as a broad energy and utility provider.
Edison International Overview
Edison International operates primarily in electric power generation and distribution across Southern, Central, and Coastal California, delivering electricity to 15M customers. The company maintains extensive transmission and distribution infrastructure, including thousands of circuit-miles of overhead and underground lines and hundreds of substations. Founded in 1886 and based in Rosemead, California, Edison focuses on regulated electric utilities and commercial energy solutions.
Key similarities and differences
Both companies operate in the regulated electric utilities sector, serving millions of residential and commercial customers with electric power. Southern Company has a broader energy portfolio including natural gas and renewable assets, while Edison International concentrates on electric power distribution within California. Southern has a larger market cap and workforce, whereas Edison’s operations emphasize transmission infrastructure and energy solutions for commercial users.
Income Statement Comparison
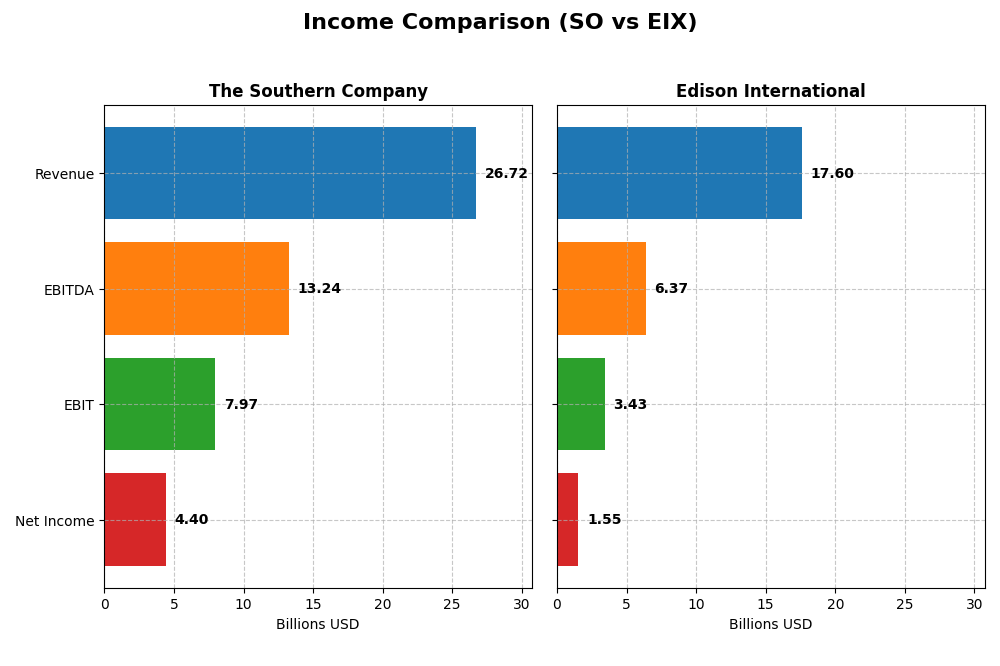
The table below presents a side-by-side comparison of key income statement metrics for The Southern Company and Edison International for the fiscal year 2024.
| Metric | The Southern Company (SO) | Edison International (EIX) |
|---|---|---|
| Market Cap | 95.7B | 23.5B |
| Revenue | 26.7B | 17.6B |
| EBITDA | 13.2B | 6.4B |
| EBIT | 7.97B | 3.43B |
| Net Income | 4.40B | 1.55B |
| EPS | 4.02 | 3.33 |
| Fiscal Year | 2024 | 2024 |
Income Statement Interpretations
The Southern Company
The Southern Company experienced steady revenue growth from 2020 to 2024, reaching $26.7B in 2024. Net income increased consistently, hitting $4.4B in the latest fiscal year. Gross margin remained strong at nearly 50%, while EBIT margin improved to 29.8%. Despite a slight rise in operating expenses, the 2024 performance showed favorable profitability with a 5.8% revenue growth and a 17.4% EBIT increase.
Edison International
Edison International saw overall revenue growth to $17.6B in 2024, with net income rising markedly to $1.55B. Gross margin was stable at 41%, with EBIT margin improving to 19.5%. Operating expenses grew in line with revenue, supporting a favorable operational efficiency. The 2024 results featured a solid 7.7% revenue increase and a 9.8% EBIT rise, alongside improving net margin trends.
Which one has the stronger fundamentals?
Both companies exhibit favorable income statement trends, but Edison International shows higher net income growth at 77.5% over the period versus Southern Company’s 40.4%. Edison’s net margin growth of 36.9% outpaces Southern’s 7.1%, though Southern maintains higher absolute margins. Interest expense ratios are similarly unfavorable for both. Overall, Edison displays stronger growth momentum, while Southern benefits from superior margin levels.
Financial Ratios Comparison
The table below compares key financial ratios for The Southern Company (SO) and Edison International (EIX) based on their latest full fiscal year data (2024).
| Ratios | The Southern Company (SO) | Edison International (EIX) |
|---|---|---|
| ROE | 13.25% | 9.93% |
| ROIC | 4.25% | 3.61% |
| P/E | 20.5 | 19.93 |
| P/B | 2.72 | 1.98 |
| Current Ratio | 0.67 | 0.85 |
| Quick Ratio | 0.46 | 0.78 |
| D/E (Debt-to-Equity) | 2.00 | 2.43 |
| Debt-to-Assets | 45.7% | 44.1% |
| Interest Coverage | 2.58 | 1.57 |
| Asset Turnover | 0.18 | 0.21 |
| Fixed Asset Turnover | 0.25 | 0.29 |
| Payout ratio | 67.1% | 83.2% |
| Dividend yield | 3.27% | 4.17% |
Interpretation of the Ratios
The Southern Company
The Southern Company shows a mixed ratio profile with a favorable net margin of 16.47% and a reasonable dividend yield of 3.27%, indicating steady shareholder returns. However, concerns arise from an unfavorable return on invested capital (4.25%), low current and quick ratios (0.67 and 0.46), and a debt-to-equity ratio of 2.0, suggesting liquidity and leverage risks. Dividend payments appear sustainable given the coverage by free cash flow.
Edison International
Edison International presents weaker financial ratios with an unfavorable return on equity (9.93%) and interest coverage ratio (1.84), alongside a high debt-to-equity ratio of 2.43, signaling financial pressure. The company maintains a dividend yield of 4.17%, but the unfavorable free cash flow metrics raise sustainability questions. Liquidity ratios, though better than The Southern Company, remain below optimal levels, indicating some risk.
Which one has the best ratios?
Comparing both, The Southern Company offers a slightly more favorable overall ratio profile with a stronger net margin and better dividend sustainability, despite some liquidity and leverage concerns. Edison International’s ratios are generally less favorable, with higher leverage and weaker profitability indicators, resulting in a more unfavorable assessment overall.
Strategic Positioning
This section compares the strategic positioning of The Southern Company and Edison International, covering market position, key segments, and exposure to technological disruption:
The Southern Company
- Leading regulated electric and gas utility with a stable market and moderate competitive pressure.
- Diverse segments including gas distribution, marketing, pipeline investments, and renewable power generation.
- Exposure includes renewable energy projects and digital communications, with traditional natural gas and electric assets.
Edison International
- Regulated electric utility focused on California with significant competition and moderate pressure.
- Primarily electric utility serving 15M customers, with competitive power generation and energy solutions.
- Focus on electric transmission and distribution, with competitive generation but limited diversification.
The Southern Company vs Edison International Positioning
The Southern Company follows a diversified approach across gas and electric utilities plus renewables, providing multiple revenue streams. Edison International is more concentrated on electric utility operations in California, focusing on power delivery and generation. Diversification vs concentration shapes their strategic risk and growth profiles.
Which has the best competitive advantage?
Both companies currently shed value as ROIC is below WACC, though both show improving ROIC trends. Neither demonstrates a strong economic moat; The Southern Company’s broader diversification may offer some resilience compared to Edison International’s concentrated exposure.
Stock Comparison
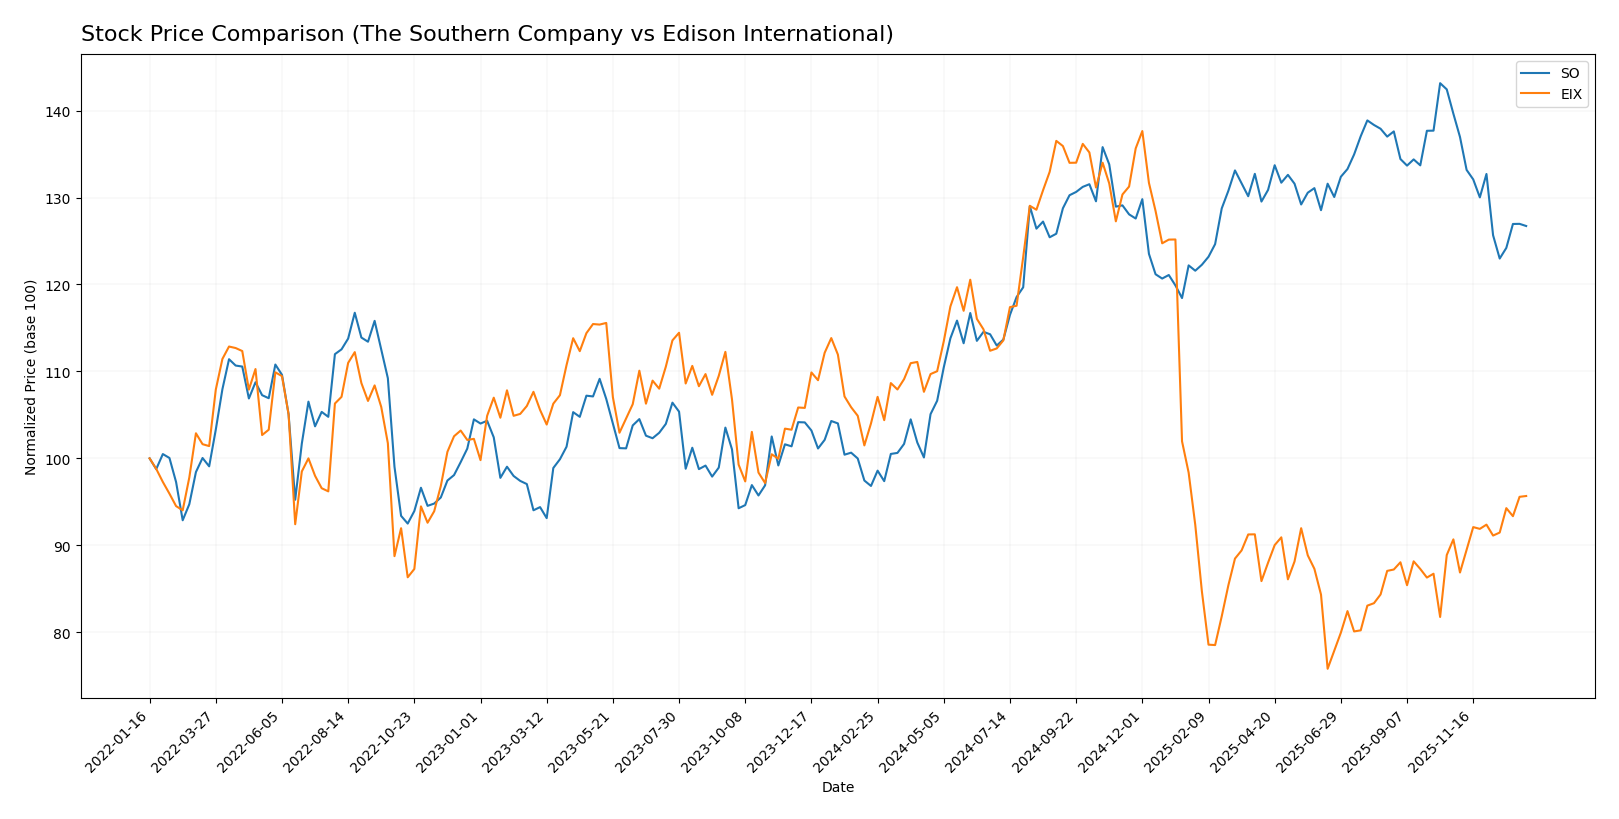
The stock price chart highlights significant movements over the past year, with The Southern Company showing strong gains despite recent pullbacks, while Edison International exhibits a longer-term decline with signs of recent recovery.
Trend Analysis
The Southern Company’s stock experienced a bullish trend over the past 12 months, rising 30.88%, though this growth decelerated toward the end of the period. Notable highs reached $98.29 and lows $66.48, with moderate volatility at 7.54%.
Edison International faced a bearish trend over the past year, declining 8.02%, but showed acceleration in the downturn. Recent months reveal a 5.5% price increase, indicating a slight recovery, with higher volatility at 12.11%.
Comparing both, The Southern Company delivered the highest market performance with a 30.88% gain, outperforming Edison International’s overall 8.02% loss despite its recent upward movement.
Target Prices
Analysts provide a clear consensus on target prices for The Southern Company and Edison International.
| Company | Target High | Target Low | Consensus |
|---|---|---|---|
| The Southern Company | 103 | 76 | 93.1 |
| Edison International | 70 | 56 | 62 |
The Southern Company’s consensus target of 93.1 suggests moderate upside from its current price of 87.01, while Edison International’s 62 target indicates a modest potential increase from 60.99. Overall, analysts expect steady performance for both utilities.
Analyst Opinions Comparison
This section compares analysts’ ratings and grades for The Southern Company and Edison International:
Rating Comparison
The Southern Company Rating
- Rating: B- rating classified as Very Favorable by analysts.
- Discounted Cash Flow Score: Moderate score of 3, indicating average valuation outlook.
- ROE Score: Favorable score of 4, showing efficient profit generation from equity.
- ROA Score: Moderate score of 3, reflecting average asset utilization effectiveness.
- Debt To Equity Score: Very Unfavorable score of 1, indicating high financial risk.
- Overall Score: Moderate score of 3, reflecting balanced overall financial health.
Edison International Rating
- Rating: B+ rating also classified as Very Favorable by analysts.
- Discounted Cash Flow Score: Very Unfavorable score of 1, signaling potential overvaluation.
- ROE Score: Very Favorable score of 5, indicating excellent efficiency in equity returns.
- ROA Score: Favorable score of 4, demonstrating strong asset utilization.
- Debt To Equity Score: Very Unfavorable score of 1, similarly indicating elevated financial risk.
- Overall Score: Moderate score of 3, indicating comparable overall financial health.
Which one is the best rated?
Edison International holds a higher rating of B+ compared to The Southern Company’s B-. Edison International outperforms in ROE and ROA scores but shares similar moderate overall and very unfavorable debt-to-equity scores with The Southern Company.
Scores Comparison
Here is a comparison of the key financial scores for The Southern Company and Edison International:
SO Scores
- Altman Z-Score: 0.98, in distress zone indicating high bankruptcy risk.
- Piotroski Score: 6, reflecting average financial strength.
EIX Scores
- Altman Z-Score: 0.72, in distress zone indicating high bankruptcy risk.
- Piotroski Score: 6, reflecting average financial strength.
Which company has the best scores?
Both The Southern Company and Edison International share the same Piotroski Score of 6, indicating average financial health. However, Southern has a slightly higher Altman Z-Score (0.98 vs. 0.72), though both remain in the distress zone, signaling elevated bankruptcy risk.
Grades Comparison
Here is a comparison of recent grades assigned to The Southern Company and Edison International by leading financial institutions:
The Southern Company Grades
The table below summarizes recent grade actions from reputable grading companies for The Southern Company:
| Grading Company | Action | New Grade | Date |
|---|---|---|---|
| UBS | Maintain | Neutral | 2025-12-17 |
| JP Morgan | Maintain | Neutral | 2025-12-15 |
| Jefferies | Maintain | Neutral | 2025-12-15 |
| RBC Capital | Maintain | Sector Perform | 2025-12-12 |
| Keybanc | Maintain | Underweight | 2025-12-12 |
| Mizuho | Maintain | Neutral | 2025-12-11 |
| Barclays | Maintain | Equal Weight | 2025-11-20 |
| Jefferies | Downgrade | Neutral | 2025-11-05 |
| Ladenburg Thalmann | Downgrade | Neutral | 2025-10-17 |
| Keybanc | Maintain | Underweight | 2025-10-15 |
Grades for The Southern Company generally indicate a cautious stance, with most actions maintaining a Neutral or Underweight rating and recent downgrades from Buy to Neutral by some firms.
Edison International Grades
The table below summarizes recent grade actions from reputable grading companies for Edison International:
| Grading Company | Action | New Grade | Date |
|---|---|---|---|
| Morgan Stanley | Maintain | Underweight | 2025-12-17 |
| JP Morgan | Maintain | Neutral | 2025-12-12 |
| UBS | Maintain | Buy | 2025-12-02 |
| Ladenburg Thalmann | Maintain | Neutral | 2025-10-30 |
| Barclays | Maintain | Overweight | 2025-10-29 |
| Jefferies | Maintain | Hold | 2025-10-22 |
| Morgan Stanley | Maintain | Underweight | 2025-10-22 |
| Barclays | Maintain | Overweight | 2025-10-21 |
| Jefferies | Downgrade | Hold | 2025-10-02 |
| JP Morgan | Maintain | Neutral | 2025-09-25 |
Edison International’s grades show a mix of Buy and Overweight ratings, with several firms maintaining a positive outlook despite some Underweight and Hold ratings.
Which company has the best grades?
Edison International has received comparatively better grades, including multiple Buy and Overweight ratings, while The Southern Company’s grades lean more toward Neutral and Underweight. This differential suggests a more favorable market perception for Edison International, potentially influencing investors seeking stronger growth or appreciation prospects.
Strengths and Weaknesses
Below is a comparative overview of key strengths and weaknesses for The Southern Company (SO) and Edison International (EIX) based on their latest financial and operational data.
| Criterion | The Southern Company (SO) | Edison International (EIX) |
|---|---|---|
| Diversification | Moderate diversification with strong gas and electric utilities segments; revenue from Southern Company Gas at $4.46B in 2024 | Less diversified; primarily electric utility and competitive power generation segments |
| Profitability | Net margin of 16.47% (favorable); ROIC 4.25% (unfavorable, below WACC of 4.96%) | Net margin 8.78% (neutral); ROIC 3.61% (unfavorable, below WACC of 5.94%) |
| Innovation | Growing ROIC trend (+13%) signals improving operational efficiency; moderate innovation focus | Strong ROIC growth (+86%) suggests improving returns; innovation efforts less visible |
| Global presence | Primarily US-focused with strong regional presence; limited global footprint | Mainly US regional operations; limited international exposure |
| Market Share | Leading position in gas distribution and electric utilities in the Southeast US | Significant market share in California electric utility market |
Key takeaways: Both SO and EIX face challenges with ROIC below their WACC, indicating value destruction despite improving profitability trends. SO benefits from better diversification and higher net margins, while EIX shows stronger ROIC growth but remains less diversified and financially more pressured. Investors should weigh these factors carefully considering risk and growth potential.
Risk Analysis
Below is a comparison table summarizing key risks for The Southern Company (SO) and Edison International (EIX) based on the latest 2024 financial and operational data.
| Metric | The Southern Company (SO) | Edison International (EIX) |
|---|---|---|
| Market Risk | Low beta (0.45) suggests lower volatility; moderate market exposure | Moderate beta (0.83) indicates higher sensitivity to market swings |
| Debt level | High debt-to-equity ratio (~2.0), interest coverage moderate (2.91) | Higher debt-to-equity (~2.43), weaker interest coverage (1.84) |
| Regulatory Risk | Moderate, operates in multiple states with complex regulations | Elevated, concentrated in California with stringent energy regulations |
| Operational Risk | Diverse asset base including renewables; moderate asset turnover | Extensive transmission network with aging infrastructure concerns |
| Environmental Risk | Exposure via fossil fuel plants but increasing renewables | High focus on clean energy but faces wildfire liability risks |
| Geopolitical Risk | Low, primarily US domestic operations | Low, but California-specific policy shifts impact business |
The most impactful risks are the high leverage and moderate to low interest coverage ratios for both companies, raising concerns about financial resilience. Edison International faces higher regulatory and environmental risk due to California’s strict policies and wildfire exposure, while Southern Company’s diversified asset base helps mitigate some operational risks. Both are currently in financial distress zones per Altman Z-scores, warranting cautious risk management.
Which Stock to Choose?
The Southern Company (SO) shows a favorable income evolution with a 31.16% revenue growth over five years and a net margin of 16.47%. While its profitability is solid, the company carries a high debt level (net debt to EBITDA of 4.93) and displays slightly unfavorable financial ratios overall, with a B- rating indicating moderate strength.
Edison International (EIX) also demonstrates favorable income growth, notably a 77.5% net income increase over the period, and a net margin of 8.78%. Despite unfavorable debt and interest coverage metrics, its financial ratios are more unfavorable overall than SO’s, though it has a higher B+ rating reflecting strong return on equity and assets.
For investors prioritizing income statement strength and moderate financial stability, SO might appear more favorable due to better profitability and a slightly better ratio balance. Conversely, those valuing growth in net income and strong returns on equity may see EIX as more appealing, despite its higher financial risk and less favorable ratio profile.
Disclaimer: Investment carries a risk of loss of initial capital. The past performance is not a reliable indicator of future results. Be sure to understand risks before making an investment decision.
Go Further
I encourage you to read the complete analyses of The Southern Company and Edison International to enhance your investment decisions: