Investors seeking stable returns in the utilities sector often consider leaders in regulated electric power, such as Public Service Enterprise Group Incorporated (PEG) and Edison International (EIX). Both companies serve large U.S. regions with extensive transmission and distribution networks, while innovating through renewable energy and efficiency programs. This comparison explores their market positions, growth strategies, and risk profiles to help you decide which company deserves a place in your investment portfolio.
Table of contents
Companies Overview
I will begin the comparison between Public Service Enterprise Group Incorporated and Edison International by providing an overview of these two companies and their main differences.
Public Service Enterprise Group Incorporated Overview
Public Service Enterprise Group Incorporated (PEG) operates as an energy company primarily in the Northeastern and Mid-Atlantic United States. It focuses on electricity transmission and distribution, gas delivery, and investments in solar generation and energy efficiency programs. PEG manages an extensive infrastructure, including 25,000 circuit miles of electric transmission and distribution and 18,000 miles of gas mains, positioning it as a key player in regulated electric utilities.
Edison International Overview
Edison International (EIX) generates and distributes electric power to approximately 15 million customers in Southern, Central, and Coastal California. Its operations include a vast transmission network with lines from 55 kV to 500 kV and a distribution system comprising about 70,000 circuit-miles of overhead and underground lines. The company also offers energy solutions to commercial and industrial users, emphasizing its comprehensive service in the regulated electric sector.
Key similarities and differences
Both PEG and EIX operate in the regulated electric utilities industry and focus on electricity transmission and distribution. They serve large regional markets in the US with significant infrastructure investments. However, PEG also provides natural gas services and invests in solar and energy efficiency initiatives, while EIX concentrates on electric power generation and a broader electric distribution system with a focus on California. Their customer bases and geographic footprints distinctly shape their business models.
Income Statement Comparison
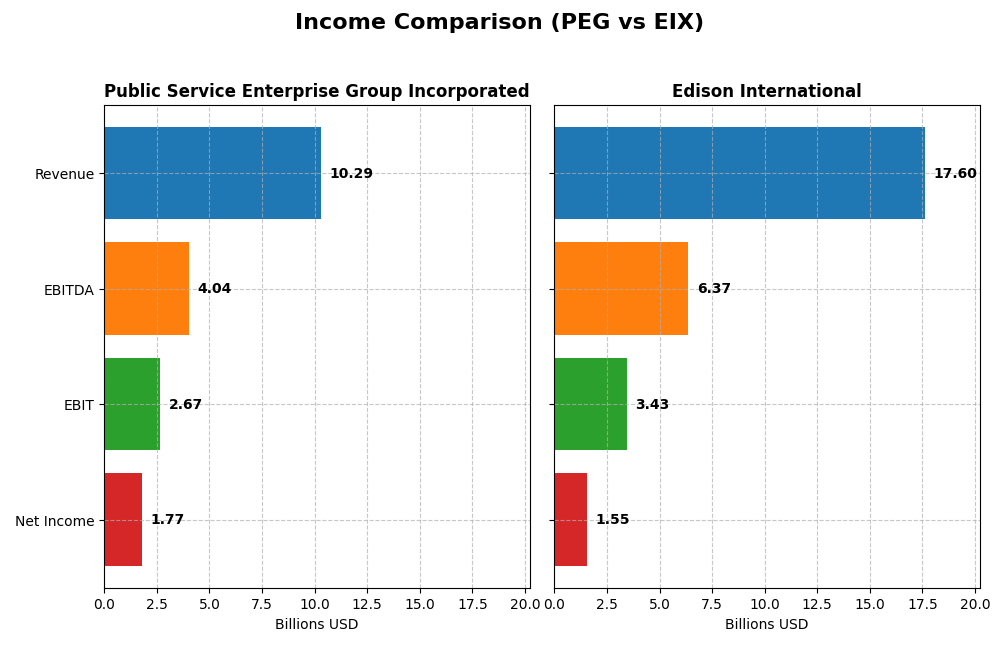
The table below compares the most recent fiscal year income statement metrics for Public Service Enterprise Group Incorporated and Edison International, providing a snapshot of their financial performance.
| Metric | Public Service Enterprise Group Incorporated (PEG) | Edison International (EIX) |
|---|---|---|
| Market Cap | 39.3B | 23.5B |
| Revenue | 10.3B | 17.6B |
| EBITDA | 4.04B | 6.37B |
| EBIT | 2.67B | 3.43B |
| Net Income | 1.77B | 1.55B |
| EPS | 3.56 | 3.33 |
| Fiscal Year | 2024 | 2024 |
Income Statement Interpretations
Public Service Enterprise Group Incorporated
From 2020 to 2024, Public Service Enterprise Group Incorporated (PEG) showed moderate revenue growth of 7.15%, yet net income declined by 6.98%. Margins were generally favorable, with a gross margin of 34.41% and net margin of 17.22%, though recent year figures reveal a decline in revenue by 8.43% and net income by 24.5%. Earnings per share also dropped by nearly 31%, signaling margin compression and slower growth in 2024.
Edison International
Edison International (EIX) experienced strong financial performance between 2020 and 2024, with revenue rising 29.61% and net income surging 77.5%. The company maintained favorable gross and net margins at 41.01% and 8.78%, respectively. In 2024, revenue grew by 7.72% and net income by 6.43%, supported by positive EBIT growth of 9.75%, reflecting stable margin expansion and solid earnings momentum.
Which one has the stronger fundamentals?
Edison International demonstrates stronger fundamentals given its consistent revenue and net income growth over the full period, coupled with favorable margin expansions and positive earnings per share trends. In contrast, Public Service Enterprise Group shows margin pressures and declining net income despite some revenue growth, indicating less robust profitability and more unfavorable recent performance metrics.
Financial Ratios Comparison
The table below compares key financial ratios for Public Service Enterprise Group Incorporated (PEG) and Edison International (EIX) based on the most recent fiscal year 2024 data.
| Ratios | Public Service Enterprise Group Incorporated (PEG) | Edison International (EIX) |
|---|---|---|
| ROE | 10.99% | 9.93% |
| ROIC | 4.40% | 3.61% |
| P/E | 23.74 | 19.93 |
| P/B | 2.61 | 1.98 |
| Current Ratio | 0.65 | 0.85 |
| Quick Ratio | 0.48 | 0.78 |
| D/E (Debt to Equity) | 1.42 | 2.43 |
| Debt-to-Assets | 41.9% | 44.1% |
| Interest Coverage | 2.80 | 1.57 |
| Asset Turnover | 0.19 | 0.21 |
| Fixed Asset Turnover | 0.26 | 0.29 |
| Payout Ratio | 67.5% | 83.2% |
| Dividend Yield | 2.84% | 4.17% |
Interpretation of the Ratios
Public Service Enterprise Group Incorporated
Public Service Enterprise Group shows a mixed ratio profile with favorable net margin (17.22%) and WACC (5.37%), but weaker liquidity (current ratio 0.65) and leverage (debt-to-equity 1.42). Return on equity is neutral at 11%, while return on invested capital is unfavorable at 4.4%. The company has a 2.84% dividend yield, reflecting steady shareholder returns without excessive payout risks.
Edison International
Edison International exhibits a less favorable ratio set, with net margin neutral at 8.78% and WACC favorable at 5.94%. However, it faces challenges in return on equity (9.93%), leverage (debt-to-equity 2.43), and interest coverage (1.84), all marked unfavorable. The dividend yield is 4.17%, indicating a higher yield but potential pressure on financial stability given the ratio weaknesses.
Which one has the best ratios?
Public Service Enterprise Group’s ratios are slightly unfavorable but generally more balanced, with fewer severe weaknesses compared to Edison International. Edison International’s higher proportion of unfavorable ratios and weaker coverage metrics suggest more financial risk. Overall, PEG presents a cautiously stronger ratio profile than EIX based on the 2024 fiscal year data.
Strategic Positioning
This section compares the strategic positioning of Public Service Enterprise Group Incorporated (PEG) and Edison International (EIX) including Market position, Key segments, and disruption:
Public Service Enterprise Group Incorporated
- Operates primarily in Northeastern and Mid-Atlantic US with regulated electric market exposure and moderate competitive pressure.
- Key segments include Public Service Electric and Gas, gas distribution contracts, transmission, and natural gas with diversified energy services.
- Exposure to technological disruption is limited; focuses on solar projects and energy efficiency programs within regulated markets.
Edison International
- Delivers electricity across Southern, Central, and Coastal California facing competitive and regulatory pressure in a large service area.
- Primarily electric utility with competitive power generation and energy solutions, focusing on electricity delivery to 15M customers.
- Faces technological challenges in competitive power generation and energy solutions but remains mainly a regulated electric utility.
PEG vs EIX Positioning
PEG’s approach features diversified energy segments including gas and solar, with large transmission and distribution assets. EIX concentrates on electricity delivery and competitive generation in California, balancing utility scale with market competition.
Which has the best competitive advantage?
Both PEG and EIX show slightly unfavorable MOAT evaluations, shedding value despite growing ROIC trends; PEG’s smaller negative gap suggests marginally better capital efficiency than EIX.
Stock Comparison
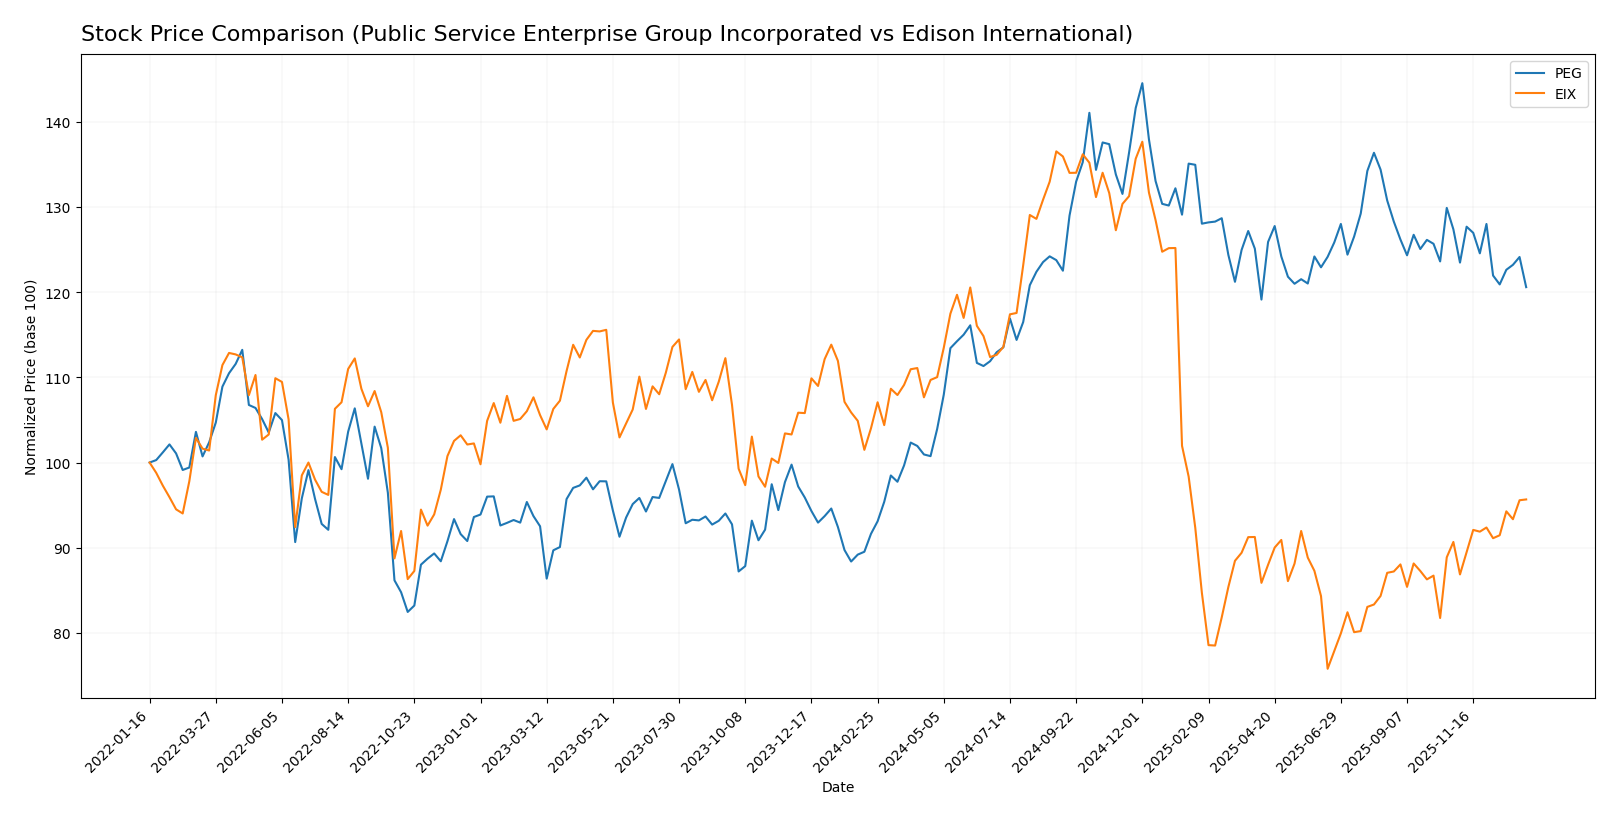
The stock prices of Public Service Enterprise Group Incorporated (PEG) and Edison International (EIX) have shown contrasting dynamics over the past year, with PEG demonstrating a strong overall rise despite recent weakness, while EIX faced a prolonged decline but showed signs of recovery lately.
Trend Analysis
Public Service Enterprise Group Incorporated (PEG) exhibited a bullish trend over the past 12 months with a 31.59% price increase, though recent months show a slight deceleration and a 5.33% drop. The stock experienced moderate volatility with a standard deviation of 7.17%.
Edison International (EIX) recorded a bearish trend over the same period with an 8.02% decline, but the downward momentum accelerated. Recently, EIX reversed course with a 5.5% rise, indicating a potential recovery amid higher volatility at 12.11%.
Comparing both, PEG delivered the highest market performance over the year with a substantial gain, whereas EIX’s overall decline was partially offset by recent positive momentum.
Target Prices
The current analyst consensus shows moderate upside potential for both Public Service Enterprise Group Incorporated and Edison International.
| Company | Target High | Target Low | Consensus |
|---|---|---|---|
| Public Service Enterprise Group Incorporated | 98 | 83 | 89 |
| Edison International | 70 | 56 | 62 |
Analysts expect Public Service Enterprise Group’s stock to rise from its current price of 78.68 USD to an average target of 89 USD, indicating moderate growth potential. Edison International’s consensus target of 62 USD also suggests a modest increase from its current price of 60.99 USD.
Analyst Opinions Comparison
This section compares analysts’ ratings and financial scores for Public Service Enterprise Group Incorporated (PEG) and Edison International (EIX):
Rating Comparison
PEG Rating
- Rating: B-, categorized as Very Favorable
- Discounted Cash Flow Score: 1, Very Unfavorable
- ROE Score: 4, Favorable
- ROA Score: 4, Favorable
- Debt To Equity Score: 2, Moderate
- Overall Score: 3, Moderate
EIX Rating
- Rating: B+, categorized as Very Favorable
- Discounted Cash Flow Score: 1, Very Unfavorable
- ROE Score: 5, Very Favorable
- ROA Score: 4, Favorable
- Debt To Equity Score: 1, Very Unfavorable
- Overall Score: 3, Moderate
Which one is the best rated?
EIX holds a higher rating (B+) compared to PEG’s B-, mainly due to a superior ROE score and a more favorable price-to-earnings score. Both share the same overall score of 3, indicating moderate standing.
Scores Comparison
Here is a comparison of the Altman Z-Score and Piotroski Score for PEG and EIX:
PEG Scores
- Altman Z-Score: 1.32, indicating financial distress.
- Piotroski Score: 7, reflecting strong financial health.
EIX Scores
- Altman Z-Score: 0.72, indicating financial distress.
- Piotroski Score: 6, reflecting average financial health.
Which company has the best scores?
PEG has a higher Piotroski Score (7 vs. 6), suggesting stronger financial health, while both are in the Altman Z-Score distress zone. PEG’s scores indicate relatively better overall financial strength.
Grades Comparison
Here is a comparison of the recent grades assigned to Public Service Enterprise Group Incorporated and Edison International:
Public Service Enterprise Group Incorporated Grades
The following table summarizes recent grades from established firms for PEG shares:
| Grading Company | Action | New Grade | Date |
|---|---|---|---|
| Ladenburg Thalmann | Upgrade | Buy | 2026-01-07 |
| UBS | Maintain | Buy | 2025-12-17 |
| JP Morgan | Maintain | Overweight | 2025-12-12 |
| Jefferies | Upgrade | Buy | 2025-11-06 |
| TD Cowen | Maintain | Buy | 2025-11-05 |
| BMO Capital | Maintain | Market Perform | 2025-11-04 |
| Barclays | Maintain | Equal Weight | 2025-10-21 |
| BMO Capital | Maintain | Market Perform | 2025-10-20 |
| Morgan Stanley | Maintain | Overweight | 2025-09-25 |
| BMO Capital | Maintain | Market Perform | 2025-08-06 |
Overall, PEG’s grades trend positively with multiple buy and overweight ratings and occasional market perform assessments, reflecting moderate analyst confidence.
Edison International Grades
The following table summarizes recent grades from established firms for EIX shares:
| Grading Company | Action | New Grade | Date |
|---|---|---|---|
| Morgan Stanley | Maintain | Underweight | 2025-12-17 |
| JP Morgan | Maintain | Neutral | 2025-12-12 |
| UBS | Maintain | Buy | 2025-12-02 |
| Ladenburg Thalmann | Maintain | Neutral | 2025-10-30 |
| Barclays | Maintain | Overweight | 2025-10-29 |
| Jefferies | Maintain | Hold | 2025-10-22 |
| Morgan Stanley | Maintain | Underweight | 2025-10-22 |
| Barclays | Maintain | Overweight | 2025-10-21 |
| Jefferies | Downgrade | Hold | 2025-10-02 |
| JP Morgan | Maintain | Neutral | 2025-09-25 |
Edison International presents a mixed grade profile with buy ratings tempered by underweight and hold positions, indicating cautious analyst sentiment.
Which company has the best grades?
Public Service Enterprise Group Incorporated shows a stronger consensus with more buy and overweight ratings compared to Edison International’s mixed ratings including underweight and hold grades. This suggests PEG may be viewed more favorably by analysts, potentially affecting investor confidence and portfolio decisions.
Strengths and Weaknesses
Below is a comparative table highlighting key strengths and weaknesses of Public Service Enterprise Group Incorporated (PEG) and Edison International (EIX) based on the most recent data available in 2026.
| Criterion | Public Service Enterprise Group (PEG) | Edison International (EIX) |
|---|---|---|
| Diversification | Moderately diversified with strong electric and gas segments; revenues spread across transmission, gas distribution, and contracts. | Less diversified, mainly focused on electric utility and competitive power generation. |
| Profitability | Net margin 17.22% (favorable), ROE moderate at 11% (neutral), but ROIC 4.4% below WACC (5.37%), indicating slight value destruction. | Net margin 8.78% (neutral), ROE 9.93% (unfavorable), ROIC 3.61% below WACC (5.94%), also indicating value destruction. |
| Innovation | Moderate innovation; steady growth in ROIC suggests improving operational efficiency. | Slower innovation impact; ROIC growing fast but still below WACC, reflecting operational challenges. |
| Global presence | Primarily US-focused with strong regional dominance in New Jersey and surrounding areas. | Also US-focused, mainly in California; less expansive global footprint. |
| Market Share | Strong market share in local electric and gas markets, supported by consistent contract revenues over $1B. | Significant market share in California electric utility sector but more exposed to competition. |
Key takeaways: Both PEG and EIX are currently shedding value as ROIC remains below their WACC, yet both show improving profitability trends. PEG benefits from better diversification and higher net margins, while EIX faces more financial pressure but shows faster ROIC growth. Investors should monitor ongoing operational improvements and market conditions closely.
Risk Analysis
Below is a comparison of key risks for Public Service Enterprise Group Incorporated (PEG) and Edison International (EIX) based on the most recent 2024 data:
| Metric | Public Service Enterprise Group (PEG) | Edison International (EIX) |
|---|---|---|
| Market Risk | Beta 0.61, lower volatility | Beta 0.83, moderate volatility |
| Debt Level | Debt-to-Equity 1.42 (unfavorable) | Debt-to-Equity 2.43 (unfavorable, higher leverage) |
| Regulatory Risk | High, due to regulated electric sector | High, similar regulated utility environment |
| Operational Risk | Aging infrastructure (25,000 circuit miles) | Extensive but aging infrastructure (70,000+ circuit miles underground and overhead) |
| Environmental Risk | Investments in solar, but still fossil fuel exposure | Focus on clean energy but wildfire liabilities in California pose risk |
| Geopolitical Risk | Low, primarily US Northeast markets | Moderate, California-specific risks including wildfire regulations |
PEG shows slightly lower market risk but has moderate debt concerns and operational exposure to aging infrastructure. EIX carries higher debt and faces significant environmental/regulatory risks from California wildfire liabilities. Both operate in highly regulated utilities, making regulatory shifts impactful. Most critical is EIX’s elevated financial leverage and environmental liabilities, which could affect stability under adverse conditions. PEG’s Altman Z-score of 1.32 and EIX’s 0.72 both place them in distress zones, signaling caution.
In summary, EIX presents higher financial and environmental risks, while PEG shows better stability but still faces leverage and operational challenges. Investors should weigh these risks with growth and dividend prospects carefully.
Which Stock to Choose?
Public Service Enterprise Group Incorporated (PEG) shows an unfavorable income evolution with a 1-year revenue decline of -8.43% and negative net margin growth. Its financial ratios are slightly unfavorable overall, with a 21.43% favorable ratio share and a moderate B- rating. The company carries moderate debt levels and exhibits a slightly unfavorable moat due to ROIC below WACC but with a growing profitability trend.
Edison International (EIX) presents a favorable income evolution, including a 7.72% 1-year revenue increase and strong net income growth over five years. Its financial ratios are globally unfavorable with 14.29% favorable ratios, and it holds a B+ rating. EIX faces higher debt and lower interest coverage, while its moat is also slightly unfavorable, reflecting ROIC below WACC but improving profitability.
For investors prioritizing growth and income statement strength, EIX may appear more favorable given its positive revenue and earnings trends despite financial ratio challenges. Conversely, those focused on stability and moderate financial risk might find PEG’s moderate rating and improving profitability noteworthy, albeit with caution over its income contraction and leverage. Both stocks exhibit signs of value destruction but show improving returns on invested capital.
Disclaimer: Investment carries a risk of loss of initial capital. The past performance is not a reliable indicator of future results. Be sure to understand risks before making an investment decision.
Go Further
I encourage you to read the complete analyses of Public Service Enterprise Group Incorporated and Edison International to enhance your investment decisions: