Investors seeking stability and growth often turn to the regulated electric utility sector, where PPL Corporation and Edison International stand out as major players. Both companies operate in the regulated electric industry, serving millions of customers with a strong focus on innovation and sustainable energy solutions. This comparison explores their market presence, operational strategies, and growth potential to help you decide which stock could be the better addition to your investment portfolio. Let’s uncover which company offers the most compelling opportunity for your wallet.
Table of contents
Companies Overview
I will begin the comparison between PPL Corporation and Edison International by providing an overview of these two companies and their main differences.
PPL Corporation Overview
PPL Corporation is a utility holding company delivering electricity and natural gas primarily in the United States and the United Kingdom. It operates through regulated segments in Kentucky and Pennsylvania, serving over 2.6M customers. The company generates electricity from coal, gas, hydro, and solar sources, focusing on regulated electric utility markets. Founded in 1920, PPL is headquartered in Allentown, Pennsylvania.
Edison International Overview
Edison International generates and distributes electric power to 15M customers across Southern, Central, and Coastal California. It provides energy solutions to commercial and industrial users through extensive transmission and distribution infrastructure, including 39,000 circuit-miles of overhead lines and 800 substations. Established in 1886, Edison International is based in Rosemead, California, and operates in regulated electric utilities.
Key similarities and differences
Both PPL Corporation and Edison International operate in the regulated electric utility sector, focusing on electricity distribution to residential and commercial customers. However, PPL also provides natural gas services and operates in both the US and UK markets, while Edison International concentrates on electric power and energy solutions in California. Edison serves a significantly larger customer base and has a more extensive infrastructure network than PPL.
Income Statement Comparison
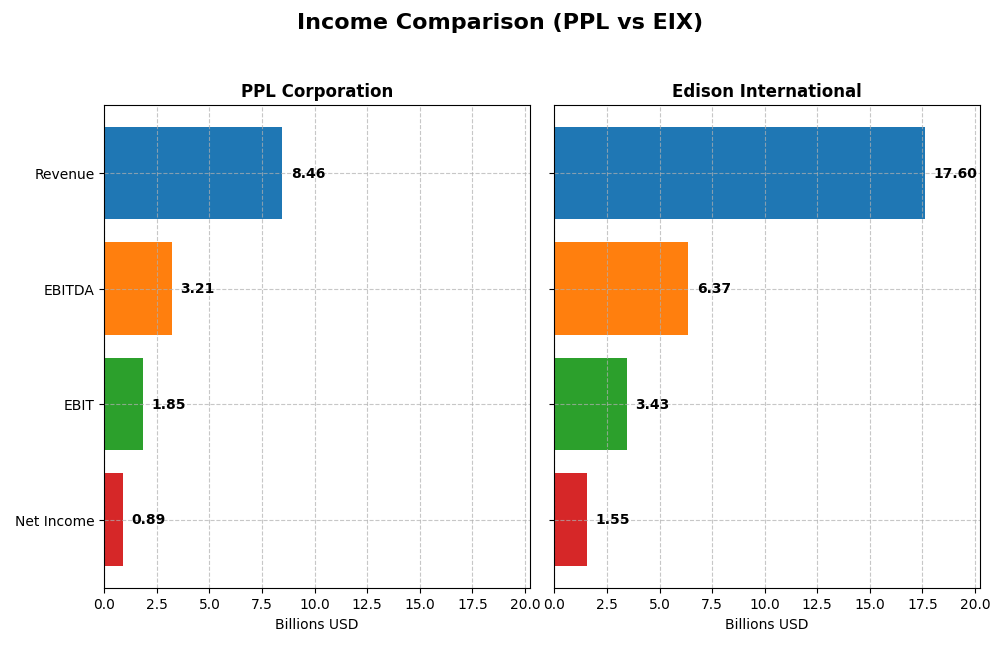
The table below presents a side-by-side comparison of key income statement metrics for PPL Corporation and Edison International for the fiscal year 2024.
| Metric | PPL Corporation | Edison International |
|---|---|---|
| Market Cap | 25.6B | 23.5B |
| Revenue | 8.46B | 17.6B |
| EBITDA | 3.21B | 6.37B |
| EBIT | 1.85B | 3.43B |
| Net Income | 888M | 1.55B |
| EPS | 1.20 | 3.33 |
| Fiscal Year | 2024 | 2024 |
Income Statement Interpretations
PPL Corporation
PPL Corporation’s revenue shows a steady increase from 5.47B in 2020 to 8.46B in 2024, though growth slowed to 1.8% in the most recent year. Net income fluctuated, dropping sharply in 2021 before recovering to 888M in 2024. Margins remain favorable, with a 40.1% gross margin and a 10.49% net margin in 2024, reflecting improved operating efficiency and profitability.
Edison International
Edison International’s revenue grew from 13.58B in 2020 to 17.60B in 2024, with a moderate 7.72% increase in the last year. Net income rose consistently, reaching 1.55B in 2024. Margins are solid, featuring a 41.01% gross margin and an 8.78% net margin, though interest expense is relatively high at 10.62%. The company showed steady improvement across profitability metrics.
Which one has the stronger fundamentals?
Edison International exhibits stronger fundamentals overall, with consistent revenue and net income growth, favorable margin expansions, and a higher percentage of positive income statement metrics. PPL shows some volatility in net income and slower recent revenue growth but maintains solid margins. Both companies have a favorable outlook, yet Edison International’s income statement growth and margin stability appear more robust.
Financial Ratios Comparison
The table below presents a side-by-side comparison of key financial ratios for PPL Corporation and Edison International based on their most recent fiscal year data for 2024.
| Ratios | PPL Corporation | Edison International |
|---|---|---|
| ROE | 6.31% | 9.93% |
| ROIC | 3.59% | 3.61% |
| P/E | 27.0 | 19.9 |
| P/B | 1.70 | 1.98 |
| Current Ratio | 0.86 | 0.85 |
| Quick Ratio | 0.71 | 0.78 |
| D/E (Debt-to-Equity) | 1.19 | 2.43 |
| Debt-to-Assets | 41% | 44% |
| Interest Coverage | 2.36 | 1.57 |
| Asset Turnover | 0.21 | 0.21 |
| Fixed Asset Turnover | 0.26 | 0.29 |
| Payout Ratio | 84.1% | 83.2% |
| Dividend Yield | 3.12% | 4.17% |
Interpretation of the Ratios
PPL Corporation
PPL Corporation’s ratios reveal mixed signals: a favorable net margin and dividend yield contrast with weak return on equity, return on invested capital, and liquidity ratios. The debt-to-equity ratio also signals caution. The company pays dividends with a 3.12% yield, but some underlying financial weaknesses may challenge sustainable payouts and buybacks.
Edison International
Edison International shows a neutral net margin and price-to-earnings ratio but weaker profitability and coverage ratios, including return on equity and interest coverage. Its debt load is comparatively higher, and liquidity ratios are below par. The dividend yield stands at 4.17%, indicating ongoing shareholder returns despite some financial pressures.
Which one has the best ratios?
Both companies exhibit an unfavorable global ratios opinion, with over half of the key ratios marked as weak. PPL has slightly more favorable metrics in margin and dividend yield, while Edison International shows stronger dividend yield but weaker debt and coverage ratios. Neither stands out decisively as having superior ratios.
Strategic Positioning
This section compares the strategic positioning of PPL Corporation and Edison International, including Market position, Key segments, and Exposure to technological disruption:
PPL Corporation
- Market position and competitive pressure: Operates in regulated electric markets in Kentucky, Pennsylvania, and the UK with moderate beta of 0.716.
- Key segments and business drivers: Revenue mainly from Kentucky Regulated (3.58B), Pennsylvania Regulated (2.88B), and Rhode Island Regulated (2.02B).
- Exposure to technological disruption: Operates coal, gas, hydro, and solar generation; no explicit disruption risk detailed.
Edison International
- Market leader in regulated electric utility in California serving 15M customers, with slightly higher beta of 0.829.
- Revenue driven primarily by Electric Utility segment (10.58B) and Competitive Power Generation (2.19B).
- Focus on transmission and distribution infrastructure; no direct mention of technological disruption exposure.
PPL Corporation vs Edison International Positioning
PPL has a more geographically diversified regulated utility portfolio across multiple states and the UK, whereas Edison International is concentrated in California with a larger customer base. PPL’s segment revenues are more balanced compared to Edison’s dominant electric utility focus.
Which has the best competitive advantage?
Both companies show slightly unfavorable moat evaluations, shedding value but with growing ROIC trends. Neither currently demonstrates a strong economic moat based on ROIC exceeding WACC, indicating limited competitive advantage from the available data.
Stock Comparison
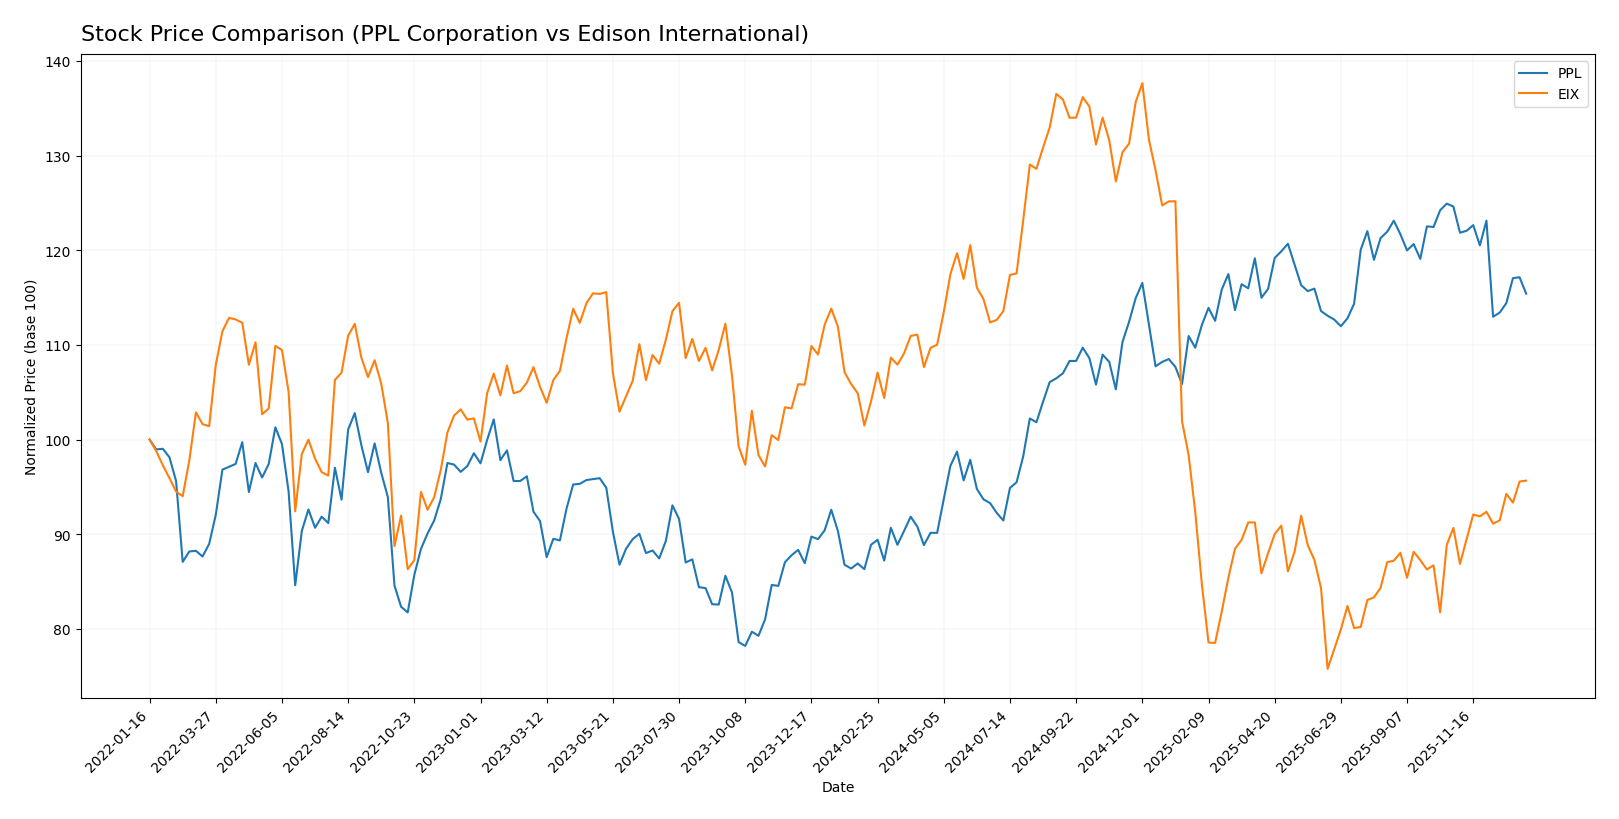
The stock price movements over the past 12 months reveal contrasting trends between PPL Corporation and Edison International, with PPL showing a strong gain despite recent weakening, while Edison International faces a prolonged decline tempered by a recent recovery phase.
Trend Analysis
PPL Corporation’s stock experienced a bullish trend over the past year, rising 29.84%, though this growth has decelerated recently with a 7.39% decline in the last quarter. The price ranged from 26.14 to 37.44, with moderate volatility (3.24 std deviation).
Edison International showed an overall bearish trend, dropping 8.02% over the year with high volatility (12.11 std deviation). However, the recent quarter saw a 5.5% gain, indicating an accelerating recovery phase from a low of 48.32 to a high of 87.75.
Comparing both, PPL delivered the highest market performance over the past year, despite recent softness, while Edison International’s overall decline was partially offset by recent positive momentum.
Target Prices
Analysts present a positive target consensus for both PPL Corporation and Edison International, signaling potential upside.
| Company | Target High | Target Low | Consensus |
|---|---|---|---|
| PPL Corporation | 45 | 36 | 41.29 |
| Edison International | 70 | 56 | 62 |
The consensus target prices for PPL and Edison International exceed their current stock prices of $34.59 and $60.99, respectively, suggesting moderate to strong upside potential according to analysts.
Analyst Opinions Comparison
This section compares analysts’ ratings and grades for PPL Corporation and Edison International:
Rating Comparison
PPL Rating
- Rating: C+, considered very favorable overall.
- Discounted Cash Flow Score: 1, indicating very unfavorable valuation outlook.
- ROE Score: 3, moderate efficiency in generating profit from equity.
- ROA Score: 3, moderate asset utilization effectiveness.
- Debt To Equity Score: 2, moderate financial risk.
- Overall Score: 2, reflecting a moderate overall financial standing.
EIX Rating
- Rating: B+, considered very favorable overall.
- Discounted Cash Flow Score: 1, indicating very unfavorable valuation outlook.
- ROE Score: 5, very favorable efficiency in profit generation.
- ROA Score: 4, favorable asset utilization effectiveness.
- Debt To Equity Score: 1, very unfavorable financial risk level.
- Overall Score: 3, reflecting a moderate overall financial standing.
Which one is the best rated?
Edison International holds a higher rating (B+) compared to PPL Corporation’s C+, with stronger ROE and ROA scores. Despite EIX’s very unfavorable debt-to-equity score, its overall score surpasses PPL’s moderate rating.
Scores Comparison
Here is a comparison of the key financial health scores for PPL Corporation and Edison International:
PPL Scores
- Altman Z-Score: 0.97, indicating distress zone, high bankruptcy risk.
- Piotroski Score: 6, reflecting average financial strength.
EIX Scores
- Altman Z-Score: 0.72, indicating distress zone, high bankruptcy risk.
- Piotroski Score: 6, reflecting average financial strength.
Which company has the best scores?
Both PPL and Edison International have Altman Z-Scores in the distress zone, signaling high bankruptcy risk, and share the same average Piotroski Score of 6. Neither company shows a clear advantage based on these scores.
Grades Comparison
Here is the comparison of recent grades and ratings from reputable grading companies for PPL Corporation and Edison International:
PPL Corporation Grades
The following table summarizes recent grade updates from major financial institutions for PPL Corporation:
| Grading Company | Action | New Grade | Date |
|---|---|---|---|
| UBS | Maintain | Neutral | 2025-12-17 |
| Wells Fargo | Maintain | Overweight | 2025-12-12 |
| JP Morgan | Maintain | Overweight | 2025-12-11 |
| BMO Capital | Maintain | Outperform | 2025-10-21 |
| B of A Securities | Maintain | Buy | 2025-10-16 |
| Barclays | Maintain | Equal Weight | 2025-10-14 |
| UBS | Maintain | Neutral | 2025-10-10 |
| Morgan Stanley | Maintain | Overweight | 2025-09-25 |
| Barclays | Maintain | Equal Weight | 2025-07-01 |
| Morgan Stanley | Maintain | Overweight | 2025-06-18 |
PPL Corporation’s grades show a consistent trend of positive ratings, mostly “Overweight,” “Buy,” and “Outperform,” indicating a broadly favorable analyst outlook.
Edison International Grades
The table below shows recent grade updates for Edison International from recognized grading companies:
| Grading Company | Action | New Grade | Date |
|---|---|---|---|
| Morgan Stanley | Maintain | Underweight | 2025-12-17 |
| JP Morgan | Maintain | Neutral | 2025-12-12 |
| UBS | Maintain | Buy | 2025-12-02 |
| Ladenburg Thalmann | Maintain | Neutral | 2025-10-30 |
| Barclays | Maintain | Overweight | 2025-10-29 |
| Jefferies | Maintain | Hold | 2025-10-22 |
| Morgan Stanley | Maintain | Underweight | 2025-10-22 |
| Barclays | Maintain | Overweight | 2025-10-21 |
| Jefferies | Downgrade | Hold | 2025-10-02 |
| JP Morgan | Maintain | Neutral | 2025-09-25 |
Edison International’s grades show a mixed pattern, with several “Neutral,” some “Overweight” and “Buy,” but also multiple “Underweight” and “Hold” ratings, reflecting a more cautious analyst stance.
Which company has the best grades?
PPL Corporation has received more consistently favorable grades, including multiple “Buy” and “Overweight” ratings, compared to Edison International’s mixed ratings with some “Underweight” actions. This divergence suggests PPL may be viewed as having stronger growth or stability potential by analysts, which could impact investor confidence differently.
Strengths and Weaknesses
Below is a comparison table highlighting the key strengths and weaknesses of PPL Corporation and Edison International based on recent financial and strategic data.
| Criterion | PPL Corporation | Edison International |
|---|---|---|
| Diversification | Primarily focused on regulated utilities in Kentucky, Pennsylvania, Rhode Island; limited geographic diversification | Focused on electric utility and power generation in US markets; less diversified by segment |
| Profitability | Net margin 10.49% (favorable); ROIC 3.59% (unfavorable); growing ROIC trend but currently shedding value | Net margin 8.78% (neutral); ROIC 3.61% (unfavorable); growing ROIC trend but also shedding value |
| Innovation | Moderate innovation focus; no strong moat but improving profitability | Moderate innovation; similar moat status to PPL, improving profitability but no excess returns |
| Global presence | Limited international exposure with past UK operations now reduced | Primarily domestic US operations; no significant international presence |
| Market Share | Strong presence in regulated markets of Kentucky and Pennsylvania | Significant market share in California electric utility sector |
Both companies exhibit strengths in regulated utility markets with improving profitability trends. However, they currently operate with returns below their capital costs, indicating value destruction despite growing efficiency. Investors should weigh these factors carefully in portfolio decisions.
Risk Analysis
The table below summarizes key risks for PPL Corporation and Edison International based on their latest 2024 financial and operational data.
| Metric | PPL Corporation | Edison International |
|---|---|---|
| Market Risk | Moderate (Beta 0.716) | Moderate (Beta 0.829) |
| Debt level | High (D/E 1.19, Neutral) | Very High (D/E 2.43, Unfavorable) |
| Regulatory Risk | Moderate (Utility sector) | Moderate (Utility sector) |
| Operational Risk | Moderate (Asset turnover low) | Moderate (Asset turnover low) |
| Environmental Risk | Elevated (Coal and gas generation) | Elevated (Large grid in California) |
| Geopolitical Risk | Low (US and UK operations) | Low (US only operations) |
Both companies face significant financial leverage risks, with Edison International carrying a very high debt-to-equity ratio, increasing financial vulnerability. Environmental risks persist due to reliance on fossil fuels and exposure to regulatory changes. Market risks are moderate given stable utility sector demand but remain sensitive to economic shifts. Operational risks are influenced by relatively low asset turnover ratios, indicating efficiency challenges. Overall, debt management and environmental regulations are the most impactful risks to monitor closely.
Which Stock to Choose?
PPL Corporation shows a mixed income evolution with favorable net and EBIT margins but uneven net income growth over five years. Its financial ratios are mostly unfavorable, with moderate profitability, elevated debt levels, and a strong dividend yield. The company’s rating is very favorable overall, despite moderate scores in key metrics.
Edison International presents a generally favorable income evolution marked by solid growth in revenue, net income, and EPS over five years. Its financial ratios are predominantly unfavorable, with moderate profitability and higher leverage than PPL. Edison holds a very favorable rating, supported by strong return on equity and assets scores.
For investors, Edison International’s stronger income growth and higher financial ratings might appeal to those seeking growth potential with moderate risk tolerance. Conversely, PPL’s stable dividend and improving profitability could be more attractive to investors favoring income and quality despite some financial ratio weaknesses.
Disclaimer: Investment carries a risk of loss of initial capital. The past performance is not a reliable indicator of future results. Be sure to understand risks before making an investment decision.
Go Further
I encourage you to read the complete analyses of PPL Corporation and Edison International to enhance your investment decisions: