Edison International (EIX) and Pinnacle West Capital Corporation (PNW) are two prominent players in the regulated electric utilities sector, each serving distinct yet overlapping markets in California and Arizona respectively. Both companies emphasize innovation in energy generation and distribution, balancing traditional methods with renewable investments. This comparison will help investors understand which company offers the most compelling opportunity in today’s evolving energy landscape. Let’s explore which utility stands out for your portfolio.
Table of contents
Companies Overview
I will begin the comparison between Edison International and Pinnacle West Capital Corporation by providing an overview of these two companies and their main differences.
Edison International Overview
Edison International, headquartered in Rosemead, California, operates in the regulated electric industry. Founded in 1886, it generates and distributes electric power to 15 million customers across Southern, Central, and Coastal California. The company manages extensive transmission and distribution systems and offers energy solutions to commercial and industrial users, positioning itself as a major utility provider in its region.
Pinnacle West Capital Corporation Overview
Pinnacle West Capital Corporation, based in Phoenix, Arizona, serves primarily Arizona through its subsidiary Arizona Public Service Company. Incorporated in 1985, it provides retail and wholesale electric services, generating power from coal, nuclear, gas, oil, and solar sources. The company maintains a sizable transmission and distribution network and owns 6,323 MW of regulated generation capacity, serving approximately 1.3 million customers.
Key similarities and differences
Both companies operate in the regulated electric utilities sector with a focus on electricity generation, transmission, and distribution. Edison International serves a larger customer base (15M vs. 1.3M) and operates in California, while Pinnacle West is concentrated in Arizona. Pinnacle West uses a more diversified energy mix, including nuclear and solar, whereas Edison emphasizes extensive infrastructure. Employee counts and market caps also differ significantly, reflecting their scale and regional focus.
Income Statement Comparison
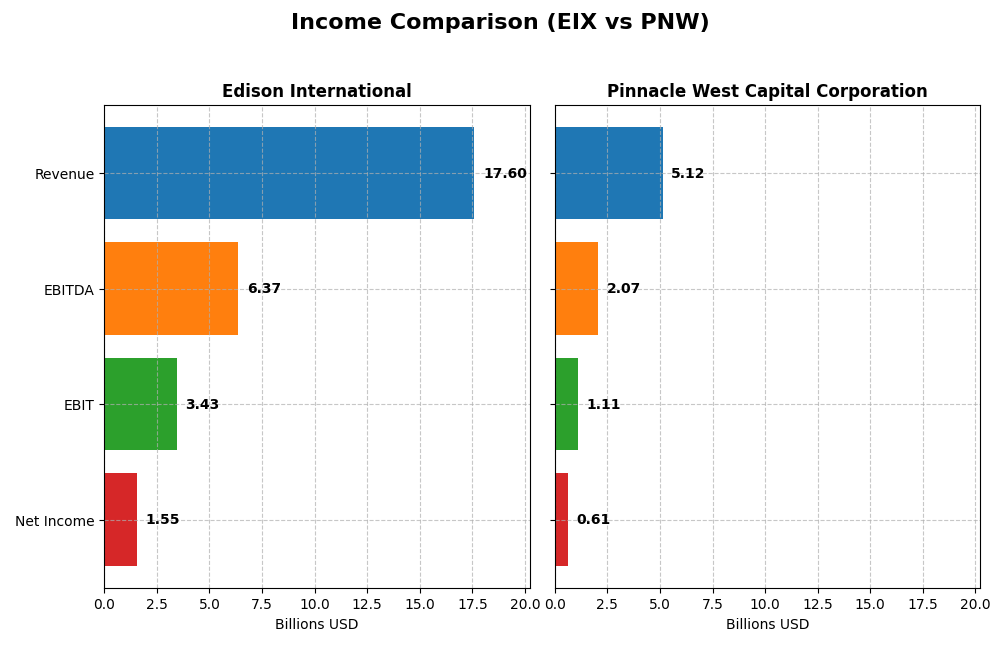
The table below presents a side-by-side comparison of key income statement metrics for Edison International and Pinnacle West Capital Corporation for the fiscal year 2024.
| Metric | Edison International | Pinnacle West Capital Corporation |
|---|---|---|
| Market Cap | 23.5B | 10.7B |
| Revenue | 17.6B | 5.1B |
| EBITDA | 6.4B | 2.1B |
| EBIT | 3.4B | 1.1B |
| Net Income | 1.55B | 609M |
| EPS | 3.33 | 5.35 |
| Fiscal Year | 2024 | 2024 |
Income Statement Interpretations
Edison International
Edison International’s revenue rose steadily from 13.6B in 2020 to 17.6B in 2024, with net income increasing notably from 739M to 1.28B. Gross and EBIT margins improved, reaching 41.01% and 19.5% respectively in 2024. The latest year showed moderate revenue growth of 7.7%, with favorable margin expansion and a 6.4% EPS increase, indicating solid operational progress.
Pinnacle West Capital Corporation
Pinnacle West’s revenue climbed from 3.59B in 2020 to 5.12B in 2024, with net income rising from 551M to 609M. Gross margin remained favorable at 41.7%, while EBIT margin was higher than Edison’s at 21.74%. The 2024 fiscal year reflected strong revenue growth of 9.1%, a significant 18.8% EPS rise, but operating expenses grew faster than revenue, slightly pressuring margins.
Which one has the stronger fundamentals?
Both companies show favorable income statement trends, with Edison International posting stronger net income growth (77.5%) and margin improvements over five years. Pinnacle West exhibits better EBIT margin and EPS growth in the latest year but faces unfavorable net margin erosion over the period. Edison’s overall margin stability and higher net income growth suggest more robust fundamentals based on income metrics.
Financial Ratios Comparison
The table below presents key financial ratios for Edison International and Pinnacle West Capital Corporation based on their latest full-year data from 2024.
| Ratios | Edison International (EIX) | Pinnacle West Capital Corporation (PNW) |
|---|---|---|
| ROE | 9.93% | 9.01% |
| ROIC | 3.61% | 3.48% |
| P/E | 19.93 | 15.85 |
| P/B | 1.98 | 1.43 |
| Current Ratio | 0.85 | 0.59 |
| Quick Ratio | 0.78 | 0.42 |
| D/E (Debt-to-Equity) | 2.43 | 1.64 |
| Debt-to-Assets | 44.12% | 42.33% |
| Interest Coverage | 1.57 | 2.68 |
| Asset Turnover | 0.21 | 0.20 |
| Fixed Asset Turnover | 0.29 | 0.25 |
| Payout Ratio | 83.18% | 64.83% |
| Dividend Yield | 4.17% | 4.09% |
Interpretation of the Ratios
Edison International
Edison International shows several unfavorable financial ratios, including return on equity (9.93%) and return on invested capital (3.61%), alongside weak liquidity measures like a current ratio of 0.85. The company’s dividend yield is favorable at 4.17%, indicating a strong income return, but the overall ratio profile is predominantly negative. The dividend appears supported but caution is warranted due to coverage concerns.
Pinnacle West Capital Corporation
Pinnacle West exhibits a more favorable net margin (11.88%) and a lower price-to-book ratio (1.43), yet it shares some weaknesses with Edison, such as an unfavorable return on equity (9.01%) and liquidity ratios below 1. The dividend yield is also attractive at 4.09%, reflecting consistent shareholder returns. The ratio analysis suggests moderate financial stability with some risks in leverage and liquidity.
Which one has the best ratios?
Pinnacle West Capital’s ratios are generally stronger, with a higher proportion of favorable metrics (28.57%) compared to Edison International (14.29%). Both companies face challenges in liquidity and returns, but Pinnacle West’s better net margin and valuation metrics offer a comparatively less unfavorable profile. Neither company excels, but Pinnacle West holds a slight edge in financial ratio quality.
Strategic Positioning
This section compares the strategic positioning of Edison International and Pinnacle West Capital Corporation, including market position, key segments, and exposure to technological disruption:
Edison International
- Leading electric utility in California with broad customer base facing regulated industry competition.
- Diverse revenue from electric utility and competitive power generation segments driving business.
- Traditional regulated electric utility with no explicit exposure to disruptive technologies stated.
Pinnacle West Capital Corporation
- Regulated electric provider focused on Arizona with smaller market and moderate competitive pressure.
- Revenue mainly from electric service, transmission, and wholesale energy segments.
- Uses coal, nuclear, gas, oil, and solar but no direct mention of disruption exposure.
Edison International vs Pinnacle West Capital Corporation Positioning
Edison International shows a more diversified business model with larger scale and broader customer base, while Pinnacle West Capital is more concentrated geographically and segment-wise, with fewer employees and smaller market capitalization.
Which has the best competitive advantage?
Both companies are shedding value as ROIC is below WACC; Edison’s profitability is improving, whereas Pinnacle West’s profitability is declining, indicating a slightly more favorable moat for Edison International.
Stock Comparison
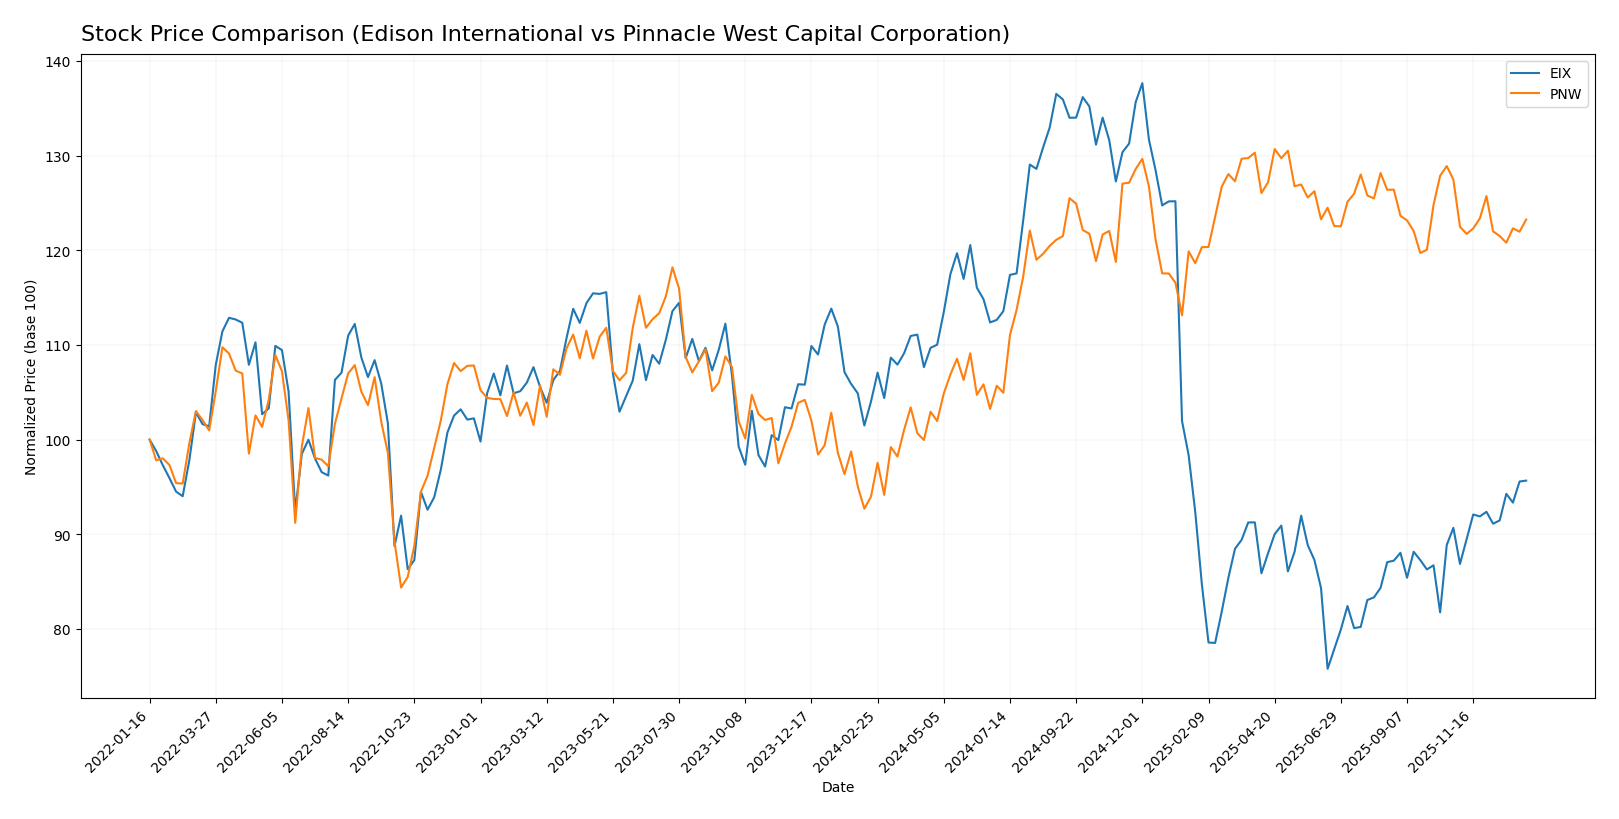
The stock price movements of Edison International (EIX) and Pinnacle West Capital Corporation (PNW) over the past 12 months reveal contrasting trends and trading behaviors, highlighting shifts in market sentiment and momentum.
Trend Analysis
Edison International experienced a bearish trend over the past year with an 8.02% decline in price, showing acceleration in the downward movement and significant volatility with a 12.11 standard deviation. The stock ranged between 48.32 and 87.75.
Pinnacle West Capital Corporation displayed a bullish trend with a 31.14% price increase over the same period, though this momentum decelerated. Its price fluctuated between 67.92 and 94.45 with moderate volatility at a 6.87 standard deviation.
Comparing both stocks, Pinnacle West Capital Corporation outperformed Edison International with a strong positive return, while Edison International showed a negative trend despite recent short-term gains.
Target Prices
Analysts provide a clear consensus on target prices for Edison International and Pinnacle West Capital Corporation.
| Company | Target High | Target Low | Consensus |
|---|---|---|---|
| Edison International | 70 | 56 | 62 |
| Pinnacle West Capital Corporation | 115 | 85 | 96.33 |
The target consensus for Edison International at 62 USD is slightly above its current price of 60.99 USD, indicating moderate upside potential. Pinnacle West’s consensus target of 96.33 USD suggests a notable upside from its current 89.07 USD share price, reflecting positive analyst expectations.
Analyst Opinions Comparison
This section compares analysts’ ratings and key financial scores for Edison International and Pinnacle West Capital Corporation:
Rating Comparison
Edison International Rating
- Rating: B+, considered very favorable overall.
- Discounted Cash Flow Score: 1, very unfavorable, indicating concerns about valuation.
- ROE Score: 5, very favorable, showing strong profit generation from equity.
- ROA Score: 4, favorable, reflecting effective asset utilization.
- Debt To Equity Score: 1, very unfavorable, signaling higher financial risk.
- Overall Score: 3, moderate, summarizing a balanced financial standing.
Pinnacle West Capital Corporation Rating
- Rating: C+, considered very favorable overall.
- Discounted Cash Flow Score: 1, very unfavorable, indicating concerns about valuation.
- ROE Score: 3, moderate, indicating average efficiency in profit generation.
- ROA Score: 3, moderate, reflecting average asset utilization.
- Debt To Equity Score: 1, very unfavorable, signaling higher financial risk.
- Overall Score: 2, moderate, summarizing a somewhat weaker financial standing.
Which one is the best rated?
Edison International holds a higher overall rating (B+ vs. C+) and stronger ROE and ROA scores, while both companies share very unfavorable discounted cash flow and debt-to-equity scores. Edison thus is better rated based strictly on provided data.
Scores Comparison
Here is the comparison of the Altman Z-Score and Piotroski Score for Edison International and Pinnacle West Capital Corporation:
Edison International Scores
- Altman Z-Score: 0.72, indicating financial distress and high bankruptcy risk.
- Piotroski Score: 6, reflecting average financial strength and investment quality.
Pinnacle West Capital Scores
- Altman Z-Score: 0.73, indicating financial distress and high bankruptcy risk.
- Piotroski Score: 4, reflecting average financial strength and lower investment quality.
Which company has the best scores?
Edison International shows a slightly lower Altman Z-Score but a higher Piotroski Score than Pinnacle West Capital, indicating relatively stronger financial health based on the provided data.
Grades Comparison
Here is the comparison of recent grades assigned to Edison International and Pinnacle West Capital Corporation:
Edison International Grades
The table below summarizes recent grades from major financial institutions for Edison International:
| Grading Company | Action | New Grade | Date |
|---|---|---|---|
| Morgan Stanley | Maintain | Underweight | 2025-12-17 |
| JP Morgan | Maintain | Neutral | 2025-12-12 |
| UBS | Maintain | Buy | 2025-12-02 |
| Ladenburg Thalmann | Maintain | Neutral | 2025-10-30 |
| Barclays | Maintain | Overweight | 2025-10-29 |
| Jefferies | Maintain | Hold | 2025-10-22 |
| Morgan Stanley | Maintain | Underweight | 2025-10-22 |
| Barclays | Maintain | Overweight | 2025-10-21 |
| Jefferies | Downgrade | Hold | 2025-10-02 |
| JP Morgan | Maintain | Neutral | 2025-09-25 |
Edison International’s grades show a mixed pattern with buy, hold, neutral, overweight, and underweight ratings, indicating cautious sentiment among analysts.
Pinnacle West Capital Corporation Grades
The table below summarizes recent grades from major financial institutions for Pinnacle West Capital Corporation:
| Grading Company | Action | New Grade | Date |
|---|---|---|---|
| UBS | Maintain | Neutral | 2025-12-17 |
| Keybanc | Downgrade | Sector Weight | 2025-12-12 |
| Keybanc | Maintain | Overweight | 2025-10-15 |
| UBS | Maintain | Neutral | 2025-10-10 |
| Barclays | Maintain | Equal Weight | 2025-10-07 |
| Argus Research | Maintain | Buy | 2025-09-30 |
| Morgan Stanley | Maintain | Equal Weight | 2025-09-25 |
| UBS | Maintain | Neutral | 2025-09-12 |
| Mizuho | Downgrade | Neutral | 2025-09-09 |
| Barclays | Maintain | Equal Weight | 2025-08-13 |
Pinnacle West Capital Corporation’s grades predominantly cluster around neutral and equal weight, with occasional buy and overweight ratings, reflecting moderate analyst confidence.
Which company has the best grades?
Edison International generally receives more positive grades, including multiple buy and overweight ratings, compared to Pinnacle West Capital Corporation’s predominantly neutral and equal weight assessments. This suggests Edison may attract more favorable investor sentiment, potentially impacting portfolio decisions regarding growth and risk appetite.
Strengths and Weaknesses
Below is a comparison table outlining the key strengths and weaknesses of Edison International (EIX) and Pinnacle West Capital Corporation (PNW) based on the most recent financial and operational data.
| Criterion | Edison International (EIX) | Pinnacle West Capital Corporation (PNW) |
|---|---|---|
| Diversification | Moderate diversification: Electric Utility dominant (~$10.6B in 2011) with Competitive Power Generation segment | Less diversified, primarily focused on Electric Service (~$2.56B in 2024) with smaller transmission and wholesale segments |
| Profitability | ROIC 3.61% (unfavorable), net margin 8.78% (neutral), growing ROIC trend but currently shedding value | ROIC 3.48% (unfavorable), net margin 11.88% (favorable), declining ROIC trend, shedding value with decreasing profitability |
| Innovation | Limited data on innovation; moderate asset turnover (0.21), weak fixed asset turnover (0.29) | Similar weak asset turnover (0.20) and fixed asset turnover (0.25), indicating room for operational improvements |
| Global presence | Primarily US-focused electric utility, limited international exposure | Also US-focused with no significant global operations noted |
| Market Share | Large scale in electric utility segment, significant revenue base | Smaller scale but growing revenue in electric services segment |
Key takeaways: Edison International shows signs of improving profitability despite currently destroying value, while Pinnacle West struggles with declining profitability and value destruction. Both companies have limited diversification and similar operational efficiency challenges. Caution advised with focus on monitoring ROIC trends and profitability improvements.
Risk Analysis
Below is a comparative risk table for Edison International (EIX) and Pinnacle West Capital Corporation (PNW) based on the most recent data from 2024-2026.
| Metric | Edison International (EIX) | Pinnacle West Capital Corporation (PNW) |
|---|---|---|
| Market Risk | Beta 0.83, moderate volatility | Beta 0.54, lower volatility |
| Debt level | High debt/equity ratio 2.43, unfavorable | Elevated debt/equity 1.64, unfavorable |
| Regulatory Risk | High, due to California energy policies | High, subject to Arizona regulatory changes |
| Operational Risk | Large infrastructure, aging assets risk | Moderate infrastructure, diverse energy mix |
| Environmental Risk | High, California wildfire liabilities | Moderate, mix of coal, nuclear, gas, solar |
| Geopolitical Risk | Low, primarily regional US operations | Low, regional US focus |
Edison International faces significant risks from high debt levels and regulatory pressures linked to California’s stringent energy policies and wildfire liabilities. Pinnacle West, while also carrying notable debt, has a more diversified energy portfolio and lower market volatility, but still faces regulatory and environmental challenges. Both companies are in financial distress zones per Altman Z-Scores, indicating caution.
Which Stock to Choose?
Edison International (EIX) shows favorable income growth with a 29.61% revenue increase over five years and a solid gross margin of 41.01%. However, its financial ratios reveal several unfavorable aspects, including a high debt-to-equity ratio of 2.43 and weak liquidity ratios, while its profitability is moderate, reflected in a 9.93% ROE. The company’s rating is very favorable (B+), but it faces a slightly unfavorable moat due to ROIC below WACC despite improving profitability.
Pinnacle West Capital Corporation (PNW) reports stronger income growth at 42.88% over five years and a slightly higher gross margin of 41.7%. Its financial ratios are somewhat better, with a lower debt-to-equity ratio of 1.64 and favorable net margin of 11.88%, though ROE is slightly lower at 9.01%. The rating is slightly less positive (C+), and its moat is very unfavorable, with ROIC below WACC and a declining trend.
For investors prioritizing growth and improving profitability, Edison International might appear more favorable given its positive income trend and improving returns despite higher leverage. Conversely, risk-tolerant investors focusing on margin strength and recent income growth could view Pinnacle West as attractive, though its declining moat suggests caution. Overall, the choice could depend on the investor’s risk tolerance and preference for stability versus growth potential.
Disclaimer: Investment carries a risk of loss of initial capital. The past performance is not a reliable indicator of future results. Be sure to understand risks before making an investment decision.
Go Further
I encourage you to read the complete analyses of Edison International and Pinnacle West Capital Corporation to enhance your investment decisions: