Pacific Gas & Electric Co. (PCG) and Edison International (EIX) are two leading players in the regulated electric utility sector, serving millions of customers across California. Both companies emphasize innovation in energy distribution and sustainability while managing extensive infrastructure assets. Their overlapping markets and commitment to clean energy make them a compelling comparison. In this article, I will analyze and reveal which company presents the most promising opportunity for investors in 2026.

Table of contents
Companies Overview
I will begin the comparison between Pacific Gas & Electric Co. and Edison International by providing an overview of these two companies and their main differences.
Pacific Gas & Electric Co. Overview
Pacific Gas & Electric Co. operates in the regulated electric industry, generating, transmitting, distributing, and selling electricity and natural gas in northern and central California. The company uses diverse energy sources, including nuclear, hydroelectric, fossil fuels, and photovoltaic systems. It also develops innovative microgrid backup power transfer meters integrated with its SmartMeter system, serving a broad customer base including residential, commercial, industrial, and agricultural sectors.
Edison International Overview
Edison International generates and distributes electric power to 15 million customers across Southern, Central, and Coastal California. The company manages extensive transmission and distribution infrastructure, including thousands of circuit-miles of overhead and underground lines and hundreds of substations. It offers energy solutions primarily to residential, commercial, industrial, public authorities, and agricultural users, emphasizing reliable power delivery throughout its service regions.
Key similarities and differences
Both Pacific Gas & Electric and Edison International operate in the regulated electric sector in California, serving diverse customer segments with electricity generation and distribution. Pacific Gas & Electric covers northern and central regions with a mix of energy sources, while Edison International focuses on Southern and coastal areas with large-scale transmission and distribution networks. The companies differ in scale, employee count, and specific technological innovations but share a core mission to provide regulated electric utility services.
Income Statement Comparison
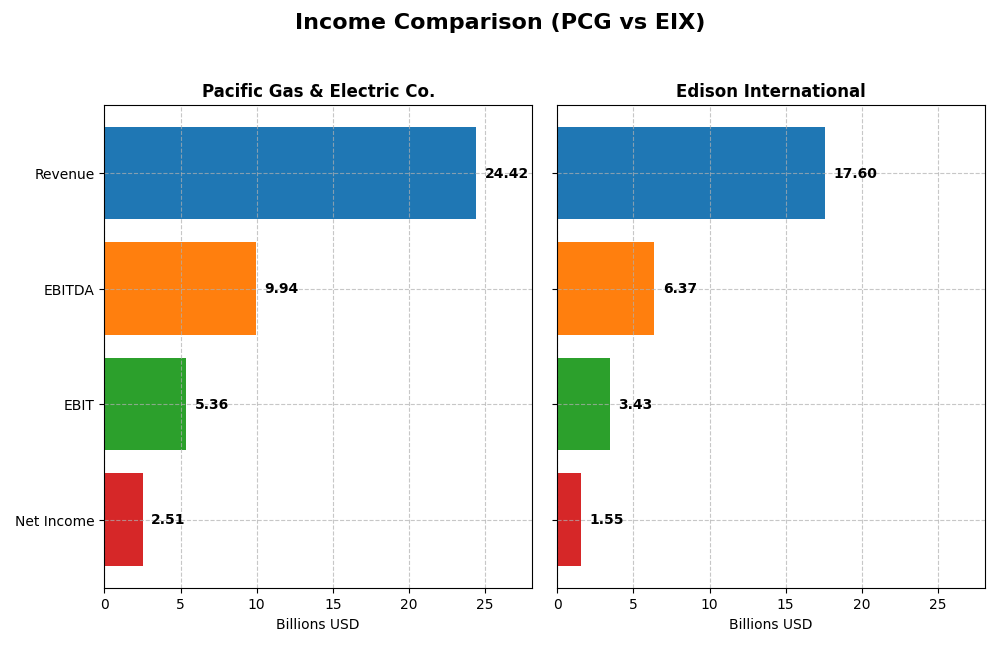
The table below presents a side-by-side comparison of key income statement metrics for Pacific Gas & Electric Co. and Edison International for the fiscal year 2024.
| Metric | Pacific Gas & Electric Co. (PCG) | Edison International (EIX) |
|---|---|---|
| Market Cap | 34.8B | 23.5B |
| Revenue | 24.4B | 17.6B |
| EBITDA | 9.94B | 6.37B |
| EBIT | 5.36B | 3.43B |
| Net Income | 2.51B | 1.55B |
| EPS | 1.16 | 3.33 |
| Fiscal Year | 2024 | 2024 |
Income Statement Interpretations
Pacific Gas & Electric Co.
From 2020 to 2024, Pacific Gas & Electric Co. (PCG) showed a strong revenue growth of 32.22%, with net income surging by 292.64%. Gross and EBIT margins remained favorable at 37.5% and 21.96%, respectively. Despite a slight revenue decline of 0.04% in 2024, PCG improved its gross profit by 128.84% and EBIT by 51.11%, reflecting enhanced operational efficiency and margin expansion.
Edison International
Edison International (EIX) experienced steady revenue growth of 29.61% over 2020-2024, with net income rising 77.5%. Its gross margin was higher than PCG’s at 41.01%, while the EBIT margin stood at 19.5%. In 2024, revenue increased by 7.72%, and gross profit grew 7.51%, supporting stable margins. Net margin growth was modest at 2.01%, indicating consistent but less dynamic profitability improvements.
Which one has the stronger fundamentals?
Both companies exhibit favorable income statement fundamentals, with PCG showing superior net income and margin growth over the period, despite a 2024 revenue dip. Edison International maintains stronger gross margins and steady revenue gains, with less volatility. PCG’s higher interest expense ratio is unfavorable, while EIX’s margin stability and consistent growth suggest balanced fundamentals.
Financial Ratios Comparison
Below is a comparison of key financial ratios for Pacific Gas & Electric Co. (PCG) and Edison International (EIX) based on their most recent fiscal year data for 2024.
| Ratios | Pacific Gas & Electric Co. (PCG) | Edison International (EIX) |
|---|---|---|
| ROE | 8.33% | 9.93% |
| ROIC | 3.98% | 3.61% |
| P/E | 17.20 | 19.93 |
| P/B | 1.43 | 1.98 |
| Current Ratio | 1.05 | 0.85 |
| Quick Ratio | 1.00 | 0.78 |
| D/E (Debt-to-Equity) | 1.94 | 2.43 |
| Debt-to-Assets | 43.7% | 44.1% |
| Interest Coverage | 1.46 | 1.57 |
| Asset Turnover | 0.18 | 0.21 |
| Fixed Asset Turnover | 0.28 | 0.29 |
| Payout ratio | 3.42% | 83.18% |
| Dividend yield | 0.20% | 4.17% |
Interpretation of the Ratios
Pacific Gas & Electric Co.
Pacific Gas & Electric shows a mixed ratio profile with a favorable net margin of 10.29% but unfavorable returns on equity (8.33%) and invested capital (3.98%). Its leverage is high with a debt-to-equity ratio of 1.94 and weak interest coverage at 1.76. The dividend yield is low at 0.2%, reflecting a cautious payout amid financial pressures.
Edison International
Edison International displays mostly unfavorable ratios, including a low net margin of 8.78%, weak returns on equity (9.93%) and invested capital (3.61%), and poor liquidity indicated by sub-1 current and quick ratios. Its debt-to-equity ratio is elevated at 2.43. However, the dividend yield is strong at 4.17%, supported by a consistent payout.
Which one has the best ratios?
Neither company stands out as having an overall strong ratio profile; Pacific Gas & Electric’s ratios are slightly less unfavorable, with some neutral and favorable metrics, whereas Edison International’s ratios skew more negatively, especially liquidity. Both face challenges in returns and leverage, but Edison’s higher dividend yield contrasts with its weaker financial flexibility.
Strategic Positioning
This section compares the strategic positioning of Pacific Gas & Electric Co. (PCG) and Edison International (EIX), focusing on Market position, Key segments, and Exposure to technological disruption:
Pacific Gas & Electric Co.
- Large market cap of 34.8B in regulated electric sector with moderate competitive pressure.
- Revenue driven by electricity (18.6B) and natural gas (6.6B) segments serving diverse customer types.
- Developing microgrid backup power integrated with SmartMeter system, indicating some exposure to tech innovation.
Edison International
- Smaller market cap at 23.5B in regulated electric sector facing similar competitive dynamics.
- Focused on electric utility segment delivering power to 15M customers, plus competitive power generation.
- Transmission and distribution infrastructure extensive, but no explicit advanced tech disruption mentioned.
PCG vs EIX Positioning
PCG shows a more diversified business model with significant natural gas and electricity segments, while EIX concentrates mainly on electric utility and power generation. PCG’s tech innovation in backup power contrasts with EIX’s focus on infrastructure scale. Both face regulated electric sector pressures.
Which has the best competitive advantage?
Both PCG and EIX exhibit slightly unfavorable MOATs due to ROIC below WACC, though with growing profitability trends. PCG’s smaller negative gap suggests a marginally stronger competitive advantage compared to EIX’s larger value destruction.
Stock Comparison
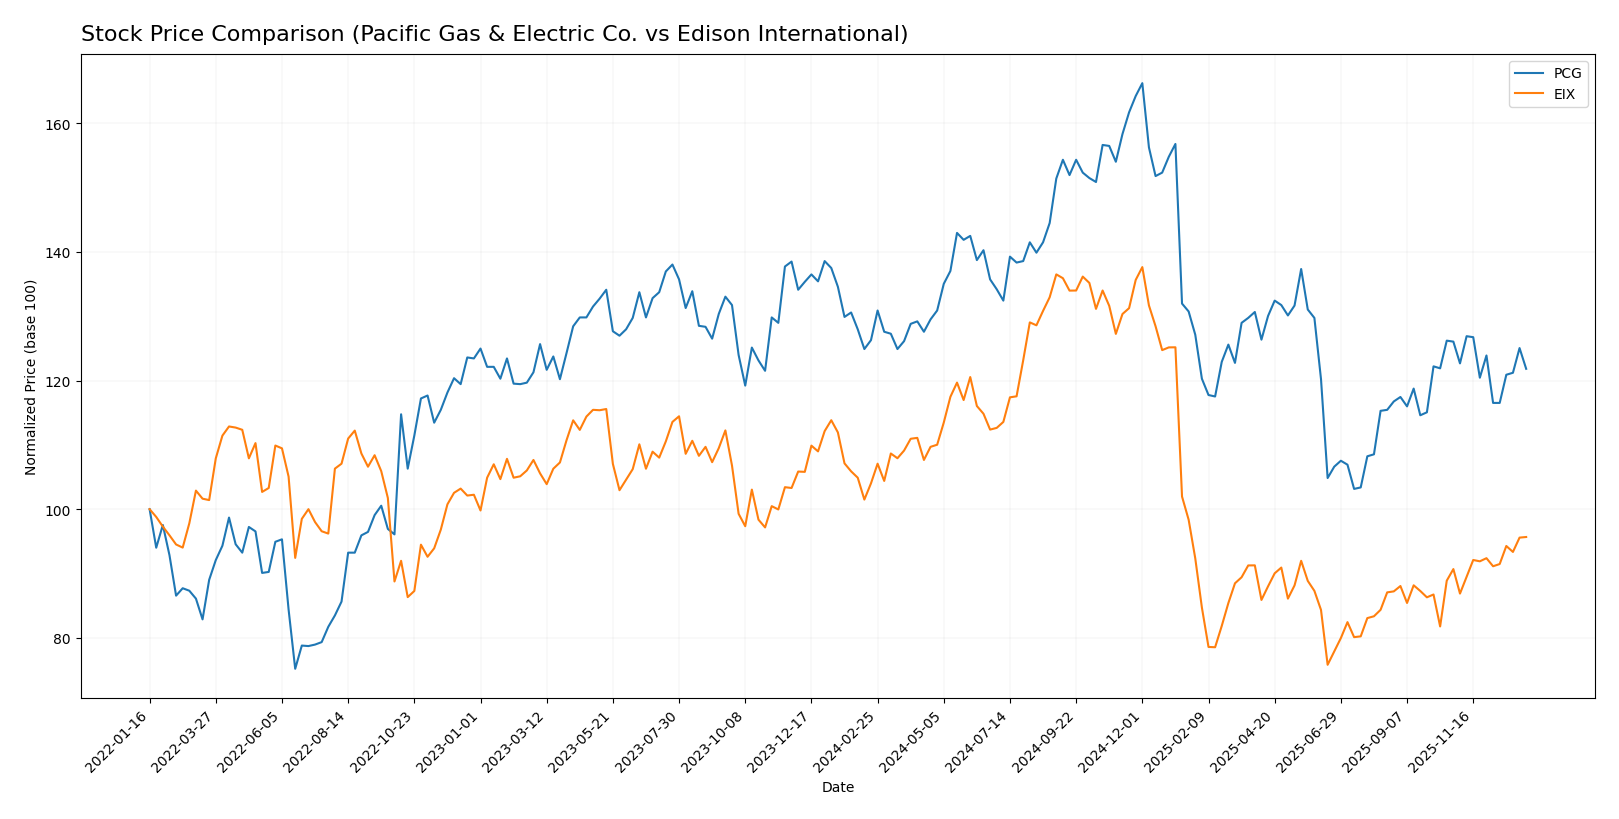
The stock prices of Pacific Gas & Electric Co. and Edison International over the past year reveal contrasting dynamics, with both companies experiencing bearish trends overall but differing in recent momentum and volatility.
Trend Analysis
Pacific Gas & Electric Co. (PCG) shows a bearish trend over the past 12 months with a price decline of 3.53%, accompanied by deceleration and low volatility (std deviation 1.93). The stock peaked at 21.63 and bottomed at 13.42.
Edison International (EIX) also exhibits a bearish trend with an 8.02% price drop over the year, yet its trend is accelerating amid higher volatility (std deviation 12.11). The stock’s recent 12-week period shows a bullish reversal with a 5.5% gain.
Comparing the two, Edison International delivered the lowest market performance over the year but showed stronger recent recovery, while Pacific Gas & Electric Co. had a milder overall decline and decelerating bearish pressure.
Target Prices
The current analyst consensus presents a cautiously optimistic outlook for these utilities stocks.
| Company | Target High | Target Low | Consensus |
|---|---|---|---|
| Pacific Gas & Electric Co. | 25 | 18 | 21.5 |
| Edison International | 70 | 56 | 62 |
Analysts expect Pacific Gas & Electric Co. to appreciate from its current price of $15.85 to a consensus of $21.5, while Edison International’s $60.99 stock price is close to its $62 consensus target, signaling moderate upside potential.
Analyst Opinions Comparison
This section compares analysts’ ratings and grades for Pacific Gas & Electric Co. (PCG) and Edison International (EIX):
Rating Comparison
PCG Rating
- Rating: B-, considered very favorable by analysts.
- Discounted Cash Flow Score: 1, rated very unfavorable.
- ROE Score: 3, moderate efficiency in generating equity profit.
- ROA Score: 3, moderate effectiveness in asset utilization.
- Debt To Equity Score: 1, very unfavorable financial risk.
- Overall Score: 3, moderate overall financial standing.
EIX Rating
- Rating: B+, considered very favorable by analysts.
- Discounted Cash Flow Score: 1, rated very unfavorable.
- ROE Score: 5, very favorable efficiency in generating equity profit.
- ROA Score: 4, favorable effectiveness in asset utilization.
- Debt To Equity Score: 1, very unfavorable financial risk.
- Overall Score: 3, moderate overall financial standing.
Which one is the best rated?
EIX holds a higher rating (B+) compared to PCG’s B-, with stronger ROE and ROA scores, indicating better profitability and asset use, while both share similar unfavorable debt-to-equity and DCF scores. Overall scores are equal.
Scores Comparison
Here is a comparison of the Altman Z-Score and Piotroski Score for the two companies:
PCG Scores
- Altman Z-Score: 0.48, indicating financial distress zone.
- Piotroski Score: 5, reflecting average financial strength.
EIX Scores
- Altman Z-Score: 0.72, also indicating financial distress zone.
- Piotroski Score: 6, reflecting average financial strength.
Which company has the best scores?
Both PCG and EIX are in the Altman Z-Score distress zone, indicating high bankruptcy risk. EIX has a slightly higher Piotroski Score (6) compared to PCG’s 5, suggesting marginally stronger financial health.
Grades Comparison
Here is the grades comparison for Pacific Gas & Electric Co. and Edison International by reputable grading firms:
Pacific Gas & Electric Co. Grades
The following table summarizes recent grades assigned to Pacific Gas & Electric Co. by major financial institutions.
| Grading Company | Action | New Grade | Date |
|---|---|---|---|
| JP Morgan | Maintain | Overweight | 2025-12-12 |
| UBS | Maintain | Neutral | 2025-10-24 |
| Jefferies | Maintain | Buy | 2025-10-22 |
| BMO Capital | Maintain | Outperform | 2025-10-14 |
| Jefferies | Maintain | Buy | 2025-10-03 |
| Barclays | Maintain | Overweight | 2025-10-01 |
| Morgan Stanley | Maintain | Equal Weight | 2025-09-25 |
| Morgan Stanley | Upgrade | Equal Weight | 2025-09-18 |
| UBS | Maintain | Neutral | 2025-09-18 |
| Barclays | Maintain | Overweight | 2025-07-22 |
Pacific Gas & Electric Co. shows a generally positive trend with several “Buy,” “Outperform,” and “Overweight” ratings, alongside stable maintenance actions and one upgrade.
Edison International Grades
Below is a table of Edison International’s grades from recognized rating agencies.
| Grading Company | Action | New Grade | Date |
|---|---|---|---|
| Morgan Stanley | Maintain | Underweight | 2025-12-17 |
| JP Morgan | Maintain | Neutral | 2025-12-12 |
| UBS | Maintain | Buy | 2025-12-02 |
| Ladenburg Thalmann | Maintain | Neutral | 2025-10-30 |
| Barclays | Maintain | Overweight | 2025-10-29 |
| Jefferies | Maintain | Hold | 2025-10-22 |
| Morgan Stanley | Maintain | Underweight | 2025-10-22 |
| Barclays | Maintain | Overweight | 2025-10-21 |
| Jefferies | Downgrade | Hold | 2025-10-02 |
| JP Morgan | Maintain | Neutral | 2025-09-25 |
Edison International displays a mixed range of ratings from “Buy” to “Underweight,” with more frequent maintenance actions and one downgrade, indicating varied analyst perspectives.
Which company has the best grades?
Pacific Gas & Electric Co. generally receives stronger and more consistent positive grades, such as multiple “Buy” and “Outperform” ratings, compared to Edison International’s more mixed and cautious ratings. This may influence investors by highlighting PCG’s more favorable analyst sentiment.
Strengths and Weaknesses
The table below summarizes the key strengths and weaknesses of Pacific Gas & Electric Co. (PCG) and Edison International (EIX) based on their recent financial and strategic data:
| Criterion | Pacific Gas & Electric Co. (PCG) | Edison International (EIX) |
|---|---|---|
| Diversification | Moderate: Revenue split between Electricity (18.6B) and Natural Gas (6.6B) | Limited: Mainly Electric Utility (~10.6B), small Competitive Power segment |
| Profitability | Moderate net margin (10.3%), unfavorable ROIC (3.98%) | Lower net margin (8.8%), unfavorable ROIC (3.61%) |
| Innovation | Growing ROIC trend (+26.7%) suggests improving efficiency | Stronger ROIC growth (+86.0%) but still value destroying |
| Global presence | Primarily US-regulated markets | Primarily US-regulated, with competitive power in US |
| Market Share | Large regional utility with stable electricity customer base | Strong regional utility with competitive power assets |
Key takeaways: Both PCG and EIX are value-destroying currently but show improving profitability trends. PCG benefits from better diversification between electricity and natural gas, while EIX’s competitive power segment offers growth potential. Investors should weigh improving returns against ongoing profitability challenges.
Risk Analysis
Below is a risk comparison table for Pacific Gas & Electric Co. (PCG) and Edison International (EIX) based on the most recent data from 2024.
| Metric | Pacific Gas & Electric Co. (PCG) | Edison International (EIX) |
|---|---|---|
| Market Risk | Low beta (0.38) indicates lower volatility versus market | Moderate beta (0.83) indicates moderate market volatility |
| Debt Level | High debt-to-equity (1.94), interest coverage low (1.76) | Higher debt-to-equity (2.43), interest coverage low (1.84) |
| Regulatory Risk | High, due to CA wildfire liabilities and strict regulations | High, California regulatory environment impacts operations |
| Operational Risk | Moderate, aging infrastructure but innovation in smart meters | Moderate, large transmission network with maintenance challenges |
| Environmental Risk | Significant, wildfire risk and fossil fuel usage under scrutiny | Significant, exposure to environmental regulations and climate policies |
| Geopolitical Risk | Low, US domestic operations only | Low, US domestic operations only |
Synthesis: Both PCG and EIX face significant regulatory and environmental risks inherent to California’s utility sector, with wildfire liabilities heavily impacting PCG. Debt levels and low interest coverage ratios signal financial risk, especially for PCG. Market volatility is relatively contained for PCG but more pronounced for EIX. These risks require cautious portfolio weighting and active monitoring.
Which Stock to Choose?
Pacific Gas & Electric Co. (PCG) shows a favorable income statement with strong growth in net income and margins over 2020-2024, despite a slight revenue decline last year. Its financial ratios reveal mixed signals: favorable net margin and price-to-book ratios but challenges in return on equity and debt management. The company carries significant debt and a moderate current ratio, with a “slightly unfavorable” moat indicating value destruction but improving profitability. PCG’s rating is “B-” with a moderate overall score, though financial distress signs appear in its Altman Z-Score.
Edison International (EIX) presents a favorable income evolution marked by steady revenue and net income growth, supported by solid gross and EBIT margins. Financial ratios are mostly unfavorable, especially liquidity and debt metrics, but the company benefits from a higher dividend yield and better return on equity. EIX also faces value destruction with a “slightly unfavorable” moat, yet its profitability is improving. The rating is “B+” with moderate overall scores, though it remains in the distress zone per the Altman Z-Score.
For investors, PCG might appear more favorable for those emphasizing income statement strength and value metrics despite debt concerns, while EIX could suit those prioritizing dividend yield and improving profitability amid liquidity challenges. Both companies show signs of value destruction but with growing profitability, suggesting a cautious stance depending on risk tolerance and investment focus.
Disclaimer: Investment carries a risk of loss of initial capital. The past performance is not a reliable indicator of future results. Be sure to understand risks before making an investment decision.
Go Further
I encourage you to read the complete analyses of Pacific Gas & Electric Co. and Edison International to enhance your investment decisions: