In the evolving utilities sector, Edison International and Oklo Inc. stand out by blending tradition with innovation. Edison International boasts a long history delivering electric power across California, while Oklo Inc. pioneers advanced fission power technology for commercial-scale energy. Both operate in regulated electric markets but adopt distinct strategies. This article will explore their strengths to help you decide which company offers the most compelling investment opportunity today.
Table of contents
Companies Overview
I will begin the comparison between Edison International and Oklo Inc. by providing an overview of these two companies and their main differences.
Edison International Overview
Edison International operates through subsidiaries to generate and distribute electric power, serving 15M customers across Southern, Central, and Coastal California. Founded in 1886 and based in Rosemead, CA, it offers energy solutions to commercial and industrial users, supported by extensive transmission and distribution infrastructure. The company is a major player in the regulated electric utilities sector.
Oklo Inc. Overview
Oklo Inc., founded in 2013 and headquartered in Santa Clara, CA, designs and develops fission power plants providing reliable, commercial-scale energy in the US. It also offers used nuclear fuel recycling services. As a newer entrant in the regulated electric industry, Oklo focuses on advanced nuclear technology with a significantly smaller workforce compared to Edison International.
Key similarities and differences
Both companies operate in the regulated electric utilities sector and are listed on the NYSE. Edison International has a long-established presence with a broad customer base and infrastructure, while Oklo is a younger, specialized company emphasizing nuclear power innovation. Edison serves millions of customers with traditional electricity, whereas Oklo targets niche nuclear energy solutions with a smaller scale and workforce.
Income Statement Comparison
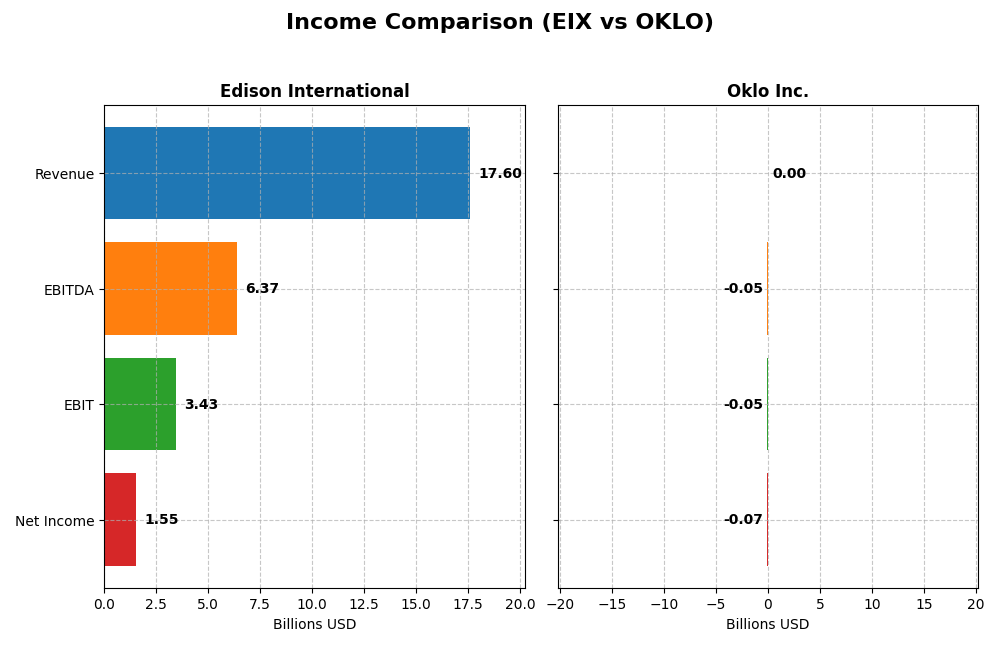
The table below presents a side-by-side comparison of key income statement metrics for Edison International and Oklo Inc. for the fiscal year 2024.
| Metric | Edison International | Oklo Inc. |
|---|---|---|
| Market Cap | 23.5B | 16.5B |
| Revenue | 17.6B | 0 |
| EBITDA | 6.4B | -53M |
| EBIT | 3.4B | -53M |
| Net Income | 1.5B | -74M |
| EPS | 3.33 | -0.74 |
| Fiscal Year | 2024 | 2024 |
Income Statement Interpretations
Edison International
From 2020 to 2024, Edison International’s revenue grew steadily by 29.6%, reaching $17.6B in 2024, with net income rising 77.5% to $1.55B. Margins showed positive trends, including a gross margin of 41.0% and an EBIT margin of 19.5%, both favorable. The most recent year saw continued growth in revenue and EBIT, with net margin improving slightly, reflecting solid operational performance.
Oklo Inc.
Oklo Inc. reported no revenue from 2021 through 2024, reflecting its development-stage status. Net losses widened significantly, with net income dropping to -$74M in 2024 from -$32M in 2023. Margins remain at zero or negative, with unfavorable trends across gross, EBIT, and net margins. The latest year saw deteriorating EBIT and EPS, highlighting ongoing investment without commercial sales yet.
Which one has the stronger fundamentals?
Edison International exhibits strong and improving fundamentals, with favorable margin stability and consistent growth in revenue and net income. Conversely, Oklo Inc. shows unfavorable income statement metrics with no revenue and growing losses reflecting early-stage development risks. Based on income statement evaluations alone, Edison International demonstrates more robust financial health.
Financial Ratios Comparison
The table below presents a side-by-side comparison of key financial ratios for Edison International and Oklo Inc. based on the most recent fiscal year 2024 data.
| Ratios | Edison International (EIX) | Oklo Inc. (OKLO) |
|---|---|---|
| ROE | 9.93% | -29.35% |
| ROIC | 3.61% | -19.23% |
| P/E | 19.93 | -28.52 |
| P/B | 1.98 | 8.37 |
| Current Ratio | 0.85 | 43.47 |
| Quick Ratio | 0.78 | 43.47 |
| D/E (Debt-to-Equity) | 2.43 | 0.01 |
| Debt-to-Assets | 44.12% | 0.46% |
| Interest Coverage | 1.57 | 0 |
| Asset Turnover | 0.21 | 0 |
| Fixed Asset Turnover | 0.29 | 0 |
| Payout Ratio | 83.18% | 0 |
| Dividend Yield | 4.17% | 0 |
Interpretation of the Ratios
Edison International
Edison International shows a mixed ratio profile, with several unfavorable metrics such as return on equity (9.93%), return on invested capital (3.61%), and liquidity ratios below 1, indicating potential operational and financial risks. The company exhibits a stable dividend yield of 4.17%, supported by a consistent payout, but free cash flow coverage is negative, suggesting caution regarding dividend sustainability and share repurchases.
Oklo Inc.
Oklo Inc. presents mostly unfavorable ratios, including negative net margin, return on equity (-29.35%), and return on invested capital (-19.23%), reflecting operational challenges and losses. The liquidity ratios are extremely high but potentially misleading due to the company’s stage and structure. Oklo does not pay dividends, likely due to its growth phase and reinvestment focus, with no share buyback programs indicated.
Which one has the best ratios?
Both companies have an overall unfavorable ratio outlook, with Edison International showing moderate stability but operational concerns, while Oklo faces significant profitability challenges and negative returns. Edison’s dividend yield is a positive aspect, whereas Oklo’s high liquidity contrasts with its poor profitability, making neither clearly superior in ratio strength.
Strategic Positioning
This section compares the strategic positioning of Edison International and Oklo Inc., including market position, key segments, and exposure to technological disruption:
EIX
- Large market cap of 23.5B, serving 15M customers with established competitive pressures.
- Key segments: Electric Utility (10.6B) and Competitive Power Generation (2.2B).
- Exposure to traditional electric infrastructure with transmission and distribution lines.
OKLO
- Smaller market cap of 16.5B, focused on innovative nuclear power with emerging competition.
- Focused on fission power plants and nuclear fuel recycling, no product segmentation data.
- Exposure to nuclear technology innovation, potentially higher disruption risk.
EIX vs OKLO Positioning
EIX operates a diversified utility business with broad customer base and multiple revenue streams, providing stability. OKLO concentrates on advanced nuclear energy solutions, implying higher innovation potential but greater market uncertainty and risk.
Which has the best competitive advantage?
EIX shows a slightly unfavorable moat with growing profitability despite value destruction, while OKLO faces very unfavorable moat and declining returns, indicating EIX currently holds a more resilient competitive advantage.
Stock Comparison
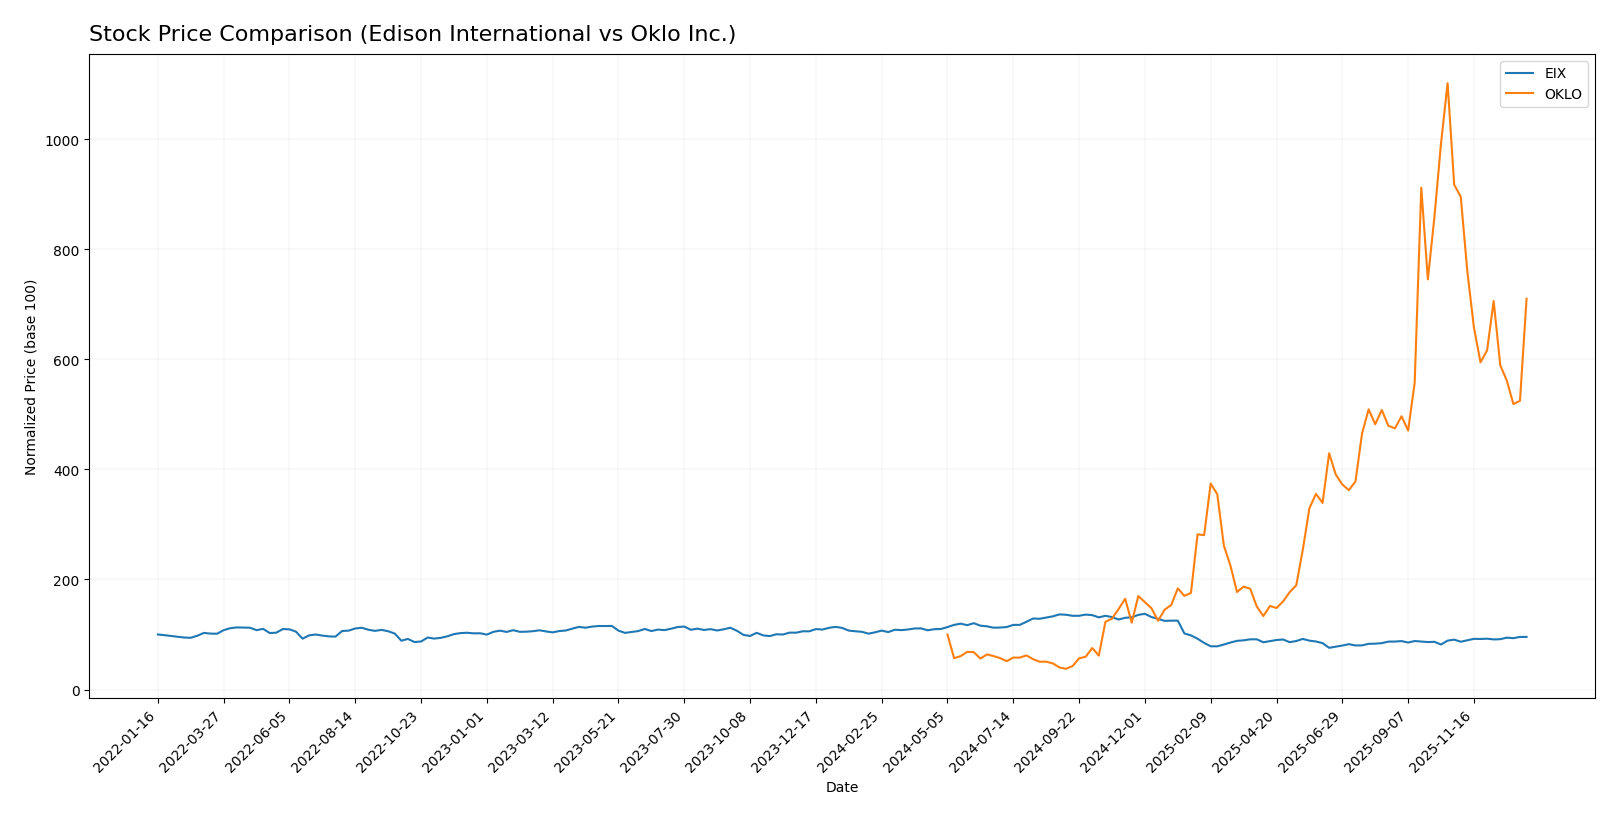
The stock price movements over the past year reveal a bearish trend for Edison International with accelerating decline, while Oklo Inc. shows an overall strong bullish trend despite recent deceleration and a notable price drop.
Trend Analysis
Edison International (EIX) experienced an 8.02% price decrease over the past 12 months, confirming a bearish trend with accelerating decline and notable volatility (std dev 12.11), reaching a high of 87.75 and a low of 48.32.
Oklo Inc. (OKLO) posted a 610.11% increase over the same period, indicating a bullish trend with deceleration. The stock showed high volatility (std dev 39.02) and a price range from 5.59 to 163.39, but recently declined 22.59%.
Comparing both, Oklo Inc. delivered the highest market performance with a significant bullish price surge, while Edison International showed a bearish trend with moderate volume increase.
Target Prices
The current analyst consensus reveals a positive outlook for both Edison International and Oklo Inc.
| Company | Target High | Target Low | Consensus |
|---|---|---|---|
| Edison International | 70 | 56 | 62 |
| Oklo Inc. | 150 | 95 | 125.67 |
Analysts expect Edison International’s stock to trade modestly above its current price of 60.99 USD, while Oklo Inc. shows significant upside potential compared to its present 105.31 USD share price.
Analyst Opinions Comparison
This section compares analysts’ ratings and grades for Edison International and Oklo Inc.:
Rating Comparison
EIX Rating
- Rating: B+, classified as Very Favorable by analysts.
- Discounted Cash Flow Score: 1, indicating Very Unfavorable DCF valuation.
- ROE Score: 5, Very Favorable, showing strong profit generation from equity.
- ROA Score: 4, Favorable, indicating efficient asset utilization.
- Debt To Equity Score: 1, Very Unfavorable, suggesting high financial risk.
- Overall Score: 3, Moderate overall financial standing.
OKLO Rating
- Rating: C+, classified as Very Favorable by analysts.
- Discounted Cash Flow Score: 3, indicating a Moderate DCF valuation.
- ROE Score: 1, Very Unfavorable, showing weak profit generation.
- ROA Score: 1, Very Unfavorable, indicating poor asset utilization.
- Debt To Equity Score: 5, Very Favorable, indicating low financial risk.
- Overall Score: 2, Moderate overall financial standing.
Which one is the best rated?
Edison International is better rated overall with a B+ and stronger scores in ROE and ROA. Oklo Inc. shows a lower rating and weaker profitability metrics but a stronger debt position.
Scores Comparison
Here is a comparison of Edison International and Oklo Inc. based on their financial scores:
Edison International Scores
- Altman Z-Score: 0.72, indicating financial distress.
- Piotroski Score: 6, indicating average financial strength.
Oklo Inc. Scores
- Altman Z-Score: 339.43, indicating a safe zone.
- Piotroski Score: 2, indicating very weak strength.
Which company has the best scores?
Oklo Inc. has a significantly higher Altman Z-Score, placing it in the safe zone, but a very weak Piotroski Score. Edison International shows financial distress by Altman but has an average Piotroski Score.
Grades Comparison
The following is a comparison of the latest available grades from reputable financial institutions for Edison International and Oklo Inc.:
Edison International Grades
This table summarizes recent grades assigned to Edison International by major financial firms.
| Grading Company | Action | New Grade | Date |
|---|---|---|---|
| Morgan Stanley | Maintain | Underweight | 2025-12-17 |
| JP Morgan | Maintain | Neutral | 2025-12-12 |
| UBS | Maintain | Buy | 2025-12-02 |
| Ladenburg Thalmann | Maintain | Neutral | 2025-10-30 |
| Barclays | Maintain | Overweight | 2025-10-29 |
| Jefferies | Maintain | Hold | 2025-10-22 |
| Morgan Stanley | Maintain | Underweight | 2025-10-22 |
| Barclays | Maintain | Overweight | 2025-10-21 |
| Jefferies | Downgrade | Hold | 2025-10-02 |
| JP Morgan | Maintain | Neutral | 2025-09-25 |
Edison International’s grades show a mixed but generally cautious stance, with several firms maintaining neutral to underweight ratings alongside some buy and overweight recommendations.
Oklo Inc. Grades
This table details recent grades for Oklo Inc. from recognized grading companies.
| Grading Company | Action | New Grade | Date |
|---|---|---|---|
| Seaport Global | Upgrade | Buy | 2025-12-08 |
| UBS | Maintain | Neutral | 2025-12-03 |
| B of A Securities | Maintain | Neutral | 2025-11-12 |
| B. Riley Securities | Maintain | Buy | 2025-11-12 |
| Wedbush | Maintain | Outperform | 2025-11-12 |
| B of A Securities | Downgrade | Neutral | 2025-09-30 |
| Seaport Global | Downgrade | Neutral | 2025-09-23 |
| Wedbush | Maintain | Outperform | 2025-09-22 |
| Wedbush | Maintain | Outperform | 2025-08-14 |
| Wedbush | Maintain | Outperform | 2025-08-12 |
Oklo Inc. demonstrates a generally positive outlook with multiple “Outperform” and “Buy” grades, though some recent downgrades to neutral have occurred.
Which company has the best grades?
Both companies have a consensus “Buy” rating, but Oklo Inc. has received more consistently positive grades like “Outperform” and “Buy” from its analysts, suggesting a stronger market confidence. Edison International’s ratings are more mixed, reflecting varied analyst perspectives that may imply greater caution for investors.
Strengths and Weaknesses
Below is a comparative table highlighting the key strengths and weaknesses of Edison International (EIX) and Oklo Inc. (OKLO) based on the latest available data.
| Criterion | Edison International (EIX) | Oklo Inc. (OKLO) |
|---|---|---|
| Diversification | Moderate, with significant Electric Utility segment and Competitive Power Generation | Limited, as a newer company with narrow focus |
| Profitability | Slightly unfavorable; ROIC 3.61% below WACC, net margin 8.78% neutral | Very unfavorable; negative ROIC -19.23%, net margin 0% |
| Innovation | Moderate innovation; stable ROIC trend showing growth | Low; declining ROIC trend and value destruction |
| Global presence | Strong US-based utility presence, limited international exposure | Minimal global footprint, early-stage company |
| Market Share | Established player in US electric utility market | Emerging, negligible market share |
Edison International shows a stable but challenged profitability profile, with improving returns despite currently shedding value. Oklo struggles with profitability and value creation, reflecting its early development phase and limited diversification. Caution and close monitoring are advised for both, with EIX offering more stability and OKLO higher risk but potential for innovation-led growth.
Risk Analysis
The table below summarizes key risks for Edison International (EIX) and Oklo Inc. (OKLO) in 2026 to help investors assess potential vulnerabilities.
| Metric | Edison International (EIX) | Oklo Inc. (OKLO) |
|---|---|---|
| Market Risk | Moderate (Beta 0.83, stable utility sector) | Moderate (Beta 0.77, emerging tech focus) |
| Debt level | High (Debt/Equity 2.43, interest coverage low at 1.84) | Very Low (Debt/Equity 0.01, strong liquidity) |
| Regulatory Risk | Significant (regulated electric sector, CA state policies) | High (nuclear energy regulation, licensing) |
| Operational Risk | Moderate (aging infrastructure, large scale grid) | High (new tech, limited operational history) |
| Environmental Risk | Medium (carbon regulations, renewable transition impact) | Medium (nuclear waste and safety concerns) |
| Geopolitical Risk | Low (US domestic operations) | Low (US domestic operations) |
Edison International faces the most impactful risks from high debt levels and regulatory changes in California, which may affect profitability despite steady demand. Oklo carries higher operational and regulatory risks due to its innovative nuclear technology and early stage, though its low debt reduces financial strain. Both require careful monitoring of regulatory landscapes and operational execution.
Which Stock to Choose?
Edison International (EIX) has shown a favorable income evolution with 78.57% positive indicators, including steady revenue and net income growth. However, its financial ratios are mostly unfavorable, with 57.14% negative signals like low current and quick ratios, and high debt levels. Profitability is moderate with a 9.93% ROE, while debt remains significant, and the overall rating is very favorable (B+).
Oklo Inc. (OKLO) exhibits an unfavorable income trend with 92.86% negative income statement metrics, reflecting declining revenue and profitability. Its financial ratios are also largely unfavorable at 64.29%, despite some favorable debt and liquidity measures. Profitability is weak with negative ROE and ROIC, low earnings yield, and the rating is very favorable (C+) mainly due to low leverage.
Considering the ratings and global financial evaluations, Edison International might appear more favorable for investors seeking companies with improving profitability and a stronger income track record. In contrast, Oklo could be seen as a higher risk, potentially suited for risk-tolerant investors focused on early-stage growth or turnaround opportunities given its volatile fundamentals and valuation metrics.
Disclaimer: Investment carries a risk of loss of initial capital. The past performance is not a reliable indicator of future results. Be sure to understand risks before making an investment decision.
Go Further
I encourage you to read the complete analyses of Edison International and Oklo Inc. to enhance your investment decisions: