Home > Comparison > Utilities > NEE vs EIX
The strategic rivalry between NextEra Energy, Inc. and Edison International defines the trajectory of the U.S. regulated electric sector. NextEra operates as a diversified clean energy powerhouse with significant renewable capacity. Edison International focuses on delivering electricity across California with an emphasis on transmission and distribution. This analysis will assess which business model offers superior risk-adjusted returns, guiding investors seeking durable exposure to the evolving utilities landscape.
Table of contents
Companies Overview
NextEra Energy and Edison International stand as key players shaping the U.S. regulated electric market.
NextEra Energy, Inc.: Clean Energy Powerhouse
NextEra Energy dominates as a regulated electric utility with a diversified generation portfolio including wind, solar, nuclear, coal, and natural gas. It earns revenue by generating and selling electricity to retail and wholesale markets across North America. In 2021, the company emphasized expanding its clean energy solutions, including renewable facilities and battery storage, aiming to lead in sustainable power infrastructure.
Edison International: California Power Provider
Edison International operates as a regulated electric utility primarily serving 15 million customers in California. It generates revenue by distributing electricity through extensive transmission and distribution networks. Its 2021 strategy focused on maintaining reliable power delivery while expanding energy solutions for commercial and industrial users, addressing rising demand in a heavily regulated and populous region.
Strategic Collision: Similarities & Divergences
Both companies operate within regulated electric utilities but pursue distinct philosophies. NextEra invests heavily in renewables and innovation, positioning as a sustainable energy leader. Edison International prioritizes robust infrastructure and customer base stability in California. Their battleground lies in evolving energy demands and regulatory environments. Each offers a unique investment profile: NextEra as a growth-oriented clean tech giant, Edison as a steady regional utility with a focus on service reliability.
Income Statement Comparison
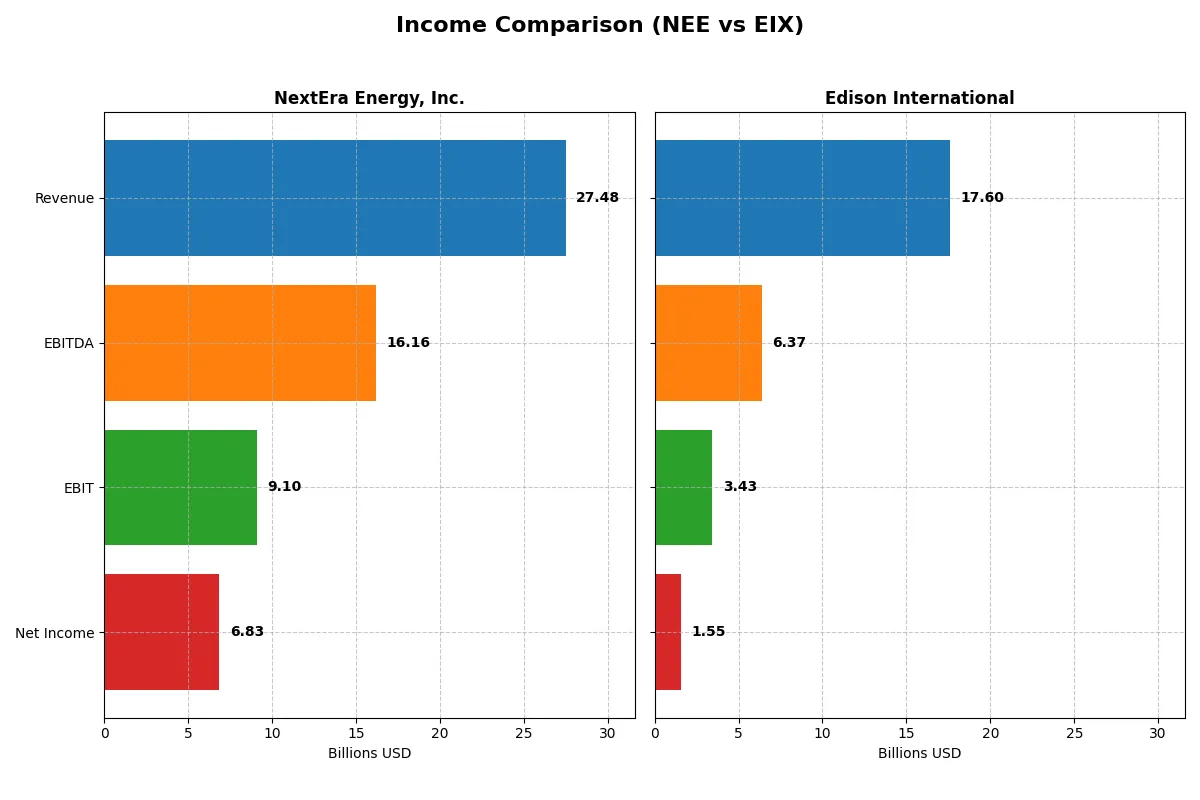
This data dissects the core profitability and scalability of both corporate engines to reveal who dominates the bottom line:
| Metric | NextEra Energy, Inc. (NEE) | Edison International (EIX) |
|---|---|---|
| Revenue | 27.48B | 17.60B |
| Cost of Revenue | 10.22B | 10.38B |
| Operating Expenses | 8.98B | 4.29B |
| Gross Profit | 17.26B | 7.22B |
| EBITDA | 16.17B | 6.37B |
| EBIT | 9.10B | 3.43B |
| Interest Expense | 4.57B | 1.87B |
| Net Income | 6.83B | 1.29B |
| EPS | 3.31 | 3.33 |
| Fiscal Year | 2025 | 2024 |
Income Statement Analysis: The Bottom-Line Duel
This income statement comparison reveals which company more efficiently converts revenue into profit, exposing the strength of each corporate engine.
NextEra Energy, Inc. Analysis
NextEra Energy’s revenue climbed steadily from $17.1B in 2021 to $27.5B in 2025, with net income nearly doubling to $6.8B. The firm maintains robust gross and net margins at 62.8% and 24.9%, respectively, signaling excellent cost control. Despite rising interest expenses, its EBIT margin of 33.1% reflects strong operational momentum in 2025.
Edison International Analysis
Edison International’s revenue grew moderately from $13.6B in 2020 to $17.6B in 2024, with net income rising to $1.5B. Gross margin stands at a solid 41%, while net margin lags at 8.8%, indicating tighter profitability. The company improved EBIT margin to 19.5% in 2024, showing operational efficiency gains despite persistent interest costs.
Verdict: High Margin Dominance vs. Steady Growth
NextEra Energy’s superior margins and nearly 60% revenue growth since 2021 outpace Edison’s modest 30% revenue rise and thinner profitability. NextEra’s high EBIT and net margins position it as the fundamental winner on income efficiency. Investors seeking robust margin strength and scalable earnings should find NextEra’s profile more compelling.
Financial Ratios Comparison
These vital ratios act as a diagnostic tool to expose the underlying fiscal health, valuation premiums, and capital efficiency of the companies compared below:
| Ratios | NextEra Energy, Inc. (NEE) | Edison International (EIX) |
|---|---|---|
| ROE | 13.9% | 9.9% |
| ROIC | 4.0% | 3.6% |
| P/E | 21.2 | 19.9 |
| P/B | 2.94 | 1.98 |
| Current Ratio | 0.47 | 0.85 |
| Quick Ratio | 0.38 | 0.78 |
| D/E (Debt-to-Equity) | 1.64 | 2.43 |
| Debt-to-Assets | 43.3% | 44.1% |
| Interest Coverage | 3.35 | 1.57 |
| Asset Turnover | 0.13 | 0.21 |
| Fixed Asset Turnover | 0.18 | 0.29 |
| Payout Ratio | 61.0% | 83.2% |
| Dividend Yield | 2.87% | 4.17% |
| Fiscal Year | 2024 | 2024 |
Efficiency & Valuation Duel: The Vital Signs
Financial ratios act as the company’s DNA, exposing hidden risks and signaling operational strengths or weaknesses.
NextEra Energy, Inc.
NextEra Energy shows a solid net margin of 28.06%, signaling strong profitability despite a neutral ROE of 13.86%. Its P/E of 21.23 and P/B of 2.94 suggest a fairly priced stock with moderate valuation. A 2.87% dividend yield reflects consistent shareholder returns amid cautious reinvestment.
Edison International
Edison International posts a modest net margin of 8.78% and a weaker ROE of 9.93%, indicating lower profitability efficiency. Its P/E of 19.93 and P/B of 1.98 position it as reasonably valued but stretched in debt with a D/E ratio of 2.43. The 4.17% dividend yield compensates investors amid operational challenges.
Profitability Strength vs. Dividend Appeal
NextEra Energy balances profitability with a stable valuation and moderate dividends, offering a healthier operational profile. Edison International trades at a similar valuation but reveals weaker returns and higher leverage. Investors seeking profit efficiency may prefer NextEra, while income-focused profiles might lean toward Edison.
Which one offers the Superior Shareholder Reward?
NextEra Energy (NEE) delivers a balanced distribution approach with a 2.87% dividend yield and a 61% payout ratio, supported by positive free cash flow of 2.3B. It complements dividends with moderate buybacks, ensuring sustainable returns. Edison International (EIX) pays a higher 4.17% yield but carries a risky 83% payout ratio and negative free cash flow (-1.8B), signaling dividend pressure. EIX’s aggressive buybacks pale against its cash flow deficits. I see NEE’s prudent dividend and buyback mix as more sustainable and superior for long-term total shareholder return in 2026.
Comparative Score Analysis: The Strategic Profile
The radar chart reveals the fundamental DNA and strategic trade-offs of NextEra Energy and Edison International:
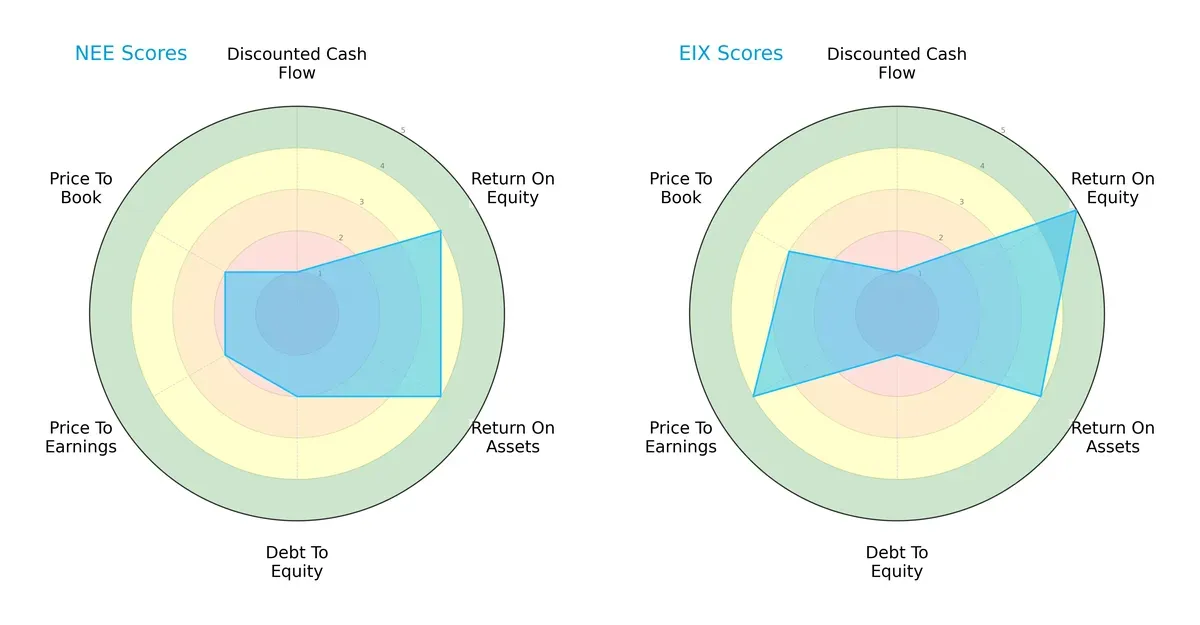
NextEra and Edison share moderate overall scores but differ sharply in financial edges. Edison excels in Return on Equity (5 vs. 4) and Price-to-Earnings valuation (4 vs. 2), reflecting superior profitability and market appeal. NextEra shows a slightly stronger debt-to-equity profile (2 vs. 1), indicating more conservative leverage management. Edison’s profile is less balanced, relying heavily on profitability and valuation strengths, while NextEra maintains steadier, if moderate, scores across metrics.
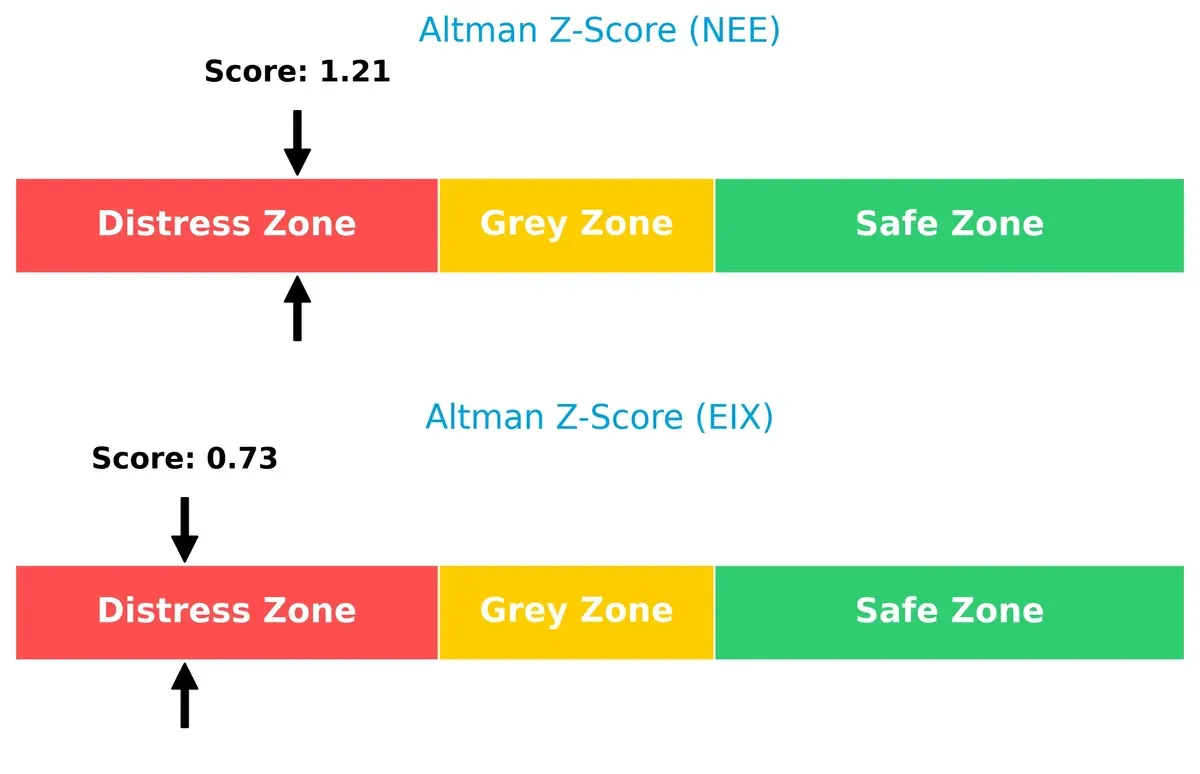
Bankruptcy Risk: Solvency Showdown
NextEra’s Altman Z-Score of 1.21 slightly outperforms Edison’s 0.73, but both remain in the distress zone, signaling elevated bankruptcy risk amid current market conditions:
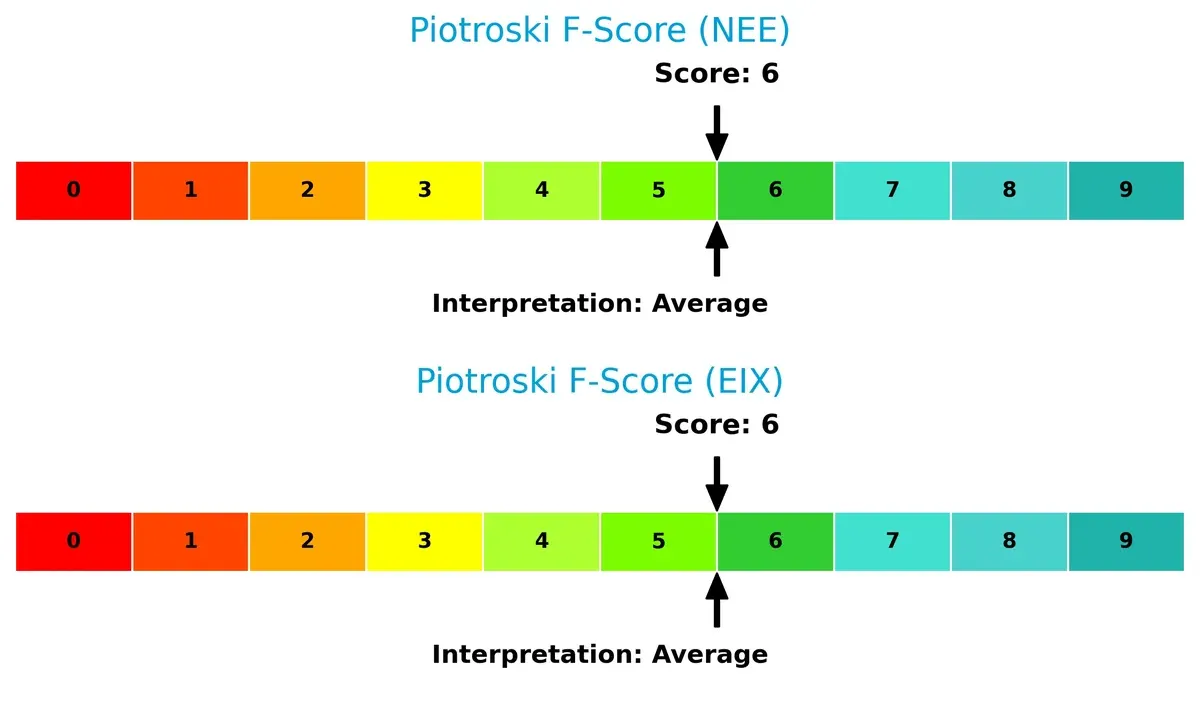
Financial Health: Quality of Operations
Both firms score a 6 on the Piotroski F-Score, indicating average financial health without immediate red flags. Neither company demonstrates peak operational quality, warranting cautious monitoring:
How are the two companies positioned?
This section dissects the operational DNA of NEE and EIX by comparing their revenue distribution by segment and internal dynamics, such as strengths and weaknesses. The final objective is to confront their economic moats to identify which business model offers the most resilient, sustainable competitive advantage in today’s market.
Revenue Segmentation: The Strategic Mix
This comparison dissects how NextEra Energy and Edison International diversify their income streams and highlights their primary sector bets:
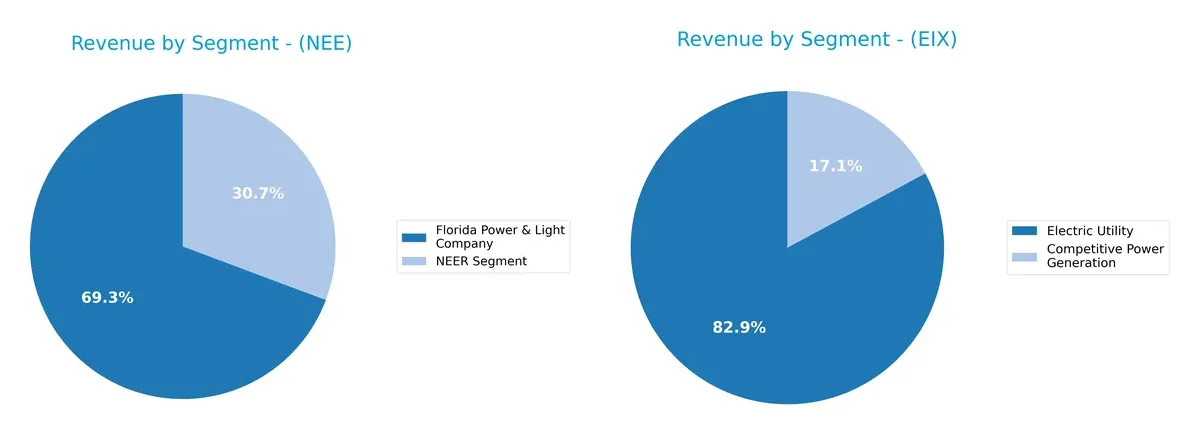
NextEra Energy anchors its revenue in the Florida Power & Light Company segment with $17B, complemented by $7.5B from NextEra Energy Resources, showing moderate diversification. Edison International relies heavily on its Electric Utility segment, generating $10.6B, while Competitive Power Generation contributes $2.2B, indicating less diversification. NextEra’s mix implies strategic ecosystem lock-in in regulated utilities and renewable resources, while Edison faces concentration risk anchored in traditional electric utility operations.
Strengths and Weaknesses Comparison
This table compares the Strengths and Weaknesses of NextEra Energy, Inc. (NEE) and Edison International (EIX):
NEE Strengths
- Higher net margin at 28.06%
- Favorable WACC at 6.4%
- Dividend yield of 2.87%
- Larger revenue base from Florida Power & Light
EIX Strengths
- Favorable WACC at 5.97%
- Dividend yield of 4.17%
- Neutral net margin at 8.78%
- Diverse segments including Competitive Power Generation
NEE Weaknesses
- Unfavorable ROIC at 4.04% below WACC
- Low current and quick ratios under 0.5
- High debt-to-equity at 1.64
- Weak asset turnover and interest coverage
EIX Weaknesses
- Unfavorable ROIC at 3.61% below WACC
- Low liquidity ratios below 1.0
- High debt-to-equity at 2.43
- Lower ROE at 9.93%
Both companies show mixed financial health with favorable capital costs but weak liquidity and asset efficiency. NEE’s stronger profitability contrasts with higher leverage risks, while EIX faces greater challenges in returns and liquidity.
The Moat Duel: Analyzing Competitive Defensibility
Structural moats are the only true barriers protecting long-term profits from relentless competitive pressure. Let’s dissect the moats of two key regulated electric utilities:
NextEra Energy, Inc.: Intangible Assets and Scale Moat
NextEra leverages massive renewable infrastructure and regulatory relationships. Its financials show robust margins but declining ROIC signals weakening capital efficiency. Expansion in clean energy could deepen its moat if managed well.
Edison International: Operational Efficiency and Improving Capital Returns
Edison’s moat rests on its operational scale and improving ROIC trajectory. Though trailing NextEra’s margins, it grows profitability steadily. Opportunities in California’s energy transition may enhance its competitive position.
Capital Efficiency vs. Scale Dominance: The Moat Showdown
NextEra commands wider scale and superior margin stability, but declining ROIC warns of eroding efficiency. Edison exhibits a narrower moat but improves capital returns, signaling a potentially more durable future moat. I see Edison better positioned to defend market share amid industry evolution.
Which stock offers better returns?
The past year shows contrasting stock price movements for NextEra Energy and Edison International, with NextEra’s strong gains and Edison’s decline shaping distinct trading dynamics.
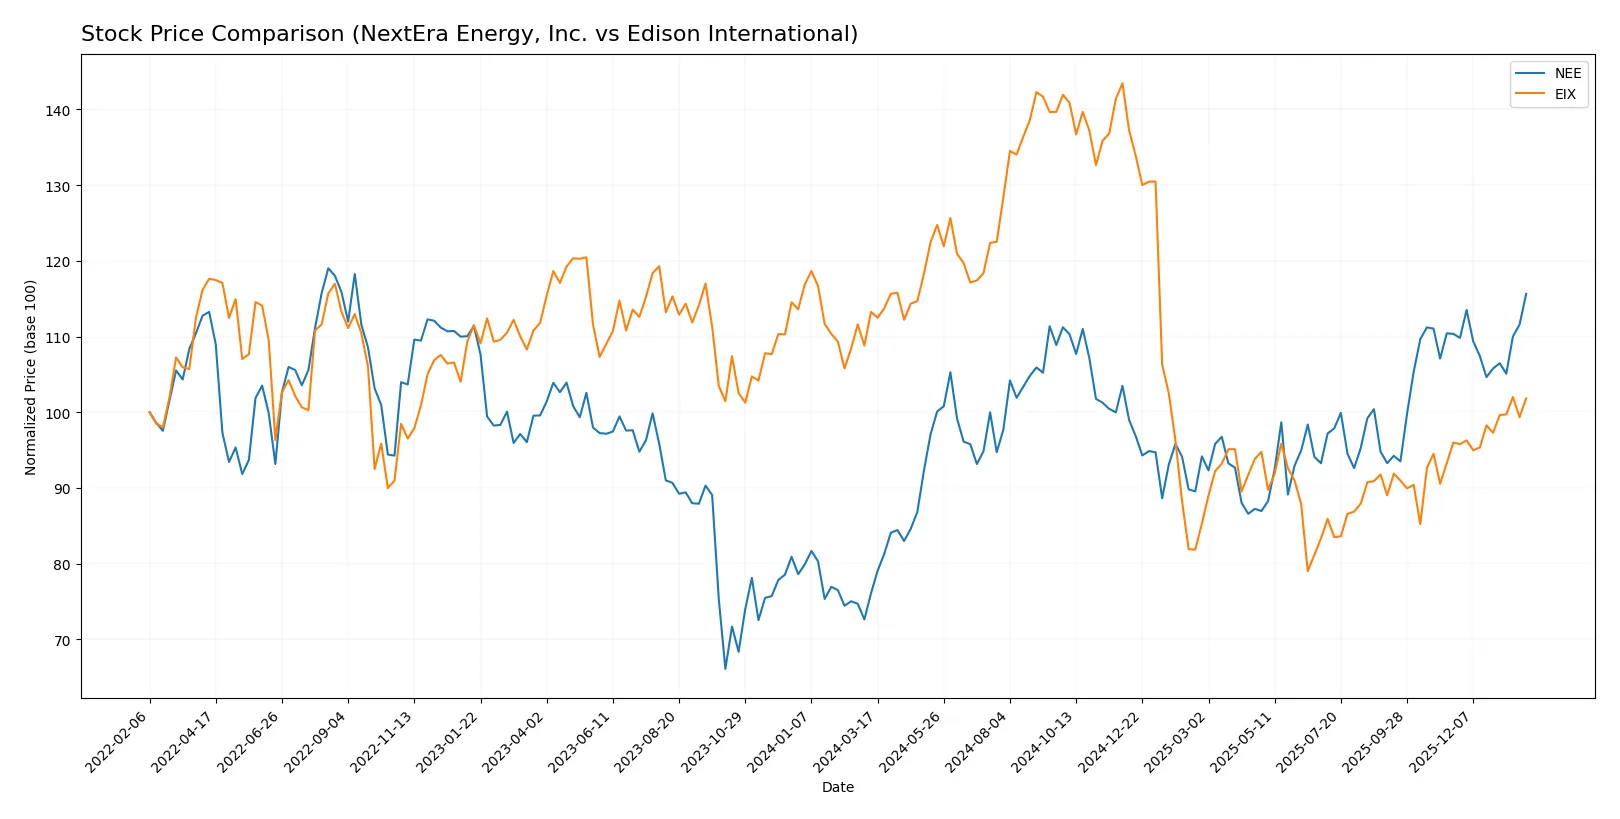
Trend Comparison
NextEra Energy’s stock rose 52.05% over the past 12 months, signaling a bullish trend with decelerating momentum, hitting a high of 87.9 and a low of 57.81.
Edison International’s stock fell 10.09% over the same period, indicating a bearish trend with accelerating downward pressure, fluctuating between 48.32 and 87.75.
NextEra Energy outperformed Edison International, delivering the highest market return despite slowing price gains in recent months.
Target Prices
Analysts show a moderately bullish consensus for these regulated electric utilities.
| Company | Target Low | Target High | Consensus |
|---|---|---|---|
| NextEra Energy, Inc. | 84 | 104 | 93.09 |
| Edison International | 57 | 70 | 62.6 |
NextEra’s consensus target sits about 6% above its current 87.9 price, indicating room for appreciation. Edison International’s target is roughly flat versus its 62.28 price, suggesting limited near-term upside.

Don’t Let Luck Decide Your Entry Point
Optimize your entry points with our advanced ProRealTime indicators. You’ll get efficient buy signals with precise price targets for maximum performance. Start outperforming now!
How do institutions grade them?
The following tables present recent institutional grades for NextEra Energy, Inc. and Edison International:
NextEra Energy, Inc. Grades
This table summarizes the latest grades assigned by established financial institutions for NextEra Energy, Inc.
| Grading Company | Action | New Grade | Date |
|---|---|---|---|
| Mizuho | Maintain | Neutral | 2026-01-28 |
| Argus Research | Maintain | Buy | 2026-01-28 |
| BMO Capital | Maintain | Outperform | 2026-01-27 |
| Wells Fargo | Maintain | Overweight | 2026-01-20 |
| Barclays | Maintain | Equal Weight | 2026-01-15 |
| Jefferies | Maintain | Hold | 2025-12-31 |
| UBS | Maintain | Buy | 2025-12-17 |
| JP Morgan | Maintain | Overweight | 2025-12-11 |
| BMO Capital | Maintain | Outperform | 2025-12-10 |
| UBS | Maintain | Buy | 2025-12-10 |
Edison International Grades
This table lists recent institutional grades for Edison International from credible financial analysts.
| Grading Company | Action | New Grade | Date |
|---|---|---|---|
| Jefferies | Maintain | Hold | 2026-01-28 |
| JP Morgan | Maintain | Neutral | 2026-01-28 |
| Barclays | Maintain | Overweight | 2026-01-22 |
| Wells Fargo | Downgrade | Underweight | 2026-01-20 |
| Morgan Stanley | Maintain | Underweight | 2025-12-17 |
| JP Morgan | Maintain | Neutral | 2025-12-12 |
| UBS | Maintain | Buy | 2025-12-02 |
| Ladenburg Thalmann | Maintain | Neutral | 2025-10-30 |
| Barclays | Maintain | Overweight | 2025-10-29 |
| Jefferies | Maintain | Hold | 2025-10-22 |
Which company has the best grades?
NextEra Energy consistently receives higher grades such as Buy, Outperform, and Overweight from multiple institutions. Edison International’s grades cluster around Hold, Neutral, and Underweight, with fewer Buy ratings. This suggests stronger institutional confidence in NextEra Energy, impacting investor perception and portfolio allocation decisions accordingly.
Risks specific to each company
In 2026, these risk categories reveal the critical pressure points and systemic threats facing NextEra Energy, Inc. (NEE) and Edison International (EIX) in today’s market environment:
1. Market & Competition
NextEra Energy, Inc. (NEE)
- Dominates clean energy with 28,564 MW capacity but faces rising competition in renewables.
Edison International (EIX)
- Serves 15M customers in California with strong regional presence but limited national scale.
2. Capital Structure & Debt
NextEra Energy, Inc. (NEE)
- Debt-to-equity ratio at 1.64 signals leverage risk; interest coverage at 1.99 is weak.
Edison International (EIX)
- Higher leverage at 2.43 and lower interest coverage of 1.84, indicating greater financial strain.
3. Stock Volatility
NextEra Energy, Inc. (NEE)
- Beta of 0.73 suggests lower volatility, aiding portfolio stability.
Edison International (EIX)
- Beta of 0.83 indicates slightly higher stock price fluctuations.
4. Regulatory & Legal
NextEra Energy, Inc. (NEE)
- Regulated electric sector exposure with evolving clean energy mandates; moderate compliance risk.
Edison International (EIX)
- Faces strict California regulations and wildfire liabilities, elevating legal risk exposure.
5. Supply Chain & Operations
NextEra Energy, Inc. (NEE)
- Large transmission network (77,000 circuit miles) poses operational complexity but supports scale.
Edison International (EIX)
- Extensive distribution lines (70,000 circuit miles) in wildfire-prone zones increase operational risks.
6. ESG & Climate Transition
NextEra Energy, Inc. (NEE)
- Strong renewable investments enhance ESG profile, but transition costs pressure margins.
Edison International (EIX)
- ESG risks heightened by wildfire lawsuits and slower renewable integration.
7. Geopolitical Exposure
NextEra Energy, Inc. (NEE)
- Primarily U.S. exposure with stable political environment; minimal international risk.
Edison International (EIX)
- Concentrated in California, vulnerable to regional policy shifts and natural disasters.
Which company shows a better risk-adjusted profile?
NextEra Energy’s strongest risk lies in its capital structure and interest coverage, which is slightly better than Edison’s higher leverage and weaker coverage. Edison faces pronounced regulatory and operational risks from California’s wildfire liabilities. Despite both firms showing distress zone Altman Z-scores, NextEra’s lower beta and broader geographic footprint create a more balanced risk-return profile. The persistent wildfire-related regulatory pressures uniquely weigh heavier on Edison’s risk outlook.
Final Verdict: Which stock to choose?
NextEra Energy, Inc. (NEE) shines with its unrivaled scale and consistent revenue growth, making it a cash-generating powerhouse in the renewable energy space. However, its declining return on invested capital and stretched liquidity ratios warrant close monitoring. NEE suits investors targeting aggressive growth with a tolerance for capital intensity risks.
Edison International (EIX) offers a strategic moat through stable utility operations and a solid dividend yield, appealing to those valuing income and capital preservation. While it lags NEE in growth and efficiency, its improving profitability trend and lower valuation provide a relatively safer option for conservative or GARP-oriented portfolios.
If you prioritize rapid expansion and market leadership, NextEra Energy outshines due to its scale and growth momentum despite some financial strains. However, if you seek better stability and income with moderate growth, Edison International offers a more balanced risk profile and improving returns. Both present distinct analytical scenarios depending on your portfolio’s risk appetite and investment horizon.
Disclaimer: Investment carries a risk of loss of initial capital. The past performance is not a reliable indicator of future results. Be sure to understand risks before making an investment decision.
Go Further
I encourage you to read the complete analyses of NextEra Energy, Inc. and Edison International to enhance your investment decisions: