In the dynamic world of regulated electric utilities, FirstEnergy Corp. (FE) and Edison International (EIX) stand out as major players with overlapping market footprints and innovative approaches to energy distribution. Both companies serve millions of customers across key U.S. regions, offering a mix of traditional and renewable energy solutions. This article will guide you through a detailed comparison to help determine which company holds the most promise for your investment portfolio.
Table of contents
Companies Overview
I will begin the comparison between FirstEnergy Corp. and Edison International by providing an overview of these two companies and their main differences.
FirstEnergy Corp. Overview
FirstEnergy Corp. operates in the regulated electric industry, generating, transmitting, and distributing electricity across several U.S. states including Ohio, Pennsylvania, and New Jersey. The company manages a diverse energy portfolio with coal, nuclear, hydroelectric, natural gas, wind, and solar facilities. Headquartered in Akron, Ohio, FirstEnergy serves approximately 6 million customers and operates extensive transmission and distribution networks.
Edison International Overview
Edison International is a regulated electric utility company delivering power primarily to Southern, Central, and Coastal California. It serves 15 million customers spanning residential, commercial, industrial, and public sectors. The company owns significant transmission and distribution infrastructure, including tens of thousands of circuit-miles of overhead and underground lines. Founded in 1886, Edison is headquartered in Rosemead, California, and provides energy solutions to diverse users.
Key similarities and differences
Both FirstEnergy and Edison International operate as regulated electric utilities focused on generation and distribution of electricity in the U.S. They maintain large transmission and distribution networks, though Edison serves a larger customer base in California compared to FirstEnergy’s multi-state footprint. Edison’s longer history and larger customer reach contrast with FirstEnergy’s more diversified energy sources, including renewables alongside traditional generation methods.
Income Statement Comparison
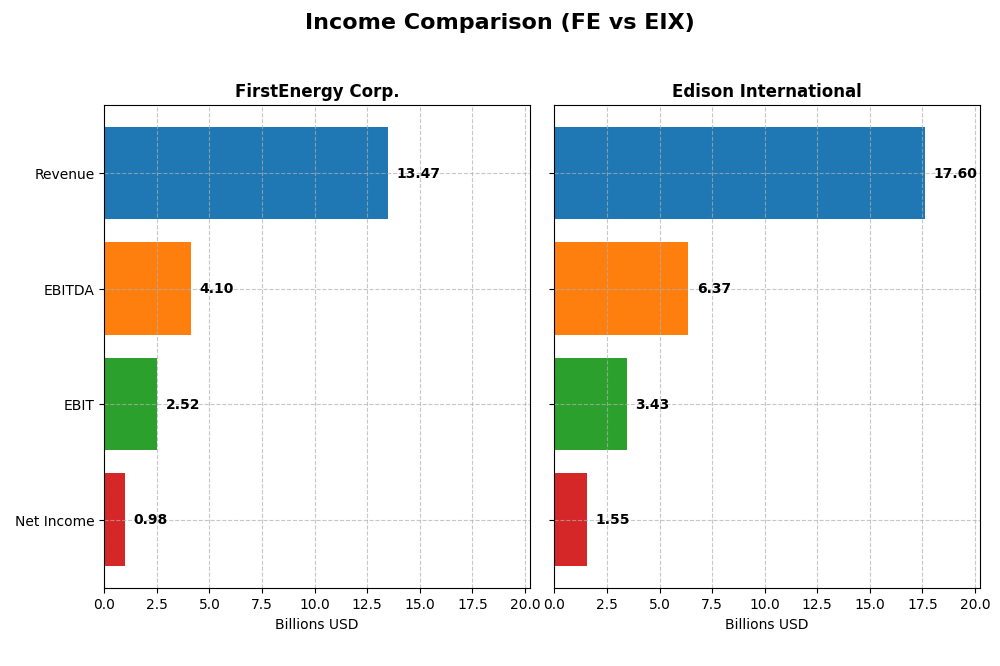
The table below compares the key income statement metrics for FirstEnergy Corp. and Edison International for the fiscal year 2024, providing a clear view of their financial performance.
| Metric | FirstEnergy Corp. (FE) | Edison International (EIX) |
|---|---|---|
| Market Cap | 25.8B | 23.5B |
| Revenue | 13.5B | 17.6B |
| EBITDA | 4.1B | 6.4B |
| EBIT | 2.5B | 3.4B |
| Net Income | 978M | 1.5B |
| EPS | 1.7 | 3.33 |
| Fiscal Year | 2024 | 2024 |
Income Statement Interpretations
FirstEnergy Corp.
FirstEnergy Corp. showed a revenue increase from $10.8B in 2020 to $13.5B in 2024, with a 24.9% growth over five years. Net income declined overall from $1.08B to $978M, reflecting a 9.4% drop. Gross and EBIT margins remained favorable around 67.5% and 18.7%, respectively, but net margin fell by 27.4%. The 2024 year saw slowed net income and EPS growth, signaling margin pressure.
Edison International
Edison International’s revenue grew from $13.6B in 2020 to $17.6B in 2024, a 29.6% rise. Net income improved markedly by 77.5% to $1.55B over the period. Margins were solid, with gross margin at 41.0%, EBIT margin at 19.5%, and net margin at 8.8%. The 2024 fiscal year showed healthy margin and EPS improvements, with EBIT up 9.8% and EPS up 6.4%, indicating stronger operational momentum.
Which one has the stronger fundamentals?
Edison International demonstrates stronger fundamentals with higher revenue and net income growth, alongside favorable margin expansions and EPS growth. FirstEnergy’s growth is more moderate with declining net income and net margin pressures, reflecting some operational challenges. Edison’s more consistent margin improvements and robust profit growth suggest a comparatively more favorable income statement profile.
Financial Ratios Comparison
The table below presents a side-by-side comparison of key financial ratios for FirstEnergy Corp. (FE) and Edison International (EIX) based on their most recent fiscal year data ending 2024.
| Ratios | FirstEnergy Corp. (FE) | Edison International (EIX) |
|---|---|---|
| ROE | 7.85% | 9.93% |
| ROIC | 3.66% | 3.61% |
| P/E | 23.39 | 19.93 |
| P/B | 1.84 | 1.98 |
| Current Ratio | 0.56 | 0.85 |
| Quick Ratio | 0.45 | 0.78 |
| D/E (Debt-to-Equity) | 1.95 | 2.43 |
| Debt-to-Assets | 46.6% | 44.1% |
| Interest Coverage | 2.35 | 1.57 |
| Asset Turnover | 0.26 | 0.21 |
| Fixed Asset Turnover | 0.33 | 0.29 |
| Payout ratio | 99.2% | 83.2% |
| Dividend yield | 4.24% | 4.17% |
Interpretation of the Ratios
FirstEnergy Corp.
FirstEnergy shows a mixed financial profile with several unfavorable ratios, including a low current ratio of 0.56 and a high debt-to-equity ratio of 1.95, indicating liquidity and leverage concerns. Its return on equity (7.85%) and return on invested capital (3.66%) are also weak, though the weighted average cost of capital (4.85%) is favorable. The company offers a solid dividend yield of 4.24%, supported by free cash flow coverage, but investors should monitor payout sustainability.
Edison International
Edison International also faces challenges with liquidity ratios below 1 (current ratio 0.85, quick ratio 0.78) and a high debt-to-equity ratio of 2.43. Its return on equity (9.93%) and return on invested capital (3.61%) remain unfavorable, while the weighted average cost of capital stands at a favorable 5.94%. The dividend yield is attractive at 4.17%, yet the coverage by free cash flow and interest coverage ratio of 1.84 raise caution about financial flexibility.
Which one has the best ratios?
Both companies exhibit predominantly unfavorable ratios, particularly in leverage, liquidity, and profitability metrics. FirstEnergy’s liquidity position is weaker than Edison’s, but it benefits from a slightly better interest coverage and a marginally more favorable cost of capital. Edison International’s higher leverage and weaker interest coverage contribute to a less favorable overall ratio assessment.
Strategic Positioning
This section compares the strategic positioning of FirstEnergy Corp. and Edison International, including market position, key segments, and exposure to technological disruption:
FirstEnergy Corp.
- Operates in regulated electric market with strong presence in six US states, facing typical utility competition.
- Key segments include regulated distribution (~$6.9B in 2024) and regulated transmission (~$1.8B in 2024).
- Owns diverse generation assets including coal, nuclear, hydro, gas, wind, and solar, mitigating some technological disruption risks.
Edison International
- Serves 15M customers across California, operating in a highly regulated and competitive electric market.
- Focused on electric utility services and competitive power generation, with revenues above $10B historically.
- Primarily electric distribution and transmission infrastructure, with less emphasis on generation diversity in recent data.
FirstEnergy Corp. vs Edison International Positioning
FirstEnergy shows a diversified generation portfolio across multiple states, whereas Edison International concentrates on California’s large customer base. FirstEnergy’s key drivers are regulated distribution and transmission, while Edison combines utility and competitive generation. Both face regulatory and technological challenges.
Which has the best competitive advantage?
Both companies currently shed value as ROIC is below WACC. FirstEnergy’s declining ROIC contrasts with Edison’s improving trend, suggesting Edison may be better positioned for future value creation despite current challenges.
Stock Comparison
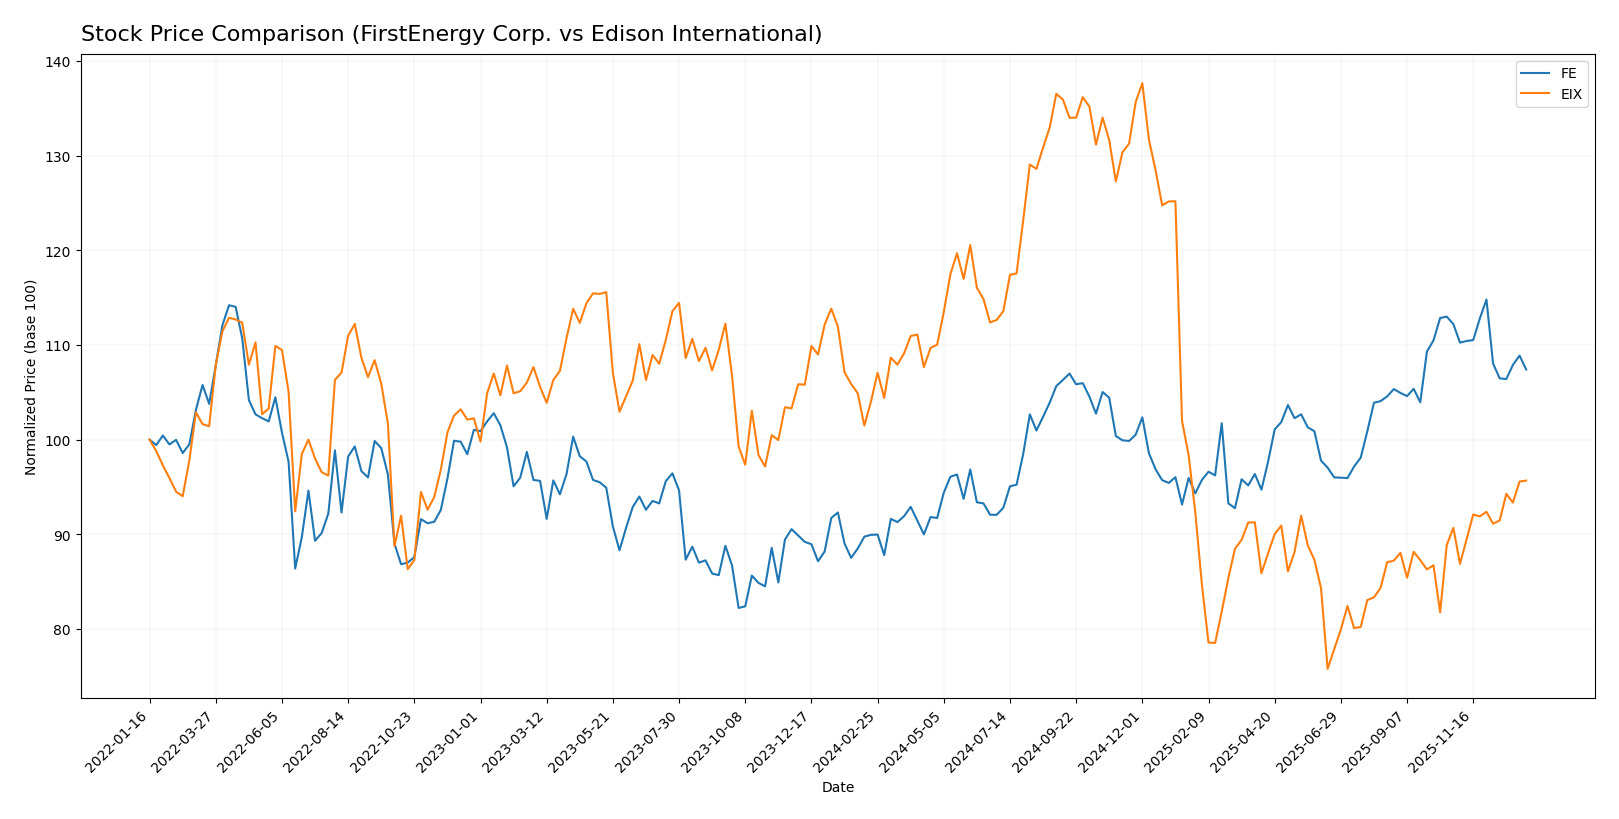
The stock price chart highlights significant movements and contrasting trends between FirstEnergy Corp. and Edison International over the past 12 months, reflecting differing investor sentiment and trading volumes.
Trend Analysis
FirstEnergy Corp. experienced a bullish trend over the past year with a 19.42% price increase, though momentum is slowing as shown by deceleration and a recent slight decline of 4.27%. Volatility remains moderate with a 2.64 std deviation.
Edison International’s stock showed a bearish trend over the same period, declining 8.02% amid high volatility (12.11 std deviation), but recently reversed with a 5.5% gain and accelerating upward momentum.
Comparing the two, FirstEnergy delivered the highest market performance over the year, despite recent weakness, while Edison’s recent recovery contrasts with its overall negative yearly trend.
Target Prices
Analysts present a cautiously optimistic consensus for FirstEnergy Corp. and Edison International with targets above current trading levels.
| Company | Target High | Target Low | Consensus |
|---|---|---|---|
| FirstEnergy Corp. | 54 | 46 | 49.29 |
| Edison International | 70 | 56 | 62 |
The consensus target prices for both companies exceed their current stock prices, indicating moderate upside potential supported by analyst expectations in the regulated electric sector.
Analyst Opinions Comparison
This section compares analysts’ ratings and financial scores for FirstEnergy Corp. and Edison International:
Rating Comparison
FE Rating
- Rating: B, considered Very Favorable.
- Discounted Cash Flow Score: 4 (Favorable).
- ROE Score: 4 (Favorable).
- ROA Score: 3 (Moderate).
- Debt To Equity Score: 1 (Very Unfavorable).
- Overall Score: 3 (Moderate).
EIX Rating
- Rating: B+, considered Very Favorable.
- Discounted Cash Flow Score: 1 (Very Unfavorable).
- ROE Score: 5 (Very Favorable).
- ROA Score: 4 (Favorable).
- Debt To Equity Score: 1 (Very Unfavorable).
- Overall Score: 3 (Moderate).
Which one is the best rated?
Edison International holds a slightly higher rating at B+ compared to FirstEnergy’s B. Despite both having moderate overall scores and identical debt to equity concerns, EIX scores higher on ROE and ROA but lower on discounted cash flow.
Scores Comparison
Here is a comparison of the financial scores for FirstEnergy Corp. and Edison International:
FE Scores
- Altman Z-Score: 0.78, indicating financial distress.
- Piotroski Score: 6, reflecting average financial health.
EIX Scores
- Altman Z-Score: 0.72, indicating financial distress.
- Piotroski Score: 6, reflecting average financial health.
Which company has the best scores?
Both FirstEnergy Corp. and Edison International show Altman Z-Scores in the distress zone and identical Piotroski Scores of 6, indicating similar financial risk and average strength. Neither company clearly outperforms the other based on these scores.
Grades Comparison
This section compares the recent grades and ratings assigned to FirstEnergy Corp. and Edison International by established grading companies:
FirstEnergy Corp. Grades
The table below summarizes recent grades for FirstEnergy Corp. from major financial institutions.
| Grading Company | Action | New Grade | Date |
|---|---|---|---|
| UBS | Maintain | Neutral | 2025-12-17 |
| Mizuho | Maintain | Neutral | 2025-10-24 |
| Scotiabank | Maintain | Sector Outperform | 2025-10-24 |
| UBS | Maintain | Neutral | 2025-10-24 |
| Morgan Stanley | Maintain | Overweight | 2025-10-21 |
| Jefferies | Maintain | Hold | 2025-10-21 |
| Keybanc | Downgrade | Sector Weight | 2025-10-15 |
| Scotiabank | Maintain | Sector Outperform | 2025-10-06 |
| Morgan Stanley | Maintain | Overweight | 2025-09-25 |
| Barclays | Upgrade | Overweight | 2025-08-25 |
Overall, the grades for FirstEnergy Corp. indicate a stable to slightly positive outlook with a mix of Neutral, Hold, and Overweight ratings maintained or upgraded by several firms.
Edison International Grades
The table below lists the latest grades for Edison International by credible grading companies.
| Grading Company | Action | New Grade | Date |
|---|---|---|---|
| Morgan Stanley | Maintain | Underweight | 2025-12-17 |
| JP Morgan | Maintain | Neutral | 2025-12-12 |
| UBS | Maintain | Buy | 2025-12-02 |
| Ladenburg Thalmann | Maintain | Neutral | 2025-10-30 |
| Barclays | Maintain | Overweight | 2025-10-29 |
| Jefferies | Maintain | Hold | 2025-10-22 |
| Morgan Stanley | Maintain | Underweight | 2025-10-22 |
| Barclays | Maintain | Overweight | 2025-10-21 |
| Jefferies | Downgrade | Hold | 2025-10-02 |
| JP Morgan | Maintain | Neutral | 2025-09-25 |
The ratings for Edison International show a somewhat mixed sentiment, with a notable presence of Buy and Overweight grades but also Underweight and Hold ratings, reflecting varied analyst perspectives.
Which company has the best grades?
Edison International holds a better overall consensus with 20 Buy ratings and a consensus rating of “Buy,” compared to FirstEnergy Corp.’s 9 Buy ratings and a “Hold” consensus. This difference suggests investors may perceive Edison as having higher growth or value potential, though the presence of some Underweight ratings indicates caution among analysts.
Strengths and Weaknesses
Below is a comparison table highlighting the key strengths and weaknesses of FirstEnergy Corp. (FE) and Edison International (EIX) based on their latest financial and operational data.
| Criterion | FirstEnergy Corp. (FE) | Edison International (EIX) |
|---|---|---|
| Diversification | Primarily focused on regulated distribution & transmission with limited diversification; competitive energy services phased out | Focus on electric utility and competitive power generation segments; more balanced within energy sector |
| Profitability | Net margin 7.26% (neutral), ROIC 3.66% (unfavorable), declining ROIC trend, value destroying | Net margin 8.78% (neutral), ROIC 3.61% (unfavorable), improving ROIC trend but still value destroying |
| Innovation | Limited innovation visible; traditional utility model | Moderate innovation with some competitive power generation exposure |
| Global presence | Mostly US-regulated markets, no significant global footprint | Primarily US-focused, limited international operations |
| Market Share | Strong in regulated distribution segment (approx. $6.8B revenue in 2024) | Strong in electric utility segment (approx. $10.6B revenue in 2011), stable market presence |
Key takeaways: Both companies face challenges in profitability, with ROIC below WACC indicating value destruction. Edison International shows improving profitability trends, while FirstEnergy’s profitability is declining. Diversification is limited for both, focused largely on regulated markets, which entails regulatory risk but provides stable revenues. Investors should weigh these factors carefully with risk management in mind.
Risk Analysis
Below is a comparison of key risks for FirstEnergy Corp. (FE) and Edison International (EIX) based on the most recent data from 2024.
| Metric | FirstEnergy Corp. (FE) | Edison International (EIX) |
|---|---|---|
| Market Risk | Beta 0.63, moderate volatility | Beta 0.83, higher volatility |
| Debt level | Debt/Equity 1.95 (unfavorable) | Debt/Equity 2.43 (unfavorable) |
| Regulatory Risk | High, utilities sector heavily regulated | High, California’s strict energy regulations |
| Operational Risk | Aging infrastructure, low asset turnover | Large scale operations, moderate asset turnover |
| Environmental Risk | Coal and nuclear exposure, transition risks | Exposure to renewables and natural gas, transition risks |
| Geopolitical Risk | Low, primarily US operations | Low, primarily US operations |
Both companies face significant debt-related risks, with debt-to-equity ratios near 2 or above, indicating financial leverage that could constrain flexibility. Market risk is moderate, with EIX showing slightly higher volatility. Regulatory risk remains high for both due to the heavily regulated U.S. utility sector, particularly California for Edison. Environmental transition pressures are notable, especially for FirstEnergy with coal assets. Operational risks include aging infrastructure and relatively low asset turnover for both. Geopolitical risk is minimal given their primarily domestic focus.
The most impactful and likely risks are the high leverage and regulatory environment, which could limit growth and affect profitability. FirstEnergy’s Altman Z-Score in the distress zone signals elevated bankruptcy risk, a critical caution for investors. Edison also shows financial distress signals despite a slightly better return on equity, emphasizing the need for careful risk management.
Which Stock to Choose?
FirstEnergy Corp. (FE) shows mixed income evolution with a favorable gross margin and EBIT margin but declining net margin and EPS over the 2020-2024 period. Its financial ratios are slightly unfavorable overall, with high debt levels and weak liquidity. The company’s profitability is low and decreasing, and the MOAT evaluation is very unfavorable, indicating value destruction. FE’s rating is moderate overall but has a very favorable grade B.
Edison International (EIX) demonstrates favorable income growth, including net income and EPS, with solid margins. Financial ratios are unfavorable overall, mainly due to high debt and weak interest coverage, despite a good dividend yield. Its MOAT status is slightly unfavorable with growing profitability, suggesting improving efficiency. EIX holds a very favorable B+ rating but a low discounted cash flow score.
For investors prioritizing growth and improving profitability, Edison International might appear more attractive given its favorable income growth and rising ROIC trend. Conversely, those focused on a stable rating and dividend yield might find FirstEnergy’s profile more aligned with their preferences despite its value erosion. Ultimately, the choice could depend on individual risk tolerance and investment strategy.
Disclaimer: Investment carries a risk of loss of initial capital. The past performance is not a reliable indicator of future results. Be sure to understand risks before making an investment decision.
Go Further
I encourage you to read the complete analyses of FirstEnergy Corp. and Edison International to enhance your investment decisions: