In the evolving landscape of regulated electric utilities, Exelon Corporation (EXC) and Edison International (EIX) stand out as key players shaping the industry’s future. Both companies operate within the U.S. energy sector, focusing on electricity generation and distribution, yet they differ in scale, regional presence, and innovation strategies. This article will help you identify which company presents the most compelling investment opportunity in 2026.
Table of contents
Companies Overview
I will begin the comparison between Exelon Corporation and Edison International by providing an overview of these two companies and their main differences.
Exelon Corporation Overview
Exelon Corporation is a utility services holding company operating in the United States and Canada. It focuses on energy generation, delivery, and marketing, owning nuclear, fossil, wind, hydroelectric, biomass, and solar facilities. Exelon also sells electricity, natural gas, and renewable energy products to wholesale and retail customers. The company supports a wide range of clients, including municipalities, cooperatives, and commercial entities, emphasizing regulated electric services.
Edison International Overview
Edison International generates and distributes electric power primarily across Southern, Central, and Coastal California. It serves approximately 15 million customers spanning residential, commercial, industrial, and public sectors. The company operates extensive transmission and distribution infrastructure, including thousands of circuit-miles of overhead and underground lines and numerous substations. Edison International focuses on energy solutions with a strong regional presence in California.
Key similarities and differences
Both companies operate in the regulated electric utility sector, focusing on electricity generation and distribution. Exelon has a broader geographic footprint, including multiple energy sources such as nuclear and renewables, while Edison International concentrates on electric delivery within California. Exelon’s business model includes a diverse energy portfolio and marketing services, whereas Edison emphasizes transmission infrastructure and regional service coverage. Both serve a mix of residential and commercial customers but differ in scale and market reach.
Income Statement Comparison
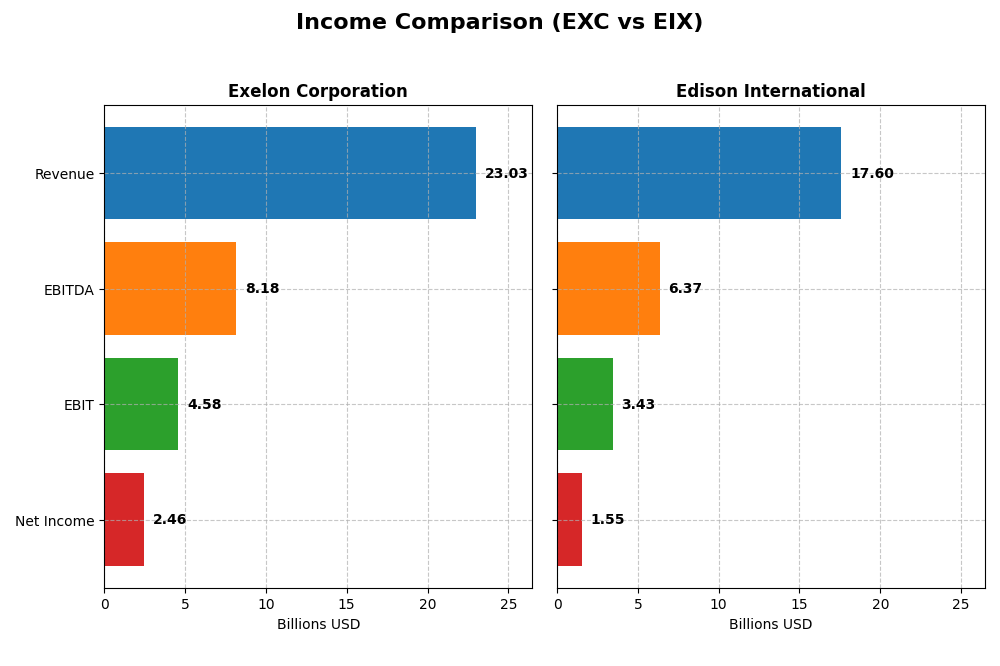
The table below compares the latest fiscal year income statement metrics for Exelon Corporation and Edison International, providing a snapshot of their financial performance in 2024.
| Metric | Exelon Corporation | Edison International |
|---|---|---|
| Market Cap | 43.8B | 23.5B |
| Revenue | 23.0B | 17.6B |
| EBITDA | 8.18B | 6.37B |
| EBIT | 4.58B | 3.43B |
| Net Income | 2.46B | 1.55B |
| EPS | 2.45 | 3.33 |
| Fiscal Year | 2024 | 2024 |
Income Statement Interpretations
Exelon Corporation
Exelon’s revenue declined by 30.3% over 2020-2024, yet net income grew 25.3%, supported by improved net margins rising 79.8%. Margins remain favorable with a gross margin of 40.8% and EBIT margin near 19.9%. In 2024, revenue growth slowed to 6%, while EPS rose 4.7%, but net margin slightly contracted by 0.3%.
Edison International
Edison International showed steady revenue growth of 29.6% from 2020 to 2024, with net income up 77.5% and net margin growth near 37%. Margins are solid, with a gross margin of 41.0% and EBIT margin at 19.5%. In 2024, revenue advanced 7.7% and EBIT grew 9.8%, while net margin improved modestly by 2%.
Which one has the stronger fundamentals?
Both companies demonstrate favorable income statement fundamentals, but Edison International’s stronger revenue and net income growth, combined with consistent margin expansion, contrast with Exelon’s revenue decline despite margin gains. Edison’s higher proportion of favorable growth metrics and lower neutral/unfavorable ratings suggest comparatively stronger income fundamentals.
Financial Ratios Comparison
The table below presents a side-by-side comparison of key financial ratios for Exelon Corporation (EXC) and Edison International (EIX) based on their most recent fiscal year data (2024).
| Ratios | Exelon Corporation (EXC) | Edison International (EIX) |
|---|---|---|
| ROE | 9.14% | 9.93% |
| ROIC | 3.93% | 3.61% |
| P/E | 15.35 | 19.93 |
| P/B | 1.40 | 1.98 |
| Current Ratio | 0.87 | 0.85 |
| Quick Ratio | 0.78 | 0.78 |
| D/E (Debt-to-Equity) | 1.73 | 2.43 |
| Debt-to-Assets | 43.3% | 44.1% |
| Interest Coverage | 2.26 | 1.57 |
| Asset Turnover | 0.21 | 0.21 |
| Fixed Asset Turnover | 0.29 | 0.29 |
| Payout ratio | 61.95% | 83.18% |
| Dividend yield | 4.04% | 4.17% |
Interpretation of the Ratios
Exelon Corporation
Exelon’s ratios present a mixed picture with a favorable net margin of 10.68% and a solid dividend yield of 4.04%, but weaknesses in return on equity (9.14%), return on invested capital (3.93%), and liquidity ratios under 1.0. The payout appears sustainable given the consistent dividend per share, yet high debt levels and low asset turnover may raise concerns about operational efficiency and financial stability.
Edison International
Edison International shows a neutral net margin of 8.78% and a favorable dividend yield of 4.17%, but struggles with high debt-to-equity (2.43) and weak interest coverage (1.84). Returns on equity (9.93%) and invested capital (3.61%) remain below expectations, and liquidity ratios also fall short. Dividend payments are backed by a moderate payout but risk is elevated due to leverage and operational inefficiencies.
Which one has the best ratios?
Comparing the two, Exelon’s ratios are slightly more favorable overall, with better net margin and lower leverage, despite some liquidity and efficiency weaknesses. Edison International faces more pronounced challenges in debt management and interest coverage, leading to a generally less favorable ratio profile. Both pay dividends with yields above 4%, but financial risks differ in nature.
Strategic Positioning
This section compares the strategic positioning of Exelon Corporation and Edison International regarding market position, key segments, and exposure to technological disruption:
Exelon Corporation
- Larger market cap of 44B, operating in US and Canada, faces regulated electric competition
- Diverse segments including nuclear, fossil, wind, hydro, biomass, solar, and energy sales
- No explicit mention of technological disruption exposure or innovation focus
Edison International
- Smaller market cap of 23B, focused on California’s regulated electric market with competitive pressure
- Primarily electric generation and distribution serving 15M customers in California
- No explicit mention of technological disruption exposure or innovation focus
Exelon Corporation vs Edison International Positioning
Exelon has a broader geographic and fuel mix diversification versus Edison’s concentrated California market focus. Exelon’s diversified energy sources provide varied business drivers, while Edison centers on regulated electric distribution with a strong regional customer base.
Which has the best competitive advantage?
Both companies show slightly unfavorable MOAT evaluations, shedding value despite growing ROIC trends. Exelon’s larger scale and diverse assets contrast Edison’s regional focus, but neither currently demonstrates a strong sustainable competitive advantage based on ROIC versus WACC.
Stock Comparison
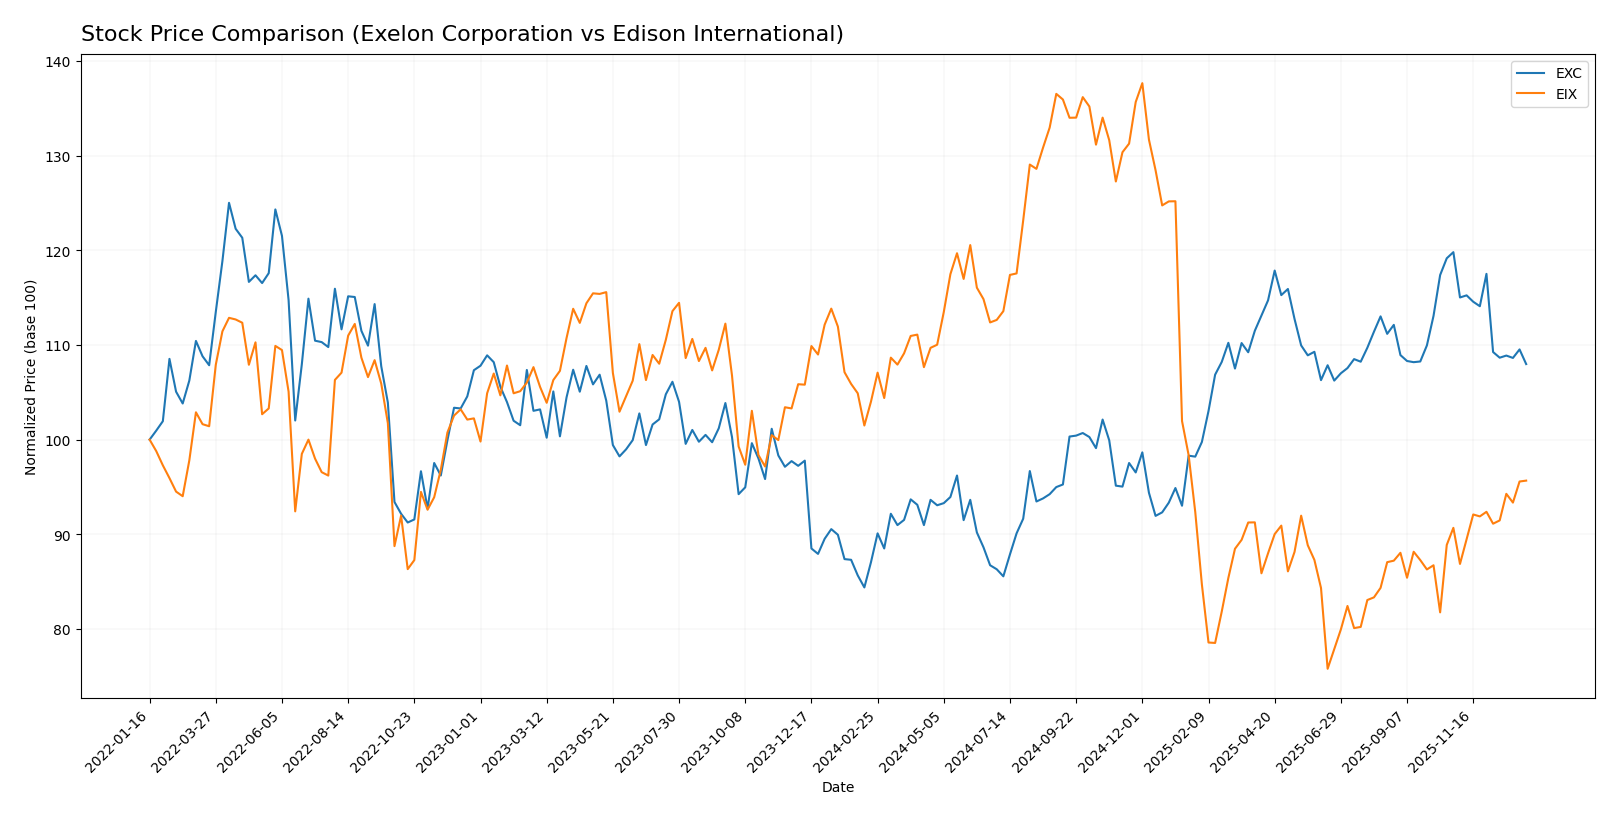
The stock price movements of Exelon Corporation (EXC) and Edison International (EIX) over the past 12 months reveal contrasting trends, with EXC showing a strong positive gain despite recent softness, while EIX experiences an overall decline but recent signs of recovery.
Trend Analysis
Exelon Corporation’s stock posted a bullish trend over the past year with a 24.03% increase, although the rate of growth slowed down recently. The price ranged from a low of 34.31 to a high of 48.04, with moderate volatility (3.75 std deviation).
Edison International’s stock showed a bearish trend overall, declining 8.02%, despite an accelerating recovery in recent months with a 5.5% price gain. The stock experienced higher volatility (12.11 std deviation) and traded between 48.32 and 87.75.
Comparing both, Exelon Corporation delivered the highest market performance over the year, with a solid positive return contrasting with Edison International’s overall negative trend.
Target Prices
Analysts present a clear consensus on target prices for Exelon Corporation and Edison International, reflecting steady growth expectations.
| Company | Target High | Target Low | Consensus |
|---|---|---|---|
| Exelon Corporation | 57 | 39 | 50.86 |
| Edison International | 70 | 56 | 62 |
The consensus target prices for both companies are above their current stock prices, indicating analysts generally expect moderate upside potential. Exelon’s consensus target of 50.86 suggests a roughly 17% increase from the current price of 43.3, while Edison’s target of 62 implies about a 2% upside from 60.99.
Analyst Opinions Comparison
This section compares analysts’ ratings and financial grades for Exelon Corporation and Edison International:
Rating Comparison
EXC Rating
- Rating: B rating considered Very Favorable overall by analysts.
- Discounted Cash Flow Score: Moderate score of 3 indicating balanced valuation.
- ROE Score: Moderate score of 3 showing average efficiency in equity returns.
- ROA Score: Moderate score of 3 indicating average asset utilization.
- Debt To Equity Score: Moderate score of 2 showing manageable financial risk.
- Overall Score: Moderate score of 3 summarizing stable financial standing.
EIX Rating
- Rating: B+ rating considered Very Favorable overall by analysts.
- Discounted Cash Flow Score: Very Unfavorable score of 1 suggesting overvaluation concerns.
- ROE Score: Very Favorable score of 5 reflecting strong profitability from equity.
- ROA Score: Favorable score of 4 reflecting good asset efficiency.
- Debt To Equity Score: Very Unfavorable score of 1 indicating higher financial risk.
- Overall Score: Moderate score of 3 summarizing stable financial standing.
Which one is the best rated?
EIX holds a slightly better overall rating (B+) than EXC (B) and exhibits stronger profitability and asset efficiency scores. However, EXC shows lower financial risk with a better debt-to-equity score, while EIX’s valuation metrics raise concerns. Both have moderate overall scores.
Scores Comparison
The comparison of Exelon Corporation and Edison International scores is as follows:
EXC Scores
- Altman Z-Score: 0.78, indicating financial distress and high bankruptcy risk.
- Piotroski Score: 5, reflecting average financial strength and moderate value.
EIX Scores
- Altman Z-Score: 0.72, indicating financial distress and high bankruptcy risk.
- Piotroski Score: 6, reflecting average financial strength and moderate value.
Which company has the best scores?
Edison International has slightly better scores, with a marginally lower Altman Z-Score risk and a higher Piotroski Score, indicating relatively stronger financial health than Exelon.
Grades Comparison
Here is the comparison of recent grades assigned to Exelon Corporation and Edison International:
Exelon Corporation Grades
The following table summarizes recent official grades for Exelon Corporation:
| Grading Company | Action | New Grade | Date |
|---|---|---|---|
| UBS | Maintain | Neutral | 2025-12-17 |
| JP Morgan | Maintain | Neutral | 2025-12-12 |
| Morgan Stanley | Maintain | Equal Weight | 2025-10-22 |
| Keybanc | Maintain | Underweight | 2025-10-15 |
| Jefferies | Maintain | Buy | 2025-10-15 |
| Barclays | Maintain | Overweight | 2025-10-14 |
| UBS | Maintain | Neutral | 2025-10-10 |
| Morgan Stanley | Maintain | Equal Weight | 2025-09-25 |
| Keybanc | Maintain | Underweight | 2025-07-16 |
| UBS | Maintain | Neutral | 2025-07-11 |
Exelon’s grades mostly range from Neutral to Underweight, with occasional Buy and Overweight ratings, indicating a generally cautious but mixed outlook.
Edison International Grades
The following table summarizes recent official grades for Edison International:
| Grading Company | Action | New Grade | Date |
|---|---|---|---|
| Morgan Stanley | Maintain | Underweight | 2025-12-17 |
| JP Morgan | Maintain | Neutral | 2025-12-12 |
| UBS | Maintain | Buy | 2025-12-02 |
| Ladenburg Thalmann | Maintain | Neutral | 2025-10-30 |
| Barclays | Maintain | Overweight | 2025-10-29 |
| Jefferies | Maintain | Hold | 2025-10-22 |
| Morgan Stanley | Maintain | Underweight | 2025-10-22 |
| Barclays | Maintain | Overweight | 2025-10-21 |
| Jefferies | Downgrade | Hold | 2025-10-02 |
| JP Morgan | Maintain | Neutral | 2025-09-25 |
Edison International shows a wider spread of grades, from Buy and Overweight to Underweight and Hold, reflecting diverse analyst opinions but a slightly more positive consensus.
Which company has the best grades?
Edison International has received a stronger consensus with more Buy and Overweight ratings compared to Exelon’s predominance of Neutral and Underweight grades. This divergence may influence investors by presenting Edison International as having a somewhat more optimistic analyst outlook.
Strengths and Weaknesses
Below is a comparison of key strengths and weaknesses of Exelon Corporation (EXC) and Edison International (EIX) based on the most recent financial and operational data.
| Criterion | Exelon Corporation (EXC) | Edison International (EIX) |
|---|---|---|
| Diversification | Highly diversified with multiple regulated electric and gas utilities across several regions, broad revenue streams (~$29B in utilities revenue FY2024) | Less diversified, mainly focused on electric utility and competitive power generation segments |
| Profitability | Moderate net margin (10.68%), but ROIC (3.93%) below WACC (5%), indicating value destruction despite improving ROIC trend | Lower net margin (8.78%) and ROIC (3.61%) also below WACC (5.94%), value destruction present with improving ROIC |
| Innovation | Moderate investment in energy transition and renewables, but innovation impact not yet reflected strongly in profitability | Limited innovation reported, focus remains on traditional utility operations |
| Global presence | Primarily US-based with strong presence in multiple states via subsidiaries | Mainly US-focused, concentrated in California and some competitive power markets |
| Market Share | Large market share in key regional utility markets, with leading positions in Commonwealth Edison and Pepco Holdings | Strong regional presence in California, but smaller scale compared to EXC |
Key takeaways: Both companies are currently shedding value as their ROICs are below their respective costs of capital, though both show improving profitability trends. Exelon benefits from broader diversification and larger scale, while Edison International’s narrower focus limits its growth potential but may offer more regional specialization. Investors should weigh these factors carefully, considering the slightly unfavorable moat status and liquidity concerns.
Risk Analysis
Below is an overview of the key risks associated with Exelon Corporation (EXC) and Edison International (EIX) based on the most recent 2024 financial data and market conditions.
| Metric | Exelon Corporation (EXC) | Edison International (EIX) |
|---|---|---|
| Market Risk | Moderate beta (0.56), stable utility sector exposure | Slightly higher beta (0.83), more sensitivity to market swings |
| Debt Level | Debt-to-Equity 1.73 (unfavorable), moderate leverage | Debt-to-Equity 2.43 (unfavorable), higher leverage risk |
| Regulatory Risk | High, due to regulated electric industry and multi-state operations | High, heavy exposure to California state regulations |
| Operational Risk | Moderate, diversified energy sources but low asset turnover | Moderate, extensive infrastructure with aging assets |
| Environmental Risk | Moderate, exposure to fossil and nuclear energy regulations | Moderate, focus on California with wildfire and environmental liabilities |
| Geopolitical Risk | Low, primarily US and Canada operations | Low, primarily California-focused operations |
The most significant risks for both companies are regulatory and debt-related. Edison International shows higher financial leverage and weaker interest coverage, increasing its financial risk. Both companies operate in heavily regulated environments, but Edison faces additional operational challenges related to California’s environmental policies and wildfire risks. Exelon’s Altman Z-Score in the distress zone signals caution on financial stability, paralleled by Edison’s similar score. Investors should weigh these factors carefully within their risk management frameworks.
Which Stock to Choose?
Exelon Corporation (EXC) shows a mixed income evolution with favorable net margin (10.68%) and solid profitability but declining revenue over five years. Financial ratios reveal more unfavorable than favorable metrics, with moderate debt levels and a B rating. The company is slightly value-destroying but has a growing ROIC trend.
Edison International (EIX) displays overall favorable income growth, with a net margin of 8.78% and improving earnings. Financial ratios are mostly unfavorable, with higher leverage and weaker interest coverage, but it holds a slightly better B+ rating. Like EXC, it is shedding value but improving profitability.
For investors prioritizing growth and income stability, Exelon’s favorable income statement and decent rating may appear attractive despite some financial weaknesses. Those focused on improving profitability amidst higher risk might see Edison’s recent positive trends and rating as encouraging, though with caution due to financial leverage concerns.
Disclaimer: Investment carries a risk of loss of initial capital. The past performance is not a reliable indicator of future results. Be sure to understand risks before making an investment decision.
Go Further
I encourage you to read the complete analyses of Exelon Corporation and Edison International to enhance your investment decisions: