Eversource Energy and Edison International are two prominent players in the regulated electric utility sector, each serving distinct but overlapping markets in the northeastern and California regions, respectively. Both companies emphasize innovation through renewable energy integration and infrastructure modernization. This comparison aims to evaluate their strategic positioning, financial health, and growth prospects to help you decide which utility stock might be the more attractive investment opportunity in 2026.

Table of contents
Companies Overview
I will begin the comparison between Eversource Energy and Edison International by providing an overview of these two companies and their main differences.
Eversource Energy Overview
Eversource Energy operates as a public utility holding company focused on energy delivery. It manages electric distribution, transmission, natural gas, and water distribution segments. Serving residential and commercial customers primarily in Connecticut, Massachusetts, and New Hampshire, Eversource positions itself as a regulated electric utility with a diversified energy portfolio including solar power facilities.
Edison International Overview
Edison International generates and distributes electric power to 15 million customers across Southern, Central, and Coastal California. Its energy solutions target residential, commercial, industrial, and public sectors. The company maintains extensive transmission and distribution infrastructure, operating thousands of circuit-miles of lines and hundreds of substations, establishing its presence as a major regulated electric utility in the western United States.
Key similarities and differences
Both companies operate in the regulated electric utility industry, focusing on transmission and distribution of electricity to a broad customer base. Eversource has a multi-state presence in the Northeast with additional water and natural gas services, while Edison International concentrates its operations in California with a larger customer base and more extensive electric infrastructure. Their business models share regulatory oversight but differ in geographic scope and service diversification.
Income Statement Comparison
The table below compares the key income statement metrics for Eversource Energy and Edison International for fiscal year 2024, providing a snapshot of their financial performance.
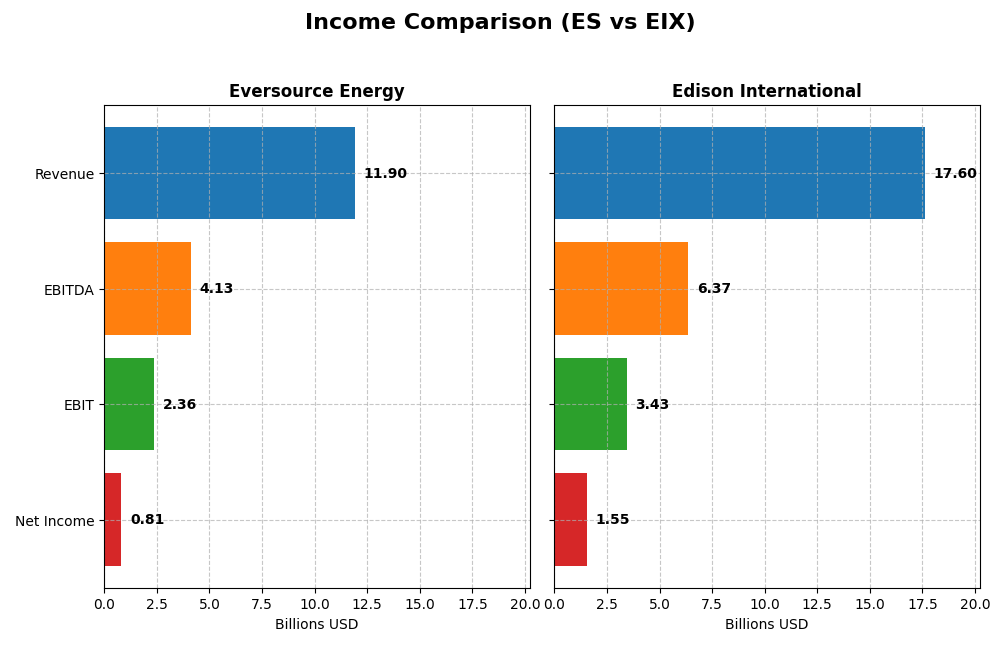
| Metric | Eversource Energy | Edison International |
|---|---|---|
| Market Cap | 25B | 23.5B |
| Revenue | 11.9B | 17.6B |
| EBITDA | 4.13B | 6.37B |
| EBIT | 2.36B | 3.43B |
| Net Income | 812M | 1.55B |
| EPS | 2.27 | 3.33 |
| Fiscal Year | 2024 | 2024 |
Income Statement Interpretations
Eversource Energy
Eversource Energy’s revenue has grown by 33.65% over 2020-2024, though it slightly declined by 0.08% in 2024. Net income showed a negative overall trend, declining by 32.65%, with a significant rebound in 2024. Gross and net margins remain favorable at 31.12% and 6.82%, respectively, with EBIT margin at 19.79%. The recent year saw EBIT and net margin growth surge, indicating margin improvement despite revenue stagnation.
Edison International
Edison International’s revenue increased steadily by 29.61% from 2020 to 2024, with a positive 7.72% growth in 2024. Net income rose strongly, up 77.5% overall, and 2024 also showed improvement. Margins are stable and favorable with a gross margin of 41.01%, EBIT margin of 19.5%, and net margin at 8.78%. Recent year growth in gross profit and EBIT confirms operational strength alongside moderate net margin expansion.
Which one has the stronger fundamentals?
Both companies show favorable income statement evaluations, but Edison International exhibits stronger fundamentals with higher margin levels—especially gross and net margins—and superior net income growth overall and in the latest year. Eversource Energy faces margin pressure and net income decline over the period despite recent improvements. Edison’s consistent revenue and profit expansion with mostly favorable margin trends suggest more robust income fundamentals.
Financial Ratios Comparison
Below is a side-by-side comparison of key financial ratios for Eversource Energy (ES) and Edison International (EIX) for the fiscal year 2024.
| Ratios | Eversource Energy (ES) | Edison International (EIX) |
|---|---|---|
| ROE | 5.40% | 9.93% |
| ROIC | 3.18% | 3.61% |
| P/E | 25.29 | 19.93 |
| P/B | 1.37 | 1.98 |
| Current Ratio | 0.76 | 0.85 |
| Quick Ratio | 0.67 | 0.78 |
| D/E (Debt-to-Equity) | 1.94 | 2.43 |
| Debt-to-Assets | 48.9% | 44.1% |
| Interest Coverage | 2.43 | 1.57 |
| Asset Turnover | 0.20 | 0.21 |
| Fixed Asset Turnover | 0.29 | 0.29 |
| Payout Ratio | 124% | 83% |
| Dividend Yield | 4.91% | 4.17% |
Interpretation of the Ratios
Eversource Energy
Eversource Energy shows an unfavorable overall ratio profile, with key weaknesses in return on equity (5.4%) and return on invested capital (3.18%), alongside low liquidity ratios and high debt-to-equity (1.94). The company’s dividend yield is favorable at 4.91%, supported by a stable payout, though coverage by free cash flow is negative, posing potential sustainability risks.
Edison International
Edison International also faces an unfavorable ratio evaluation, with moderate net margin (8.78%) but weak returns such as ROE at 9.93% and ROIC at 3.61%. Liquidity and interest coverage ratios are below ideal levels. The dividend yield of 4.17% is favorable, yet free cash flow coverage is negative, raising concerns about dividend sustainability and capital management.
Which one has the best ratios?
Both companies exhibit predominantly unfavorable financial ratios, especially regarding returns and liquidity. Eversource Energy holds a slight advantage in dividend yield and lower debt-to-assets ratio, while Edison International has a marginally better net margin and WACC. However, neither company’s ratios distinctly outperform the other, reflecting similar financial challenges.
Strategic Positioning
This section compares the strategic positioning of Eversource Energy and Edison International, including market position, key segments, and exposure to technological disruption:
Eversource Energy
- Operates in regulated electric markets in Northeast US states with moderate competitive pressure.
- Key segments include electric distribution, electric transmission, natural gas distribution, and water distribution.
- Exposure to technological disruption is limited, focusing on regulated transmission and distribution infrastructure.
Edison International
- Serves 15M customers in California with extensive electric utility infrastructure and moderate competition.
- Main business drivers are electric utility and competitive power generation segments.
- Also limited disruption exposure, focusing on large-scale transmission and generation facilities.
Eversource Energy vs Edison International Positioning
Eversource Energy shows a diversified portfolio including water and natural gas segments, while Edison International concentrates on electric utility and power generation. Diversification may spread risk, but concentration can enable focused operational efficiencies.
Which has the best competitive advantage?
Both companies show signs of value destruction with ROIC below WACC. Edison International has a slightly unfavorable moat with improving profitability, while Eversource Energy’s moat is very unfavorable with declining returns. Edison’s improving ROIC trend suggests a more resilient competitive position.
Stock Comparison
The stock price dynamics over the past 12 months reveal contrasting trends for Eversource Energy and Edison International, marked by a bullish but decelerating rise for ES and an accelerating bearish trajectory for EIX.
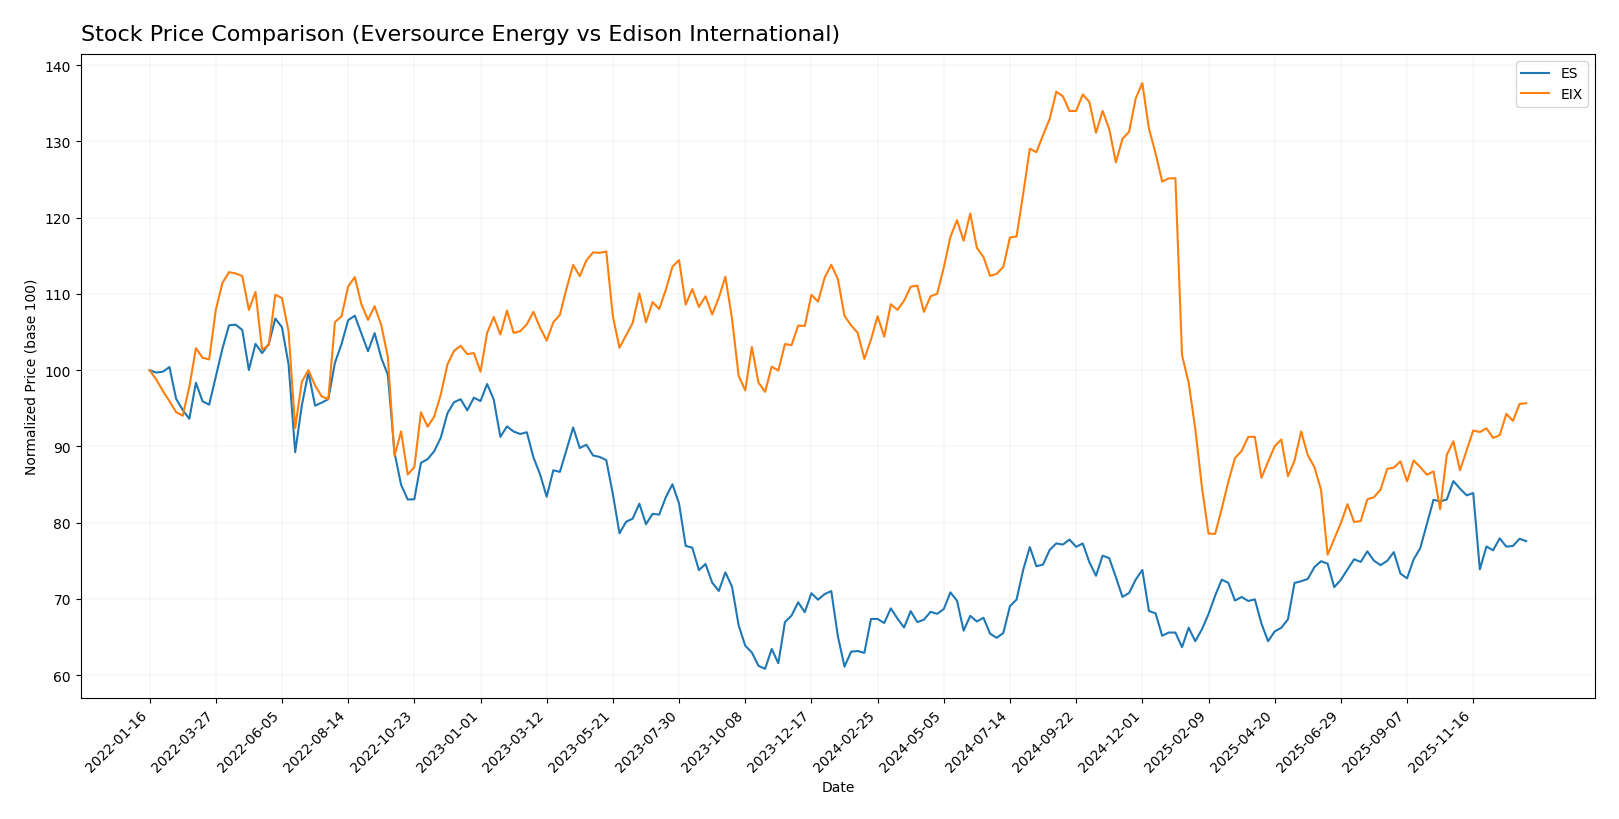
Trend Analysis
Eversource Energy (ES) exhibited a bullish trend with a 15.15% price increase over the past year, though the momentum slowed down recently, showing a 9.21% decline in the last quarter with decreasing buyer dominance.
Edison International (EIX) showed a bearish trend over the year with an 8.02% price drop, but this trend accelerated. Recently, EIX reversed with a 5.5% gain and strong buyer dominance, indicating potential short-term recovery.
Comparing both, Eversource Energy delivered the highest overall market performance with a positive 15.15% return, outperforming Edison International’s negative 8.02% trend over the same period.
Target Prices
Here is the consensus of verified target prices from recognized analysts for these two utilities companies:
| Company | Target High | Target Low | Consensus |
|---|---|---|---|
| Eversource Energy | 81 | 60 | 68 |
| Edison International | 70 | 56 | 62 |
Analysts expect moderate upside potential for Eversource Energy and Edison International compared to their current prices of 67.79 and 60.99 USD respectively. The consensus targets suggest a cautiously optimistic outlook in the regulated electric sector.
Analyst Opinions Comparison
This section compares analysts’ ratings and financial scores for Eversource Energy and Edison International:
Rating Comparison
ES Rating
- Rated C+ with a very favorable status summarizing financial standing.
- Discounted Cash Flow Score of 1, marked very unfavorable for valuation.
- Return on Equity Score of 3, a moderate indicator of profit generation.
- Return on Assets Score of 3, indicating moderate asset utilization.
- Debt to Equity Score of 1, very unfavorable as it indicates high financial risk.
- Overall Score of 2, reflecting a moderate overall financial assessment.
EIX Rating
- Rated B+ with a very favorable status indicating stronger financial health.
- Discounted Cash Flow Score also 1, similarly very unfavorable for valuation.
- Return on Equity Score of 5, very favorable for efficient profit generation.
- Return on Assets Score of 4, favorable for effective asset use.
- Debt to Equity Score also 1, very unfavorable due to similar financial risk.
- Overall Score of 3, a moderate but better overall financial assessment.
Which one is the best rated?
Based strictly on the provided data, Edison International (EIX) holds a better overall rating and outperforms Eversource Energy (ES) in return on equity and assets, though both share challenges in discounted cash flow and debt levels.
Scores Comparison
Here is a comparison of the Altman Z-Score and Piotroski Score for Eversource Energy and Edison International:
ES Scores
- Altman Z-Score: 0.75, indicating financial distress zone risk
- Piotroski Score: 6, reflecting average financial strength
EIX Scores
- Altman Z-Score: 0.72, indicating financial distress zone risk
- Piotroski Score: 6, reflecting average financial strength
Which company has the best scores?
Both ES and EIX exhibit similar risk levels with Altman Z-Scores in the distress zone and identical Piotroski Scores of 6, indicating comparable average financial strength based on the provided data.
Grades Comparison
The grades for Eversource Energy and Edison International from various reputable grading companies are as follows:
Eversource Energy Grades
The table below summarizes recent grades assigned to Eversource Energy by major financial institutions.
| Grading Company | Action | New Grade | Date |
|---|---|---|---|
| UBS | Maintain | Neutral | 2025-12-17 |
| JP Morgan | Maintain | Underweight | 2025-12-12 |
| Janney Montgomery Scott | Upgrade | Buy | 2025-11-24 |
| Scotiabank | Maintain | Sector Underperform | 2025-11-20 |
| Mizuho | Downgrade | Neutral | 2025-11-20 |
| Wells Fargo | Downgrade | Equal Weight | 2025-11-20 |
| UBS | Downgrade | Neutral | 2025-11-06 |
| BMO Capital | Maintain | Market Perform | 2025-11-06 |
| Scotiabank | Maintain | Sector Underperform | 2025-11-06 |
| Mizuho | Maintain | Outperform | 2025-10-27 |
Overall, Eversource Energy shows a mixed pattern with several downgrades from previously higher ratings, trending towards neutral and hold positions.
Edison International Grades
The following table displays recent ratings for Edison International from recognized grading firms.
| Grading Company | Action | New Grade | Date |
|---|---|---|---|
| Morgan Stanley | Maintain | Underweight | 2025-12-17 |
| JP Morgan | Maintain | Neutral | 2025-12-12 |
| UBS | Maintain | Buy | 2025-12-02 |
| Ladenburg Thalmann | Maintain | Neutral | 2025-10-30 |
| Barclays | Maintain | Overweight | 2025-10-29 |
| Jefferies | Maintain | Hold | 2025-10-22 |
| Morgan Stanley | Maintain | Underweight | 2025-10-22 |
| Barclays | Maintain | Overweight | 2025-10-21 |
| Jefferies | Downgrade | Hold | 2025-10-02 |
| JP Morgan | Maintain | Neutral | 2025-09-25 |
Edison International’s grades predominantly range from hold to buy and overweight, with relatively fewer downgrades, indicating a generally more favorable view.
Which company has the best grades?
Edison International has received relatively stronger grades overall, with a consensus rating of “Buy” compared to Eversource Energy’s “Hold.” This suggests Edison is currently viewed with more optimism, potentially offering more attractive opportunities for investors seeking growth or appreciation potential.
Strengths and Weaknesses
The table below summarizes the key strengths and weaknesses of Eversource Energy (ES) and Edison International (EIX) based on their recent financial and operational data:
| Criterion | Eversource Energy (ES) | Edison International (EIX) |
|---|---|---|
| Diversification | Diverse segments including electric distribution (9.07B), transmission (2.12B), natural gas (2.10B), and water (233M) | Focused mainly on electric utility (10.58B) and competitive power generation (2.19B) |
| Profitability | Moderate net margin (6.82%) but unfavorable ROE (5.4%) and ROIC (3.18%) | Slightly better net margin (8.78%) and ROE (9.93%) but still unfavorable ROIC (3.61%) |
| Innovation | Limited data on innovation; stable but declining ROIC trend (-10.38%) indicates challenges | Positive ROIC trend (+86%) suggests improving efficiency and innovation potential |
| Global presence | Primarily regional US utility operations, limited global exposure | Mainly US-focused utility with no significant global presence |
| Market Share | Strong in electric distribution and transmission in its regions | Leading player in its service areas but less diversified |
Key takeaways: Eversource Energy shows strength in diversified utility services but suffers from declining profitability and value destruction. Edison International has improving profitability trends and operational efficiency but remains less diversified and also shows some financial weaknesses. Both companies require cautious evaluation given their unfavorable overall financial ratios.
Risk Analysis
Below is a comparative table highlighting key risks for Eversource Energy (ES) and Edison International (EIX) based on the latest 2024 data:
| Metric | Eversource Energy (ES) | Edison International (EIX) |
|---|---|---|
| Market Risk | Moderate beta 0.77; utility sector sensitive to regulation and interest rates | Moderate beta 0.83; exposed to California market volatility |
| Debt level | High debt-to-equity 1.94; interest coverage 2.12 (neutral) | Higher debt-to-equity 2.43; weaker interest coverage 1.84 (unfavorable) |
| Regulatory Risk | Operates in Northeast US with stable regulatory environment | California regulation and wildfire liabilities pose elevated risks |
| Operational Risk | Diverse energy delivery; moderate asset turnover 0.2 | Extensive grid infrastructure; asset turnover 0.21 but operational complexity |
| Environmental Risk | Exposure to climate policies; moderate transition risks | High exposure to wildfire damage and carbon regulations in California |
| Geopolitical Risk | Low, primarily US-regional operations | Low, focused on US domestic market |
Eversource and Edison both face significant financial leverage risks, with ES slightly better positioned on interest coverage. Regulatory and environmental risks are pronounced for Edison due to California’s wildfire liabilities and stringent climate policies. Market risk remains moderate for both, reflecting utility sector stability but sensitivity to interest rates. Investors should closely monitor debt management and regulatory developments, as these are the most impactful risk factors currently.
Which Stock to Choose?
Eversource Energy (ES) shows a mixed income evolution with strong recent EBIT and net margin growth but overall declining net income and EPS over 2020-2024. Its financial ratios are largely unfavorable, including weak returns and liquidity, and it carries high debt levels. The company is rated C+ with a very favorable overall rating, though its value creation is very unfavorable with declining profitability.
Edison International (EIX) demonstrates favorable income growth across revenue, net income, and EPS over the period, supported by solid gross and EBIT margins. Financial ratios remain mostly unfavorable with some neutral metrics; debt is significant but with improving returns. EIX holds a B+ rating, also with a very favorable overall rating, and a slightly unfavorable moat due to value destruction but improving profitability.
Investors prioritizing growth and improving profitability might find Edison International more aligned with their profile, given its favorable income trend and improving returns despite financial challenges. Conversely, those focused on stable dividend yield and a company with a longer history of value creation might see Eversource Energy as fitting, though caution is warranted due to its declining profitability and weaker ratios.
Disclaimer: Investment carries a risk of loss of initial capital. The past performance is not a reliable indicator of future results. Be sure to understand risks before making an investment decision.
Go Further
I encourage you to read the complete analyses of Eversource Energy and Edison International to enhance your investment decisions: