Edison International (EIX) and Evergy, Inc. (EVRG) are two prominent players in the regulated electric utility industry, each serving distinct yet overlapping regional markets in the United States. Both companies emphasize innovation in energy generation and distribution, balancing traditional power sources with renewable investments. This comparison aims to provide investors with a clear understanding of their strengths and potential, helping you decide which company fits best in your investment portfolio.
Table of contents
Companies Overview
I will begin the comparison between Edison International and Evergy, Inc. by providing an overview of these two companies and their main differences.
Edison International Overview
Edison International operates in the regulated electric sector, generating and distributing power to 15M customers across Southern, Central, and Coastal California. Founded in 1886 and headquartered in Rosemead, CA, it maintains extensive transmission and distribution systems, including 39,000 circuit-miles of overhead lines and 31,000 circuit-miles underground. The company focuses on delivering electricity and energy solutions to diverse customer segments.
Evergy, Inc. Overview
Evergy, Inc. is a regulated electric utility serving approximately 1.62M customers in Kansas and Missouri. Established in 2017 and based in Kansas City, MO, Evergy generates electricity from a mix of coal, hydroelectric, landfill gas, uranium, natural gas, oil, and renewables like solar and wind. Its infrastructure includes 10,100 circuit miles of transmission lines and over 52,800 circuit miles of distribution lines, serving residential, commercial, industrial, and municipal clients.
Key similarities and differences
Both Edison International and Evergy operate in the regulated electric utility sector, focusing on power generation, transmission, and distribution. They serve a broad customer base including residential and commercial users. However, Edison International has a longer history, a larger customer base, and operates exclusively in California, while Evergy, newer and smaller, covers Kansas and Missouri with a more diverse generation mix emphasizing renewables. Their transmission and distribution network sizes also differ significantly.
Income Statement Comparison
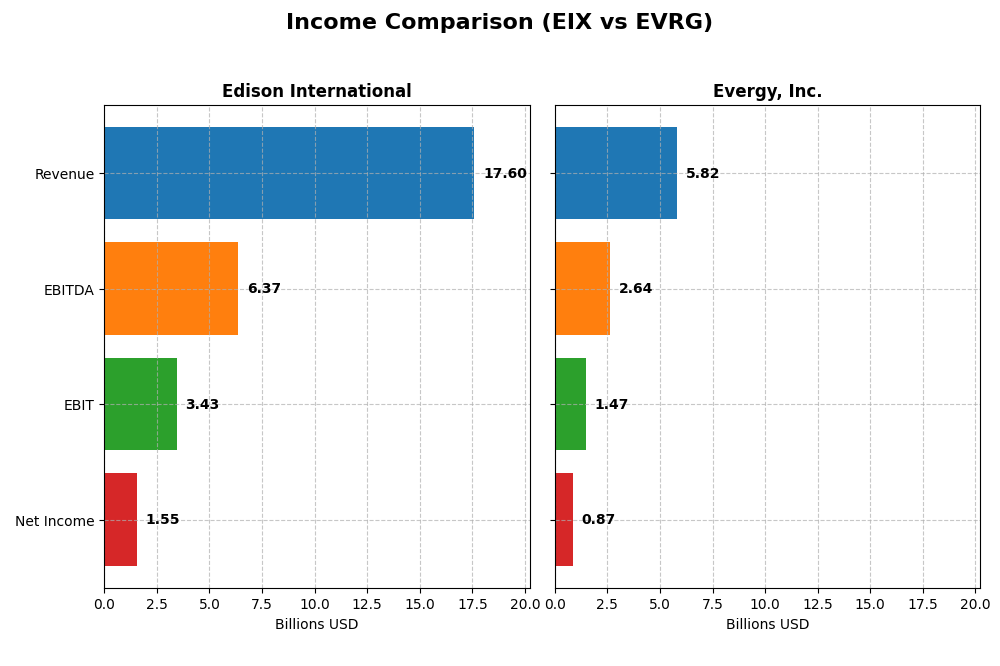
This table compares key income statement metrics for Edison International and Evergy, Inc. for the fiscal year 2024, providing a snapshot of their financial performance.
| Metric | Edison International | Evergy, Inc. |
|---|---|---|
| Market Cap | 23.5B | 16.8B |
| Revenue | 17.6B | 5.8B |
| EBITDA | 6.37B | 2.64B |
| EBIT | 3.43B | 1.47B |
| Net Income | 1.55B | 873.5M |
| EPS | 3.33 | 3.79 |
| Fiscal Year | 2024 | 2024 |
Income Statement Interpretations
Edison International
Edison International’s revenue increased steadily from $13.6B in 2020 to $17.6B in 2024, with net income rising from $739M to $1.28B over the same period. Gross and EBIT margins remained favorable, around 41% and 19.5% respectively, despite an unfavorable interest expense ratio near 10.6%. The 2024 fiscal year showed moderate revenue growth of 7.7%, with improving profitability and stable net margins.
Evergy, Inc.
Evergy’s revenue rose from $4.9B in 2020 to $5.8B in 2024, alongside net income growth from $618M to $873M. The company maintained a solid gross margin of 32.6% and an EBIT margin of 25.3%, with a neutral interest expense level near 9.7%. In 2024, revenue growth was moderate at 6.2%, while net margin and EPS growth were notably favorable, indicating strengthening operational efficiency.
Which one has the stronger fundamentals?
Both Edison International and Evergy exhibit favorable income statement trends with solid margin profiles and positive earnings growth. Edison leads in absolute revenue and net income growth percentages, while Evergy shows higher EBIT and net margins with more pronounced EPS improvement. Interest expenses weigh more heavily on Edison, but overall, both companies present robust and improving fundamentals.
Financial Ratios Comparison
The table below presents a side-by-side comparison of key financial ratios for Edison International (EIX) and Evergy, Inc. (EVRG) based on their latest fiscal year 2024 data.
| Ratios | Edison International (EIX) | Evergy, Inc. (EVRG) |
|---|---|---|
| ROE | 9.93% | 8.77% |
| ROIC | 3.61% | 4.52% |
| P/E | 19.93 | 16.23 |
| P/B | 1.98 | 1.42 |
| Current Ratio | 0.85 | 0.50 |
| Quick Ratio | 0.78 | 0.27 |
| D/E (Debt-to-Equity) | 2.43 | 1.41 |
| Debt-to-Assets | 44.12% | 43.58% |
| Interest Coverage | 1.57 | 2.57 |
| Asset Turnover | 0.21 | 0.18 |
| Fixed Asset Turnover | 0.29 | 0.23 |
| Payout ratio | 83.18% | 68.31% |
| Dividend yield | 4.17% | 4.21% |
Interpretation of the Ratios
Edison International
Edison International exhibits predominantly unfavorable financial ratios, including weak return on equity (9.93%) and return on invested capital (3.61%), alongside a low current ratio of 0.85, suggesting liquidity concerns. Its dividend yield is robust at 4.17%, reflecting a favorable shareholder return. However, the payout’s sustainability remains a risk given negative free cash flow to equity.
Evergy, Inc.
Evergy shows a mixed ratio profile with favorable net margin (15.0%) and price-to-book ratio (1.42), but faces challenges such as low current (0.5) and quick ratios (0.27), indicating liquidity issues. The dividend yield at 4.21% is attractive, supported by some favorable metrics, though free cash flow to equity is negative, which could pressure future distributions.
Which one has the best ratios?
Comparing both, Evergy holds a slightly more favorable ratio structure with better profitability and valuation metrics, despite liquidity weaknesses. Edison International’s ratios are more frequently unfavorable, particularly in returns and liquidity. Overall, Evergy’s financial indicators suggest a marginally stronger standing in ratio analysis for 2024.
Strategic Positioning
This section compares the strategic positioning of Edison International and Evergy, Inc., covering market position, key segments, and exposure to technological disruption:
Edison International
- Large market cap of 23B, serving 15M customers in California; faces typical regulated electric sector competition.
- Diversified revenue from Electric Utility (approx. 10.6B) and Competitive Power Generation (2.2B).
- Moderate exposure to technological disruption with established transmission and distribution infrastructure.
Evergy, Inc.
- Smaller market cap of 16.8B, serving 1.6M customers in Kansas and Missouri; operates in a competitive regulated electric market.
- Revenue mainly from Electric Utility segment (~2.7B), focused on several generation sources including renewables.
- Exposure includes multiple generation technologies, including coal, hydro, and renewables, reflecting some adaptation to disruption.
Edison International vs Evergy, Inc. Positioning
Edison International has a more diversified revenue base and a larger customer footprint, with significant infrastructure in California. Evergy, Inc. is more regionally concentrated, with a focus on varied generation sources, including renewables, but with smaller scale and employee base.
Which has the best competitive advantage?
Both companies show slightly unfavorable moat evaluations, shedding value but with growing ROIC trends. Neither currently demonstrates a strong economic moat, indicating competitive pressures and limited sustainable advantage based on ROIC versus WACC data.
Stock Comparison
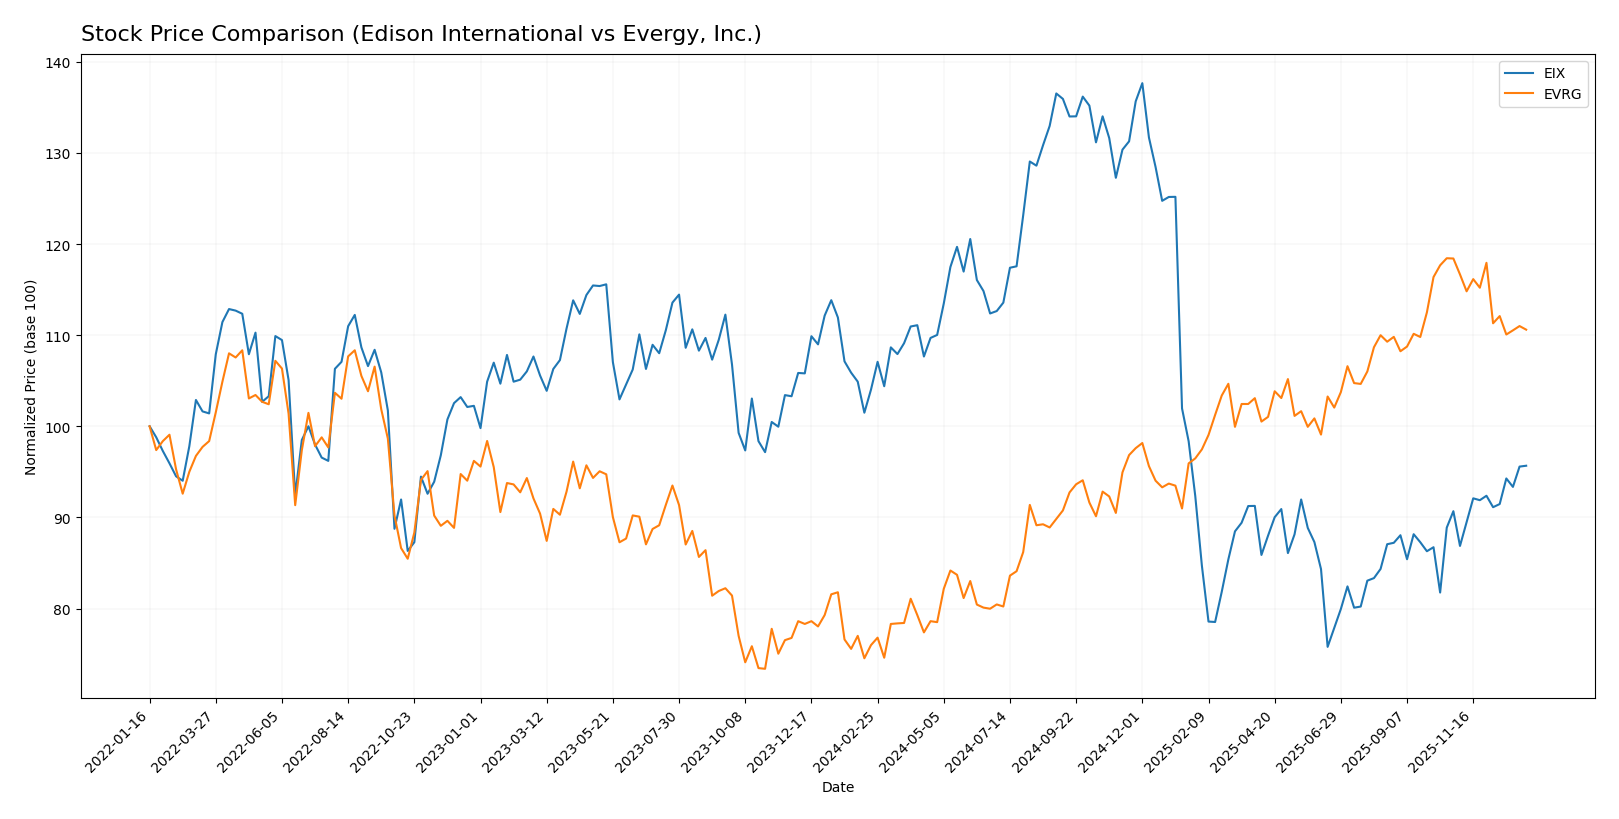
The stock price movements over the past 12 months show contrasting trends, with Edison International experiencing a bearish trajectory while Evergy, Inc. delivered a strong bullish performance, both demonstrating notable price ranges and shifts in trading dynamics.
Trend Analysis
Edison International’s stock fell by 8.02% over the past year, marking a bearish trend with accelerating decline and high volatility, ranging between 48.32 and 87.75. A recent rebound of 5.5% indicates a short-term recovery phase.
Evergy, Inc. posted a 45.55% gain over the last year, reflecting a bullish trend with decelerating momentum and moderate volatility, with prices fluctuating between 49.12 and 77.98. The last quarter saw a 6.59% decline, suggesting a near-term pullback.
Comparing the two, Evergy, Inc. showed the highest market performance with a substantial price increase, while Edison International’s stock has been under pressure despite a recent upward correction.
Target Prices
Analysts present a clear target consensus for Edison International and Evergy, Inc., indicating potential price ranges.
| Company | Target High | Target Low | Consensus |
|---|---|---|---|
| Edison International | 70 | 56 | 62 |
| Evergy, Inc. | 93 | 76 | 82.67 |
For Edison International, the consensus target of 62 is slightly above its current price of 60.99, suggesting modest upside potential. Evergy’s target consensus of 82.67 is notably higher than its current 72.82, indicating stronger expected growth.
Analyst Opinions Comparison
This section compares analysts’ ratings and grades for Edison International and Evergy, Inc.:
Rating Comparison
Edison International Rating
- Rating: B+, classified as Very Favorable overall.
- Discounted Cash Flow Score: 1, indicating Very Unfavorable valuation.
- ROE Score: 5, a Very Favorable indicator of profit generation efficiency.
- ROA Score: 4, a Favorable measure of asset utilization.
- Debt To Equity Score: 1, Very Unfavorable, indicating higher financial risk.
- Overall Score: 3, Moderate overall financial standing.
Evergy, Inc. Rating
- Rating: B-, classified as Very Favorable overall.
- Discounted Cash Flow Score: 1, indicating Very Unfavorable valuation.
- ROE Score: 3, a Moderate indicator of profit generation efficiency.
- ROA Score: 3, a Moderate measure of asset utilization.
- Debt To Equity Score: 2, Moderate financial risk.
- Overall Score: 2, Moderate overall financial standing.
Which one is the best rated?
Edison International holds a higher rating (B+) compared to Evergy’s B-, with stronger scores in ROE and ROA. However, Edison has a higher financial risk indicated by a lower debt-to-equity score. Overall, Edison appears better rated by analysts based on these metrics.
Scores Comparison
Here is a comparison of the Altman Z-Score and Piotroski Score for Edison International and Evergy, Inc.:
Edison International Scores
- Altman Z-Score: 0.72, indicating financial distress risk.
- Piotroski Score: 6, reflecting average financial strength.
Evergy, Inc. Scores
- Altman Z-Score: 0.82, indicating financial distress risk.
- Piotroski Score: 5, reflecting average financial strength.
Which company has the best scores?
Both Edison International and Evergy, Inc. fall into the distress zone for Altman Z-Score with Edison slightly lower. Edison has a marginally higher Piotroski Score, suggesting slightly stronger financial health compared to Evergy based on these metrics.
Grades Comparison
The following sections present the available reliable grades and ratings for Edison International and Evergy, Inc.:
Edison International Grades
This table shows recent grades from verified financial institutions for Edison International.
| Grading Company | Action | New Grade | Date |
|---|---|---|---|
| Morgan Stanley | Maintain | Underweight | 2025-12-17 |
| JP Morgan | Maintain | Neutral | 2025-12-12 |
| UBS | Maintain | Buy | 2025-12-02 |
| Ladenburg Thalmann | Maintain | Neutral | 2025-10-30 |
| Barclays | Maintain | Overweight | 2025-10-29 |
| Jefferies | Maintain | Hold | 2025-10-22 |
| Morgan Stanley | Maintain | Underweight | 2025-10-22 |
| Barclays | Maintain | Overweight | 2025-10-21 |
| Jefferies | Downgrade | Hold | 2025-10-02 |
| JP Morgan | Maintain | Neutral | 2025-09-25 |
Edison International’s grades display a mix of holds, neutrals, and overweight ratings, with some underweight assessments, indicating a cautious but somewhat positive stance overall.
Evergy, Inc. Grades
This table shows recent grades from verified financial institutions for Evergy, Inc.
| Grading Company | Action | New Grade | Date |
|---|---|---|---|
| Mizuho | Downgrade | Neutral | 2025-12-18 |
| UBS | Maintain | Buy | 2025-12-17 |
| Citigroup | Maintain | Buy | 2025-11-10 |
| Jefferies | Maintain | Buy | 2025-10-09 |
| Mizuho | Maintain | Outperform | 2025-08-08 |
| Mizuho | Maintain | Outperform | 2025-07-18 |
| Barclays | Maintain | Overweight | 2025-05-30 |
| Citigroup | Maintain | Buy | 2025-05-16 |
| UBS | Upgrade | Buy | 2025-04-28 |
| Barclays | Maintain | Overweight | 2025-04-22 |
Evergy, Inc. shows predominantly buy and outperform ratings, with a recent downgrade from outperform to neutral by Mizuho, suggesting generally strong but slightly moderated confidence.
Which company has the best grades?
Both Edison International and Evergy, Inc. carry a consensus “Buy” rating; however, Evergy, Inc. has more consistent buy and outperform grades from major institutions, while Edison International features more mixed ratings including several hold and underweight grades. This could influence investors’ perception of relative strength and risk between the two.
Strengths and Weaknesses
Below is a comparative overview of the strengths and weaknesses of Edison International (EIX) and Evergy, Inc. (EVRG) based on recent financial performance, market position, and operational metrics.
| Criterion | Edison International (EIX) | Evergy, Inc. (EVRG) |
|---|---|---|
| Diversification | Moderate: Mix of Competitive Power Generation and Electric Utility segments; some revenue concentration risk | Low: Primarily Electric Utility segment revenue, limited diversification |
| Profitability | Moderate profitability with net margin at 8.78%, but ROIC (3.61%) below WACC (5.94%), indicating value destruction | Better profitability with higher net margin at 15.0%, but ROIC (4.52%) still below WACC (5.36%), also shedding value |
| Innovation | Limited information on innovation; traditional utility with slow asset turnover and low asset efficiency | Similar traditional utility profile with low asset turnover and fixed asset turnover, no major innovation indicators |
| Global presence | Primarily U.S.-focused utility operations, limited international exposure | Also U.S.-focused; no significant global presence |
| Market Share | Established regional presence with sizeable revenue from electric utility segment (~$10.6B in 2011) | Smaller scale with electric utility revenue around $2.7B (2017), indicating smaller market share |
Key takeaways: Both Edison International and Evergy face challenges in profitability as their returns on invested capital remain below their cost of capital, signaling value destruction despite improving ROIC trends. Edison shows more diversification but lower profitability, while Evergy has better margins but less diversification. Both are traditional utilities with limited innovation and predominantly domestic operations, requiring cautious consideration for risk-conscious investors.
Risk Analysis
Below is a comparative table of key risks for Edison International (EIX) and Evergy, Inc. (EVRG) based on the most recent 2024 data.
| Metric | Edison International (EIX) | Evergy, Inc. (EVRG) |
|---|---|---|
| Market Risk | Beta 0.83, moderately less volatile; market sensitive | Beta 0.65, lower volatility; somewhat defensive utility profile |
| Debt level | Debt-to-Equity 2.43 (unfavorable); high leverage risk | Debt-to-Equity 1.41 (unfavorable); high but lower than EIX |
| Regulatory Risk | Significant due to California operations and regulation | Moderate, Kansas and Missouri markets; regulatory environment stable |
| Operational Risk | Large transmission/distribution network in California prone to wildfires and outages | Extensive grid in Midwest; risks from weather and infrastructure aging |
| Environmental Risk | Exposure to wildfire liabilities and transition to renewables | Less exposure to wildfire; diverse generation including renewables |
| Geopolitical Risk | Low; operates in a stable US market | Low; US domestic utility with limited international exposure |
The most critical and impactful risks for both companies center on high debt levels and operational challenges. Edison International faces elevated wildfire-related environmental and regulatory risks in California, increasing potential liabilities. Evergy’s lower beta suggests less market volatility, but its aging infrastructure still poses operational risks. Both companies are in financial distress zones per Altman Z-scores, signaling caution.
Which Stock to Choose?
Edison International (EIX) shows favorable income growth and profitability with a 7.7% revenue increase in 2024 and a 9.93% ROE rated as unfavorable. Its debt levels are high, reflected in an unfavorable debt-to-equity ratio and low current ratio, yielding an overall unfavorable financial ratios evaluation but a very favorable rating of B+.
Evergy, Inc. (EVRG) reports solid income growth with a 6.2% revenue rise and a higher net margin of 15.0%. Despite moderate ROE and debt metrics rated as moderate or unfavorable, EVRG achieves a slightly unfavorable overall ratios opinion and holds a B- rating, indicating a somewhat less favorable but still positive financial standing.
Investors focused on growth might see EVRG’s stronger net margin and income growth as attractive, while those valuing stability and higher overall rating could lean toward EIX, given its very favorable rating despite some weaker financial ratios. The choice may depend on one’s risk tolerance and investment strategy.
Disclaimer: Investment carries a risk of loss of initial capital. The past performance is not a reliable indicator of future results. Be sure to understand risks before making an investment decision.
Go Further
I encourage you to read the complete analyses of Edison International and Evergy, Inc. to enhance your investment decisions: