Unilever PLC and Edgewell Personal Care Company are two prominent players in the Household & Personal Products industry, each with distinct market strategies and innovation approaches. Unilever’s vast portfolio spans beauty, food, and home care, while Edgewell specializes in personal grooming and skin care. Their overlapping consumer focus makes them ideal candidates for comparison. In this article, I will help you identify which company presents the most compelling investment opportunity in 2026.
Table of contents
Companies Overview
I will begin the comparison between Unilever PLC and Edgewell Personal Care Company by providing an overview of these two companies and their main differences.
Unilever PLC Overview
Unilever PLC operates as a fast-moving consumer goods company specializing in Beauty & Personal Care, Foods & Refreshment, and Home Care segments. It offers a broad portfolio of well-known brands such as Dove, Ben & Jerry’s, and Knorr. Headquartered in London, Unilever is a global leader with a market capitalization of approximately 140.6B USD and employs around 116K people worldwide.
Edgewell Personal Care Company Overview
Edgewell Personal Care Company manufactures and markets personal care products globally through Wet Shave, Sun and Skin Care, and Feminine Care segments. Its brands include Schick, Banana Boat, and Playtex. Based in Shelton, Connecticut, Edgewell has a market cap near 847M USD and employs about 6.7K staff, focusing primarily on personal grooming and care products.
Key similarities and differences
Both companies operate in the Household & Personal Products industry, targeting consumer defensive markets with a focus on personal care. Unilever has a more diversified product range including food and home care, while Edgewell concentrates solely on personal care categories. Unilever is significantly larger in scale and global reach, whereas Edgewell maintains a more specialized portfolio with a smaller workforce and market capitalization.
Income Statement Comparison
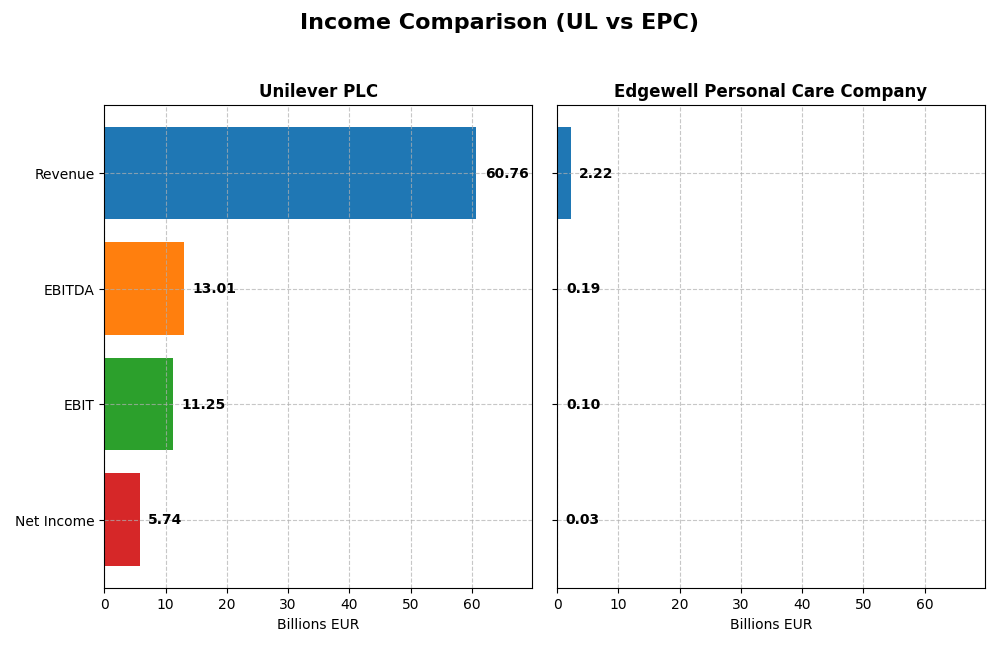
This table compares the key income statement metrics for Unilever PLC and Edgewell Personal Care Company based on their most recent fiscal year data.
| Metric | Unilever PLC (2024) | Edgewell Personal Care Company (2025) |
|---|---|---|
| Market Cap | 140.6B EUR | 847.1M USD |
| Revenue | 60.8B EUR | 2.22B USD |
| EBITDA | 13.0B EUR | 186M USD |
| EBIT | 11.3B EUR | 97M USD |
| Net Income | 5.74B EUR | 25.4M USD |
| EPS | 2.3 EUR | 0.53 USD |
| Fiscal Year | 2024 | 2025 |
Income Statement Interpretations
Unilever PLC
Unilever PLC’s revenue showed a favorable overall growth of 19.79% from 2020 to 2024, with net income increasing modestly by 2.92%. Margins present mixed signals: while gross and EBIT margins remain strong and favorable, net margin declined by 14.08% over the period. The most recent year saw a 1.94% revenue rise but a 13.14% drop in net margin, indicating some pressure on profitability despite operating income growth.
Edgewell Personal Care Company
Edgewell’s revenue experienced a neutral 6.53% growth over 2021-2025, but net income and margins significantly deteriorated. Gross margin remains favorable at 41.6%, yet EBIT and net margins are neutral or unfavorable. The latest fiscal year showed declining revenue (-1.34%) and sharp net income and EPS drops exceeding 70%, reflecting operational and profitability challenges in recent periods.
Which one has the stronger fundamentals?
Unilever PLC exhibits stronger fundamentals overall, marked by consistent revenue expansion, robust gross and EBIT margins, and a favorable global income statement assessment. In contrast, Edgewell faces unfavorable trends in net income growth, margin compression, and EPS declines, resulting in an unfavorable income statement evaluation. These factors suggest Unilever’s financials are comparatively more stable and resilient.
Financial Ratios Comparison
The table below presents a side-by-side comparison of key financial ratios for Unilever PLC and Edgewell Personal Care Company based on their most recent fiscal data.
| Ratios | Unilever PLC (2024 FY) | Edgewell Personal Care Co (2025 FY) |
|---|---|---|
| ROE | 28.7% | 1.6% |
| ROIC | 11.1% | 3.0% |
| P/E | 23.9 | 38.1 |
| P/B | 6.87 | 0.62 |
| Current Ratio | 0.76 | 1.76 |
| Quick Ratio | 0.56 | 0.90 |
| D/E (Debt-to-Equity) | 1.53 | 0.91 |
| Debt-to-Assets | 38.4% | 37.6% |
| Interest Coverage | 8.41 | 1.32 |
| Asset Turnover | 0.76 | 0.59 |
| Fixed Asset Turnover | 5.21 | 6.02 |
| Payout Ratio | 75.2% | 115.4% |
| Dividend Yield | 3.14% | 3.03% |
Interpretation of the Ratios
Unilever PLC
Unilever’s financial ratios show a slightly favorable profile with strong returns on equity (28.73%) and invested capital (11.12%), supported by a low WACC of 4.42%. However, liquidity ratios are weak, with a current ratio of 0.76 and a debt-to-equity ratio of 1.53, which raises concerns about short-term financial flexibility. The company offers a dividend yield of 3.14%, indicating consistent shareholder returns.
Edgewell Personal Care Company
Edgewell’s ratios are more mixed, with unfavorable profitability metrics such as a net margin of 1.14% and return on equity of 1.64%. Its liquidity position is sound, with a current ratio of 1.76 and a favorable price-to-book ratio of 0.62. The dividend yield stands at 3.03%, reflecting a commitment to shareholder returns despite weaker operating performance and low interest coverage ratio (1.32).
Which one has the best ratios?
Comparing the two, Unilever demonstrates stronger profitability and capital efficiency, though it faces liquidity challenges. Edgewell shows better liquidity and valuation multiples but struggles with profitability and interest coverage. Overall, Unilever’s ratios are slightly more favorable due to stronger returns and coverage metrics, while Edgewell maintains a neutral stance with balanced strengths and weaknesses.
Strategic Positioning
This section compares the strategic positioning of Unilever PLC and Edgewell Personal Care Company, including market position, key segments, and exposure to technological disruption:
Unilever PLC
- Market leader with a large $140B market cap and low beta, facing moderate competitive pressure.
- Diversified segments: Beauty & Personal Care, Foods & Refreshment, Home Care with multiple brands.
- Limited explicit exposure to technological disruption mentioned in available data.
Edgewell Personal Care Company
- Smaller $847M market cap with higher beta, indicating greater exposure to market volatility and competitive pressure.
- Focused on personal care: Wet shave, Sun and Skin care, Feminine care segments with specialized product lines.
- No direct information on technological disruption exposure in provided data.
Unilever PLC vs Edgewell Personal Care Company Positioning
Unilever’s diversified portfolio across multiple consumer goods segments contrasts with Edgewell’s concentrated focus on personal care. Unilever benefits from scale and brand variety, while Edgewell’s narrower scope may limit diversification but concentrate expertise.
Which has the best competitive advantage?
Based on MOAT evaluation, Unilever demonstrates a slightly favorable moat with value creation despite declining ROIC, while Edgewell shows a very unfavorable moat, destroying value with sharply declining profitability.
Stock Comparison
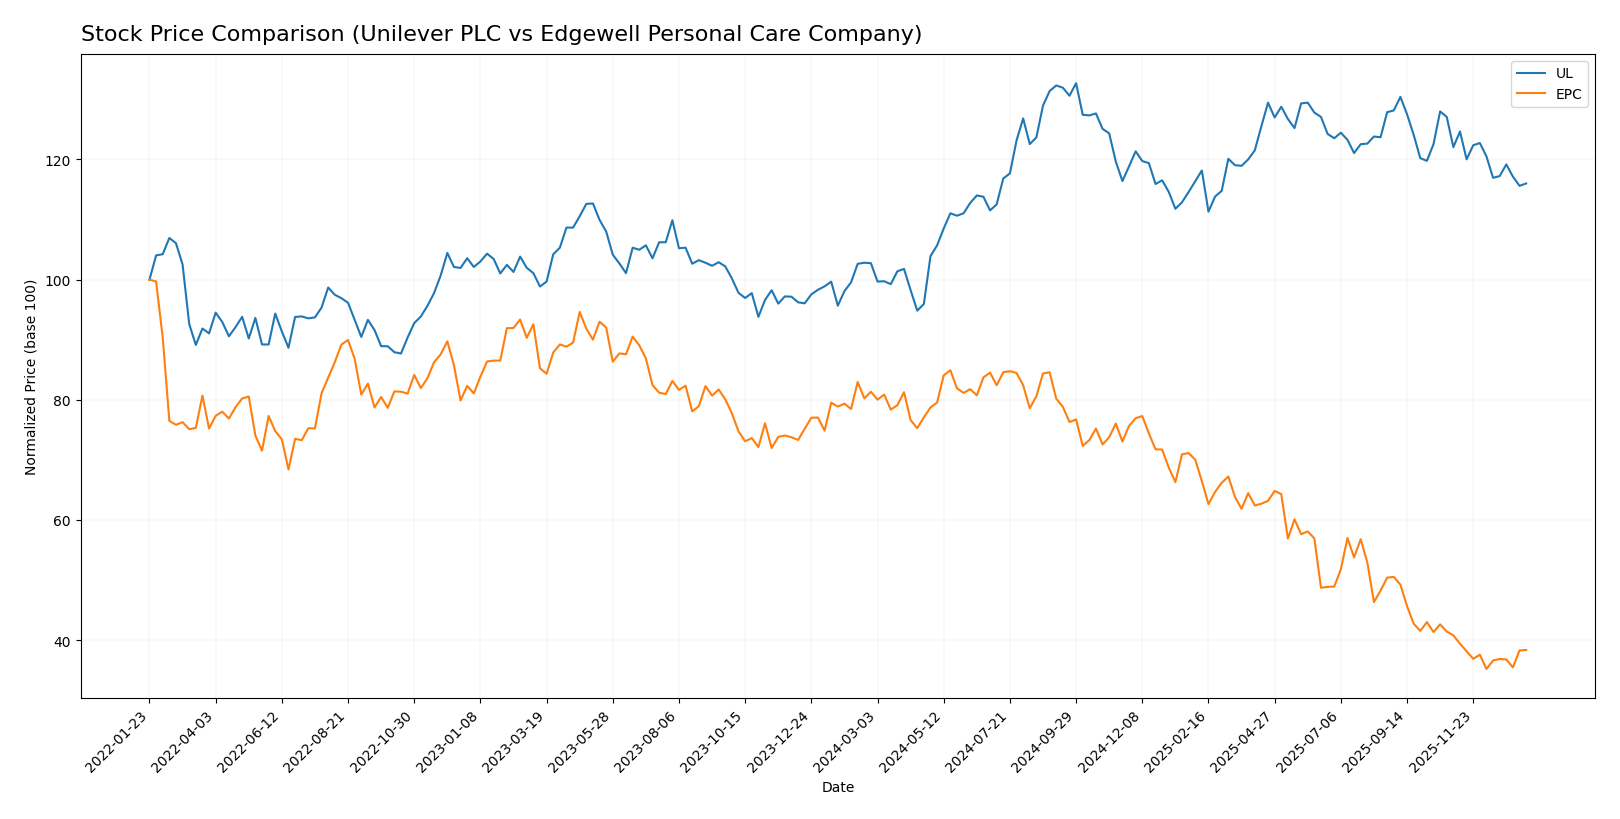
The stock prices of Unilever PLC and Edgewell Personal Care Company have exhibited contrasting dynamics over the past 12 months, with Unilever showing a bullish trend amid decelerating growth, while Edgewell has experienced an accelerated bearish decline.
Trend Analysis
Unilever PLC’s stock rose 12.92% over the past year, indicating a bullish trend with deceleration in momentum. The price ranged from 52.66 to 73.69, and recent weeks show a slight downturn of -4.96%.
Edgewell Personal Care Company’s shares fell sharply by 52.87% over the same period, marking a bearish trend with accelerating decline. Prices fluctuated between 16.73 and 40.38, with a recent decrease of -5.98%.
Comparatively, Unilever delivered the highest market performance with a clear positive return, whereas Edgewell’s stock suffered significant losses, reflecting divergent investor sentiment and market conditions.
Target Prices
Analysts present a clear consensus on target prices for Unilever PLC and Edgewell Personal Care Company.
| Company | Target High | Target Low | Consensus |
|---|---|---|---|
| Unilever PLC | 71 | 60.1 | 65.55 |
| Edgewell Personal Care Company | 23 | 20 | 21.5 |
Unilever’s consensus target of 65.55 is slightly above its current price of 64.42, indicating moderate upside potential. Edgewell’s target consensus at 21.5 is well above its current price of 18.23, suggesting stronger expected growth.
Analyst Opinions Comparison
This section compares analysts’ ratings and grades for Unilever PLC and Edgewell Personal Care Company:
Rating Comparison
Unilever PLC Rating
- Rating: B+, considered very favorable by analysts.
- Discounted Cash Flow Score: 5, indicating very favorable valuation.
- ROE Score: 5, a very favorable indicator of profit generation efficiency.
- ROA Score: 4, favorable asset utilization effectiveness.
- Debt To Equity Score: 1, very unfavorable due to higher financial risk.
- Overall Score: 3, a moderate summary financial standing.
Edgewell Personal Care Company Rating
- Rating: B, also rated very favorable by analysts.
- Discounted Cash Flow Score: 5, also very favorable valuation.
- ROE Score: 2, showing moderate efficiency in generating profits.
- ROA Score: 2, moderate effectiveness in asset utilization.
- Debt To Equity Score: 2, moderate financial risk level.
- Overall Score: 3, also reflecting moderate financial standing.
Which one is the best rated?
Unilever PLC holds a higher rating of B+ compared to Edgewell’s B, with stronger ROE and ROA scores but a weaker debt-to-equity score. Both have the same overall score, indicating a nuanced rating comparison.
Scores Comparison
Here is a comparison of the financial stability and strength scores for Unilever PLC and Edgewell Personal Care Company:
UL Scores
- Altman Z-Score: 4.85, in the safe zone indicating low bankruptcy risk.
- Piotroski Score: 6, classified as average financial strength.
EPC Scores
- Altman Z-Score: 1.44, in the distress zone indicating higher bankruptcy risk.
- Piotroski Score: 6, classified as average financial strength.
Which company has the best scores?
Based strictly on the data, Unilever PLC has a significantly stronger Altman Z-Score, placing it in the safe zone, while Edgewell Personal Care is in distress. Both have the same average Piotroski Score.
Grades Comparison
The following section compares the recent grades provided by reputable grading companies for Unilever PLC and Edgewell Personal Care Company:
Unilever PLC Grades
This table summarizes the recent grade updates from recognized financial institutions for Unilever PLC:
| Grading Company | Action | New Grade | Date |
|---|---|---|---|
| Erste Group | Downgrade | Hold | 2024-11-19 |
| B of A Securities | Upgrade | Buy | 2024-08-22 |
| JP Morgan | Upgrade | Overweight | 2024-05-23 |
| Argus Research | Maintain | Buy | 2024-05-08 |
| Morgan Stanley | Downgrade | Underweight | 2024-02-27 |
| Bernstein | Upgrade | Market Perform | 2022-03-14 |
| Bernstein | Upgrade | Market Perform | 2022-03-13 |
| Bernstein | Upgrade | Market Perform | 2021-11-01 |
| Bernstein | Upgrade | Market Perform | 2021-10-31 |
| Deutsche Bank | Downgrade | Hold | 2021-09-16 |
Unilever’s grades show mixed signals with several downgrades to Hold and Underweight, balanced by multiple upgrades to Buy/Overweight and Market Perform ratings, indicating varied analyst sentiment over time.
Edgewell Personal Care Company Grades
Below is the recent grade activity from established grading firms for Edgewell Personal Care Company:
| Grading Company | Action | New Grade | Date |
|---|---|---|---|
| Wells Fargo | Maintain | Overweight | 2026-01-05 |
| Morgan Stanley | Maintain | Equal Weight | 2025-11-18 |
| Barclays | Maintain | Equal Weight | 2025-11-14 |
| RBC Capital | Maintain | Outperform | 2025-11-14 |
| Wells Fargo | Maintain | Overweight | 2025-11-14 |
| Wells Fargo | Maintain | Overweight | 2025-09-25 |
| Morgan Stanley | Upgrade | Equal Weight | 2025-08-06 |
| UBS | Maintain | Neutral | 2025-08-06 |
| Barclays | Maintain | Equal Weight | 2025-08-06 |
| Canaccord Genuity | Maintain | Buy | 2025-08-06 |
Edgewell’s grades are generally stable with consistent Overweight, Equal Weight, and Outperform ratings, indicating steady analyst confidence without recent downgrades.
Which company has the best grades?
Edgewell Personal Care Company has received more stable and consistent positive grades, including multiple Overweight and Outperform ratings, compared to Unilever’s more mixed and fluctuating grades. This consistency may influence investors seeking steadier analyst sentiment, while Unilever’s variation suggests more cautious or divided market views.
Strengths and Weaknesses
Below is a comparative overview of key strengths and weaknesses for Unilever PLC (UL) and Edgewell Personal Care Company (EPC) based on the latest financial and operational data.
| Criterion | Unilever PLC (UL) | Edgewell Personal Care Company (EPC) |
|---|---|---|
| Diversification | Broad product portfolio across multiple sectors, strong global footprint | Focused mainly on personal care with a few product categories, moderate diversification |
| Profitability | Favorable ROIC (11.12%) and ROE (28.73%), net margin neutral (9.45%) | Low profitability with ROIC (3.0%), ROE (1.64%), and net margin (1.14%) all unfavorable |
| Innovation | Stable innovation sustaining value creation but with a declining ROIC trend | Declining profitability suggests challenges in innovation and competitive positioning |
| Global presence | Strong global presence with consistent value creation | More limited global reach, primarily North America focused |
| Market Share | Large market share in FMCG with strong brand recognition | Niche market share in shaving and personal care segments |
In summary, Unilever offers a diversified, globally strong business with solid profitability despite a slight decline in returns. Edgewell faces significant profitability and growth challenges, reflected in its declining ROIC and weaker financial ratios, making it a riskier investment choice at present.
Risk Analysis
Below is a comparative table of key risks for Unilever PLC and Edgewell Personal Care Company based on the most recent data from 2025-2026:
| Metric | Unilever PLC (UL) | Edgewell Personal Care Company (EPC) |
|---|---|---|
| Market Risk | Low beta (0.223) indicates lower volatility | Moderate beta (0.616) suggests medium volatility |
| Debt level | DE ratio 1.53 (unfavorable), 38.44% debt-to-assets (neutral) | DE ratio 0.91 (neutral), 37.61% debt-to-assets (neutral) |
| Regulatory Risk | Moderate due to global operations and consumer goods compliance | Moderate, focused mostly on US regulations |
| Operational Risk | Low, supported by diversified product lines and strong asset turnover | Moderate, smaller scale and lower asset turnover (0.59) |
| Environmental Risk | Increasing pressure on sustainability but active in green initiatives | Moderate, with personal care products facing environmental scrutiny |
| Geopolitical Risk | Exposure to global markets, UK-based | Primarily US-focused, less exposed globally |
In synthesis, Unilever’s most impactful risks lie in its higher debt level and global geopolitical exposure, though its low market volatility and strong operational metrics mitigate this. Edgewell faces higher financial distress risk, indicated by its Altman Z-score in the distress zone, and operational risks due to lower profitability and interest coverage. Investors should weigh Unilever’s balance sheet leverage against Edgewell’s financial vulnerability and market positioning.
Which Stock to Choose?
Unilever PLC (UL) shows a generally favorable income evolution with a 19.79% revenue growth over 2020-2024 and strong profitability metrics, including a 28.73% ROE and 11.12% ROIC. Despite a slightly declining ROIC trend and some unfavorable liquidity and valuation ratios, UL maintains a very favorable overall rating and a solid economic moat, suggesting efficient capital use and value creation.
Edgewell Personal Care Company (EPC) presents an unfavorable income evolution marked by declining margins and net income, with a 78.44% decrease in net income over 2021-2025 and weak profitability ratios such as a 1.64% ROE and 3.0% ROIC. Its financial ratios are mixed, with some favorable liquidity and valuation metrics, but it suffers from high debt levels and a very unfavorable moat evaluation, indicating value destruction and decreasing profitability.
Considering ratings and financial evaluations, UL might appear more suitable for investors seeking quality and value creation, while EPC’s profile could be interpreted as more aligned with risk-tolerant investors who might focus on turnaround potential despite current challenges.
Disclaimer: Investment carries a risk of loss of initial capital. The past performance is not a reliable indicator of future results. Be sure to understand risks before making an investment decision.
Go Further
I encourage you to read the complete analyses of Unilever PLC and Edgewell Personal Care Company to enhance your investment decisions: