Home > Comparison > Consumer Defensive > PG vs EPC
The strategic rivalry between The Procter & Gamble Company and Edgewell Personal Care Company shapes the Consumer Defensive sector’s landscape. Procter & Gamble operates as a diversified heavyweight with broad product categories and global scale, while Edgewell focuses on niche personal care segments with targeted brands. This analysis pits scale and diversification against specialization to identify which corporate strategy offers a superior risk-adjusted return for a balanced portfolio.
Table of contents
Companies Overview
The Procter & Gamble Company and Edgewell Personal Care Company dominate the global household and personal products market.
The Procter & Gamble Company: Global Consumer Goods Powerhouse
This company leads the consumer packaged goods sector with a diverse portfolio spanning Beauty, Grooming, Health Care, Fabric & Home Care, and Baby & Family Care. It generates revenue through mass merchandisers, e-commerce, and specialty stores worldwide. In 2026, its strategic focus remains on leveraging brand strength and expanding digital sales channels to sustain market dominance.
Edgewell Personal Care Company: Specialized Personal Care Innovator
Edgewell Personal Care focuses on the personal care niche with three main segments: Wet Shave, Sun and Skin Care, and Feminine Care. It drives revenue by marketing razor systems and skincare products under recognized brands like Schick and Banana Boat. In 2026, Edgewell prioritizes product innovation and brand revitalization to capture targeted consumer segments.
Strategic Collision: Similarities & Divergences
Both companies operate in the consumer defensive sector but differ in scale and scope. Procter & Gamble embraces a broad portfolio and global reach, while Edgewell pursues a focused, innovation-driven approach in personal care. Their primary battle unfolds in shaving and skincare products, where brand loyalty is critical. Investors face contrasting profiles: Procter & Gamble offers stability with scale, whereas Edgewell presents growth potential amid niche specialization.
Income Statement Comparison
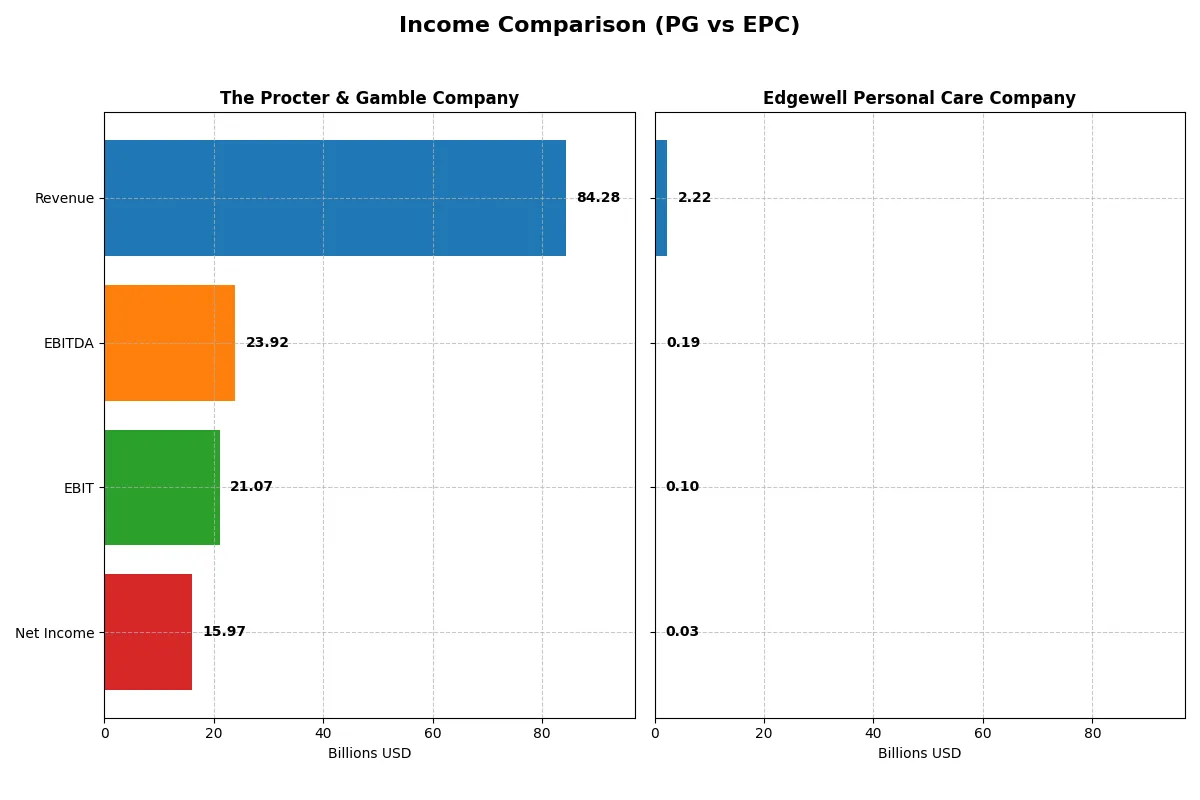
This data dissects the core profitability and scalability of both corporate engines to reveal who dominates the bottom line:
| Metric | The Procter & Gamble Company (PG) | Edgewell Personal Care Company (EPC) |
|---|---|---|
| Revenue | 84.3B | 2.22B |
| Cost of Revenue | 41.2B | 1.30B |
| Operating Expenses | 22.7B | 828M |
| Gross Profit | 43.1B | 925M |
| EBITDA | 23.9B | 186M |
| EBIT | 21.1B | 97M |
| Interest Expense | 907M | 73M |
| Net Income | 15.97B | 25.4M |
| EPS | 6.67 | 0.53 |
| Fiscal Year | 2025 | 2025 |
Income Statement Analysis: The Bottom-Line Duel
This income statement comparison uncovers each company’s true operational strength and profitability efficiency over recent years.
The Procter & Gamble Company Analysis
P&G’s revenue rose steadily from 76B in 2021 to 84.3B in 2025, with net income climbing from 14.3B to 16B. Its gross margin holds firm at 51.2%, while net margin improved to 19% in 2025, signaling robust operational control. The firm’s EBIT margin at 25% confirms strong profitability momentum despite minor revenue growth deceleration.
Edgewell Personal Care Company Analysis
Edgewell’s revenue slightly declined from 2.1B in 2021 to 2.2B in 2025, while net income shrank drastically from 118M to 25M. Gross margin dropped to 41.6%, and net margin fell to just over 1%, reflecting margin pressure and operational inefficiency. EBIT margin weakened to 4.35%, highlighting a challenging profitability environment and deteriorating earnings quality.
Margin Resilience vs. Earnings Erosion
P&G clearly dominates with stable revenue growth, superior margin health, and consistent net income expansion. In contrast, Edgewell faces persistent margin compression and steep net income declines. For investors prioritizing reliable profitability and operational efficiency, P&G’s profile stands out as the fundamentally stronger and more attractive choice.
Financial Ratios Comparison
These vital ratios act as a diagnostic tool to expose the underlying fiscal health, valuation premiums, and capital efficiency of the companies compared below:
| Ratios | The Procter & Gamble Company (PG) | Edgewell Personal Care Company (EPC) |
|---|---|---|
| ROE | 30.7% | 1.6% |
| ROIC | 16.5% | 3.0% |
| P/E | 24.5 | 38.1 |
| P/B | 7.52 | 0.62 |
| Current Ratio | 0.70 | 1.76 |
| Quick Ratio | 0.49 | 0.90 |
| D/E (Debt-to-Equity) | 0.68 | 0.91 |
| Debt-to-Assets | 28.3% | 37.6% |
| Interest Coverage | 22.5x | 1.3x |
| Asset Turnover | 0.67 | 0.59 |
| Fixed Asset Turnover | 3.53 | 6.02 |
| Payout ratio | 61.8% | 115.4% |
| Dividend yield | 2.52% | 3.03% |
| Fiscal Year | 2025 | 2025 |
Efficiency & Valuation Duel: The Vital Signs
Ratios act as a company’s DNA, revealing hidden risks and operational excellence through key profitability and valuation metrics.
The Procter & Gamble Company
P&G displays robust profitability with a 30.7% ROE and nearly 19% net margin, signaling operational efficiency. The P/E of 24.5 is fairly valued but a high P/B of 7.5 raises caution. A stable 2.5% dividend yield rewards shareholders, reflecting disciplined capital allocation and consistent cash returns.
Edgewell Personal Care Company
Edgewell shows weak profitability with a 1.6% ROE and 1.1% net margin, indicating operational challenges. Its P/E of 38 is stretched relative to earnings, though a low P/B of 0.62 suggests undervaluation on book value. The 3% dividend yield offers income, despite a strained interest coverage ratio signaling financial risk.
Premium Valuation vs. Operational Safety
P&G balances strong profitability and shareholder returns with a reasonable valuation, despite some liquidity concerns. Edgewell’s valuation looks expensive given its weak profitability and financial risk. Investors favoring stable, efficient operations may gravitate toward P&G, while those seeking higher yield amid risk might consider Edgewell.
Which one offers the Superior Shareholder Reward?
I see Procter & Gamble (PG) blends a solid 2.5% dividend yield with a high 62% payout ratio, backed by robust 79% free cash flow coverage. Its disciplined buybacks enhance shareholder value sustainably. Edgewell Personal Care (EPC) yields slightly higher at 3.0% but with a payout ratio over 115%, signaling risk. EPC’s free cash flow barely covers dividends, and its buyback program is modest. I conclude PG offers the superior total shareholder reward in 2026, balancing income reliability and capital return prudently.
Comparative Score Analysis: The Strategic Profile
The radar chart reveals the fundamental DNA and trade-offs of The Procter & Gamble Company and Edgewell Personal Care Company:
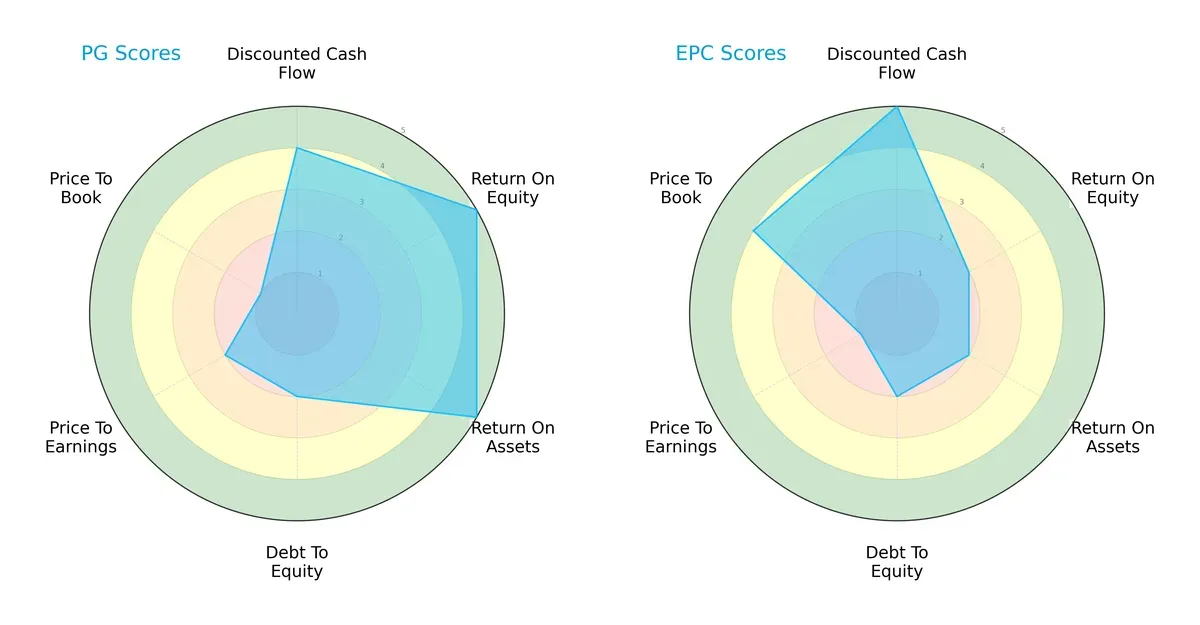
Procter & Gamble demonstrates superior profitability with high ROE (5) and ROA (5) scores, indicating efficient capital and asset use. Edgewell excels in discounted cash flow (5) and price-to-book (4), suggesting better valuation appeal. Both share moderate debt-to-equity (2), but P&G’s price-to-book (1) score flags valuation concerns. Overall, P&G holds a balanced profile focused on operational excellence, while Edgewell leans on valuation metrics for its edge.
Bankruptcy Risk: Solvency Showdown
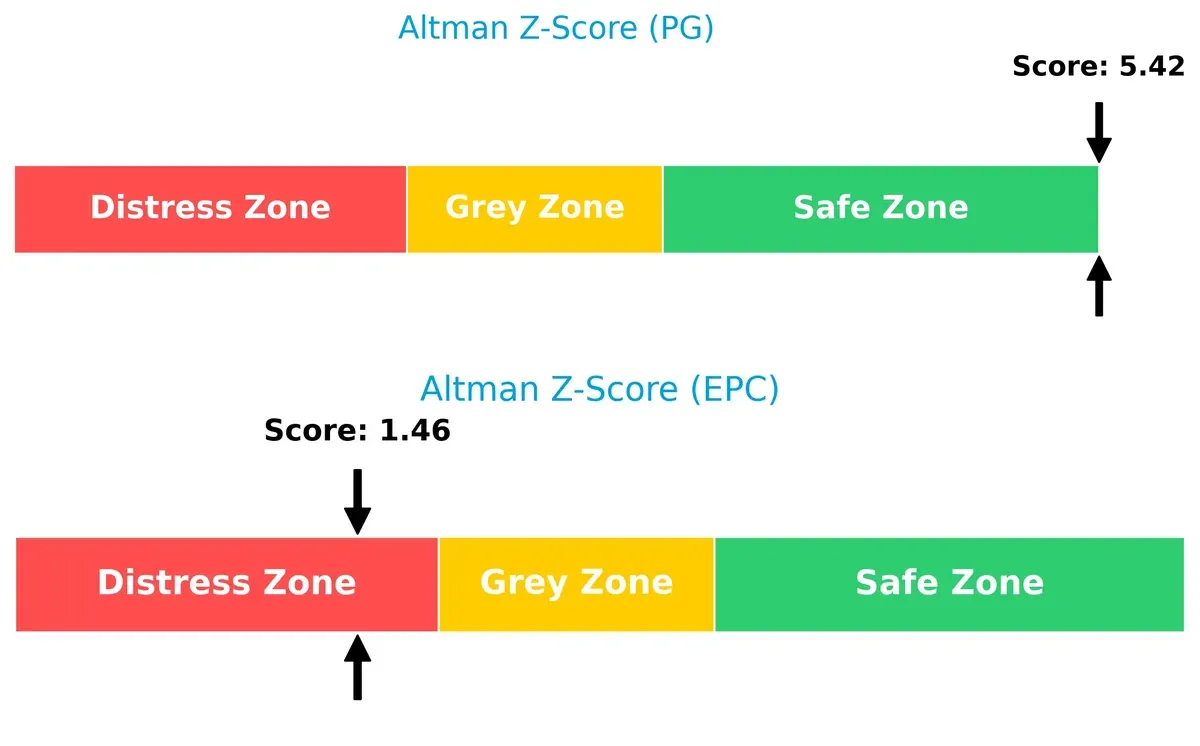
The Procter & Gamble Company’s Altman Z-Score (5.42) far exceeds Edgewell’s (1.46), signaling a much stronger solvency position. This implies P&G is safely insulated from bankruptcy risk this cycle, whereas Edgewell remains in distress territory, posing significant survival risks:
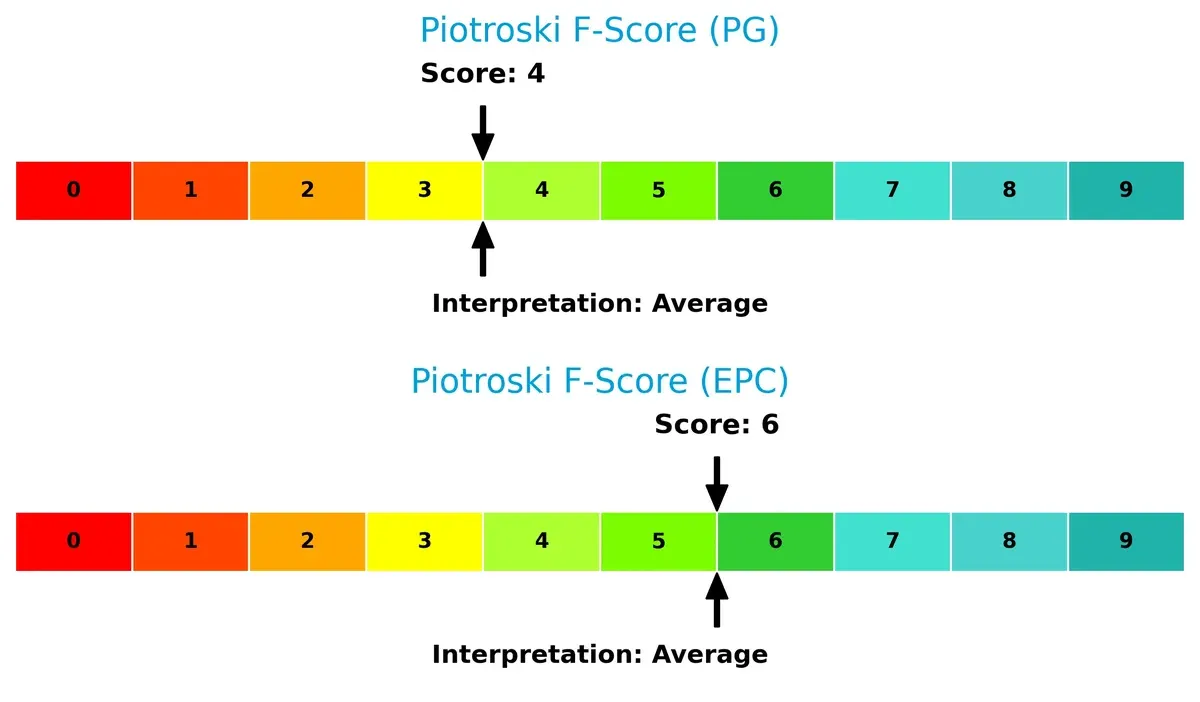
Financial Health: Quality of Operations
Piotroski F-Scores reflect operational quality and financial discipline. Edgewell’s 6 surpasses P&G’s 4, indicating better recent improvements and fewer red flags. However, both remain average, suggesting room for operational strengthening:
How are the two companies positioned?
This section dissects the operational DNA of PG and EPC by comparing their revenue distribution by segment and analyzing internal strengths and weaknesses. The goal is to confront their economic moats and determine which model delivers the most resilient competitive advantage today.
Revenue Segmentation: The Strategic Mix
This visual comparison dissects how The Procter & Gamble Company and Edgewell Personal Care Company diversify their income streams and where their primary sector bets lie:
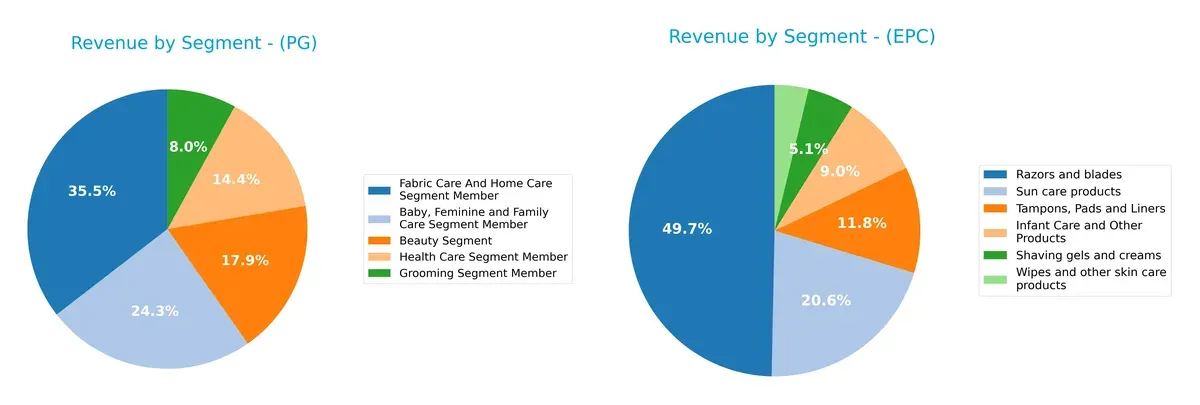
Procter & Gamble anchors revenue in Fabric Care and Home Care at $29.6B, with balanced contributions from Baby Care ($20.2B) and Beauty ($14.9B). Edgewell Personal Care pivots heavily on Razors and Blades at $1.1B, dwarfing its other segments under $500M. P&G’s diversified portfolio reduces concentration risk and supports ecosystem lock-in. Edgewell’s reliance on one core segment exposes it to market shifts but may reflect focused infrastructure dominance.
Strengths and Weaknesses Comparison
This table compares the strengths and weaknesses of The Procter & Gamble Company (PG) and Edgewell Personal Care Company (EPC):
PG Strengths
- Diverse product segments with substantial revenues across five categories
- Strong global presence with nearly equal US and Non-US sales
- High profitability metrics including 18.95% net margin and 30.71% ROE
- Favorable capital structure and interest coverage
- Consistent dividend yield at 2.52%
EPC Strengths
- Favorable liquidity with current ratio at 1.76
- Low price-to-book at 0.62 signals potential undervaluation
- Favorable fixed asset turnover of 6.02 indicates efficient asset use
- Moderate dividend yield at 3.03%
- US market generates majority of revenue supporting stable core market
PG Weaknesses
- Low current (0.7) and quick ratios (0.49) indicate tight short-term liquidity
- High price-to-book ratio at 7.52 may imply overvaluation
- Neutral debt-to-equity at 0.68, potential for cautious leverage
- Asset turnover moderate at 0.67, suggesting room for operational efficiency gains
EPC Weaknesses
- Very low profitability with 1.14% net margin and 1.64% ROE
- Weak interest coverage at 1.32 raises solvency concerns
- High P/E at 38.07 reflects expensive valuation relative to earnings
- Neutral debt-to-assets at 37.61% with limited global diversification
PG benefits from broad diversification, strong profitability, and global footprint. EPC shows strengths in liquidity and asset efficiency but struggles with profitability and geographic concentration. These contrasts highlight different strategic challenges and financial profiles.
The Moat Duel: Analyzing Competitive Defensibility
A structural moat is the only true shield protecting long-term profits from relentless competition erosion. Let’s examine how these two firms defend their turf:
The Procter & Gamble Company: Brand Power and Scale Moat
P&G’s moat stems from powerful brand portfolios and economies of scale. Its 25% EBIT margin and growing ROIC (+7%) confirm efficient capital use. Expansion into premium personal care deepens this moat in 2026.
Edgewell Personal Care Company: Niche Brand Moat with Struggles
Edgewell relies on niche brands like Schick but suffers from declining ROIC (-50%) and weak margins (4.35% EBIT). Its smaller scale contrasts sharply with P&G’s dominance. Growth depends on successful innovation and market penetration.
Moat Strength Showdown: Scale and Brand Equity vs. Niche Vulnerability
P&G holds a wider, deeper moat with durable profitability and rising returns that edge out Edgewell’s shrinking, value-destroying position. P&G is far better equipped to defend market share amid intensifying competition.
Which stock offers better returns?
The stock prices of The Procter & Gamble Company and Edgewell Personal Care Company show distinct bearish trends over the past year with recent signs of acceleration in recovery.
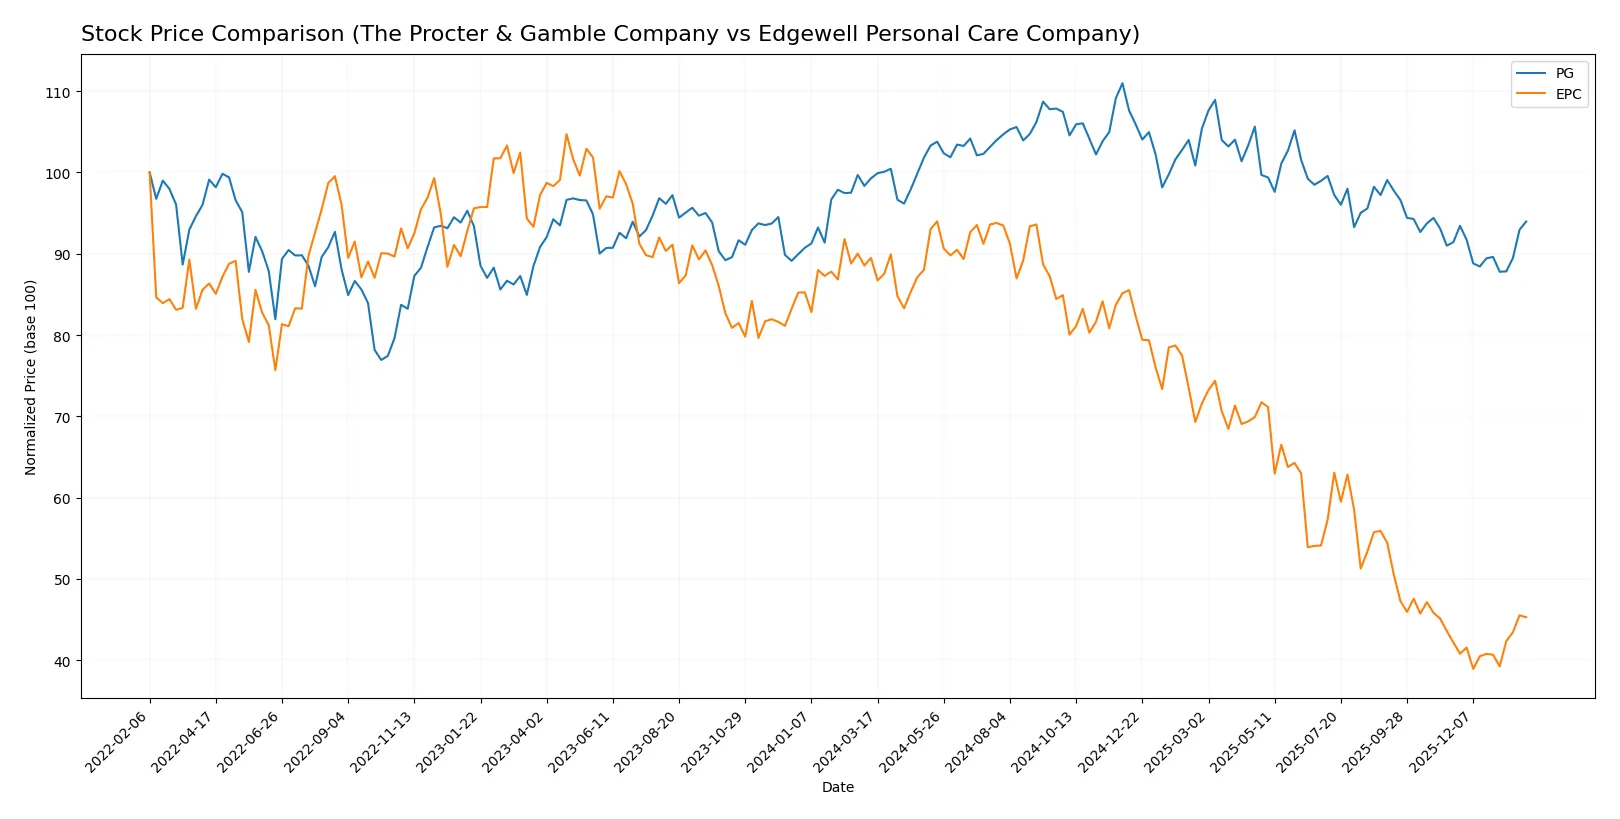
Trend Comparison
The Procter & Gamble Company’s stock declined 5.35% over the past year, reflecting a bearish trend with accelerating losses and a high price volatility of 8.85%. Recently, it showed a modest 2.78% recovery with a low volatility of 3.41%.
Edgewell Personal Care Company suffered a sharp 49.39% drop over the year, signaling a strong bearish trend with accelerating declines and significant volatility at 7.61%. Recently, the stock rebounded 7.34%, showing more robust acceleration and lower volatility of 0.87%.
Comparing both, Edgewell Personal Care’s stock delivered the steepest decline but also the strongest recent rebound, whereas Procter & Gamble’s loss was moderate with a smaller recent recovery. Overall, Procter & Gamble maintained a less volatile and less severe downtrend.
Target Prices
Analysts present a measured consensus on target prices for both Procter & Gamble and Edgewell Personal Care.
| Company | Target Low | Target High | Consensus |
|---|---|---|---|
| The Procter & Gamble Company | 150 | 179 | 165.67 |
| Edgewell Personal Care Company | 20 | 23 | 21.5 |
The Procter & Gamble consensus target of 165.67 suggests moderate upside from the current 151.77 price. Edgewell’s 21.5 consensus similarly indicates potential gains above its 19.46 market price.

Don’t Let Luck Decide Your Entry Point
Optimize your entry points with our advanced ProRealTime indicators. You’ll get efficient buy signals with precise price targets for maximum performance. Start outperforming now!
How do institutions grade them?
Here are the latest institutional grades for The Procter & Gamble Company and Edgewell Personal Care Company:
The Procter & Gamble Company Grades
The table below shows recent institutional grades for Procter & Gamble:
| Grading Company | Action | New Grade | Date |
|---|---|---|---|
| TD Cowen | Downgrade | Hold | 2026-01-27 |
| UBS | Maintain | Buy | 2026-01-23 |
| JP Morgan | Upgrade | Overweight | 2026-01-23 |
| Wells Fargo | Maintain | Overweight | 2026-01-23 |
| UBS | Maintain | Buy | 2026-01-14 |
| TD Cowen | Maintain | Buy | 2026-01-08 |
| Wells Fargo | Maintain | Overweight | 2026-01-05 |
| JP Morgan | Maintain | Neutral | 2025-12-18 |
| Jefferies | Upgrade | Buy | 2025-12-17 |
| JP Morgan | Maintain | Neutral | 2025-10-27 |
Edgewell Personal Care Company Grades
The table below shows recent institutional grades for Edgewell Personal Care:
| Grading Company | Action | New Grade | Date |
|---|---|---|---|
| Wells Fargo | Maintain | Overweight | 2026-01-05 |
| Morgan Stanley | Maintain | Equal Weight | 2025-11-18 |
| Barclays | Maintain | Equal Weight | 2025-11-14 |
| Wells Fargo | Maintain | Overweight | 2025-11-14 |
| RBC Capital | Maintain | Outperform | 2025-11-14 |
| Wells Fargo | Maintain | Overweight | 2025-09-25 |
| Canaccord Genuity | Maintain | Buy | 2025-08-06 |
| Morgan Stanley | Upgrade | Equal Weight | 2025-08-06 |
| UBS | Maintain | Neutral | 2025-08-06 |
| Barclays | Maintain | Equal Weight | 2025-08-06 |
Which company has the best grades?
Procter & Gamble’s grades skew toward Buy and Overweight, with some recent downgrades to Hold. Edgewell’s ratings cluster around Overweight and Equal Weight, with fewer Buy ratings. Investors may view P&G’s stronger grades as a sign of greater confidence from analysts, while Edgewell’s more cautious consensus suggests higher perceived risk or uncertainty.
Risks specific to each company
The following categories identify the critical pressure points and systemic threats facing both firms in the 2026 market environment:
1. Market & Competition
The Procter & Gamble Company
- Dominates consumer packaged goods with a strong brand portfolio and global reach.
Edgewell Personal Care Company
- Faces fierce competition in niche personal care segments and smaller scale limits market power.
2. Capital Structure & Debt
The Procter & Gamble Company
- Maintains moderate leverage with a debt-to-assets ratio at 28.3% and strong interest coverage of 23.2x.
Edgewell Personal Care Company
- Higher leverage with 37.6% debt-to-assets and weak interest coverage of 1.32x poses refinancing risks.
3. Stock Volatility
The Procter & Gamble Company
- Low beta of 0.39 indicates defensive stock with less price volatility than the market.
Edgewell Personal Care Company
- Beta at 0.62 suggests higher price sensitivity, increasing risk during market downturns.
4. Regulatory & Legal
The Procter & Gamble Company
- Compliance complexity due to broad product range but benefits from scale in managing risks.
Edgewell Personal Care Company
- Smaller scale and product focus may increase vulnerability to regulatory changes in personal care.
5. Supply Chain & Operations
The Procter & Gamble Company
- Extensive global supply chain benefits from diversification but exposed to inflationary pressures.
Edgewell Personal Care Company
- Smaller, less diversified supply chain increases risk of disruptions and cost spikes.
6. ESG & Climate Transition
The Procter & Gamble Company
- Publicly committed to sustainability goals with significant investments in climate initiatives.
Edgewell Personal Care Company
- ESG efforts less visible and may lag industry leaders, posing reputational risk.
7. Geopolitical Exposure
The Procter & Gamble Company
- Global footprint exposes it to geopolitical tensions but diversified markets mitigate impact.
Edgewell Personal Care Company
- Concentrated operations increase sensitivity to regional geopolitical risks.
Which company shows a better risk-adjusted profile?
The Procter & Gamble Company faces lower financial distress risk and benefits from superior capital structure and market position. Its Altman Z-Score of 5.42 places it safely above bankruptcy risk. Edgewell’s Z-Score at 1.46 signals financial distress concerns, compounded by weak interest coverage and higher leverage. I see P&G’s defensive beta and robust interest coverage as key risk mitigants. Edgewell’s elevated P/E ratio and thinner margins highlight valuation and profitability risks. Overall, P&G offers a more stable, risk-adjusted profile in the current market environment.
Final Verdict: Which stock to choose?
The Procter & Gamble Company’s superpower lies in its durable competitive advantage and efficient capital allocation. It consistently generates robust returns above its cost of capital. However, its low current ratio signals a liquidity caution. PG suits portfolios seeking steady, long-term value with moderate growth—classic Defensive Growth.
Edgewell Personal Care’s strategic moat is its niche in personal care with a lower valuation relative to book value. It offers a more liquid balance sheet than PG but struggles with declining profitability and a shrinking economic moat. EPC may appeal to investors prioritizing turnaround potential and value plays, fitting a High-Risk, High-Reward profile.
If you prioritize capital preservation and consistent value creation, PG is the compelling choice due to its strong moat and proven financial discipline. However, if you seek speculative growth with a focus on undervaluation and capital structure flexibility, EPC offers better upside but demands tolerance for volatility and operational risks.
Disclaimer: Investment carries a risk of loss of initial capital. The past performance is not a reliable indicator of future results. Be sure to understand risks before making an investment decision.
Go Further
I encourage you to read the complete analyses of The Procter & Gamble Company and Edgewell Personal Care Company to enhance your investment decisions: