In the competitive landscape of household and personal products, Edgewell Personal Care Company (EPC) and Nu Skin Enterprises, Inc. (NUS) stand out as influential players. Both companies innovate in personal care, yet they differ in product focus and market approach—EPC emphasizes shaving and skin essentials, while NUS blends beauty with wellness through advanced skincare and supplements. This article will explore their strengths to help you decide which company aligns best with your investment goals.
Table of contents
Companies Overview
I will begin the comparison between Edgewell Personal Care Company and Nu Skin Enterprises, Inc. by providing an overview of these two companies and their main differences.
Edgewell Personal Care Company Overview
Edgewell Personal Care Company manufactures and markets personal care products globally, focusing on wet shave, sun and skin care, and feminine care segments. Its portfolio includes well-known brands such as Schick, Wilkinson Sword, Banana Boat, and Playtex. Founded in 1772 and headquartered in Shelton, Connecticut, EPC operates in the Consumer Defensive sector with a market cap of approximately 847M USD.
Nu Skin Enterprises, Inc. Overview
Nu Skin Enterprises, Inc. develops and distributes beauty and wellness products worldwide, offering skin care systems, nutritional supplements, and weight management products under brands like Nu Skin and ageLOC. Founded in 1984 and based in Provo, Utah, NUS operates in the Consumer Defensive sector with a market cap near 518M USD, emphasizing direct and distributor-based sales channels.
Key similarities and differences
Both EPC and NUS operate within the Household & Personal Products industry under the Consumer Defensive sector, focusing on personal care and wellness products. EPC emphasizes branded consumer staples in wet shaving and feminine care, while NUS targets beauty, nutritional supplements, and anti-aging solutions with a direct sales model. Their market caps and employee counts differ, reflecting varied scales and business strategies.
Income Statement Comparison
This table compares the most recent fiscal year income statement metrics for Edgewell Personal Care Company and Nu Skin Enterprises, Inc., highlighting key financial performance indicators.
| Metric | Edgewell Personal Care Company (EPC) | Nu Skin Enterprises, Inc. (NUS) |
|---|---|---|
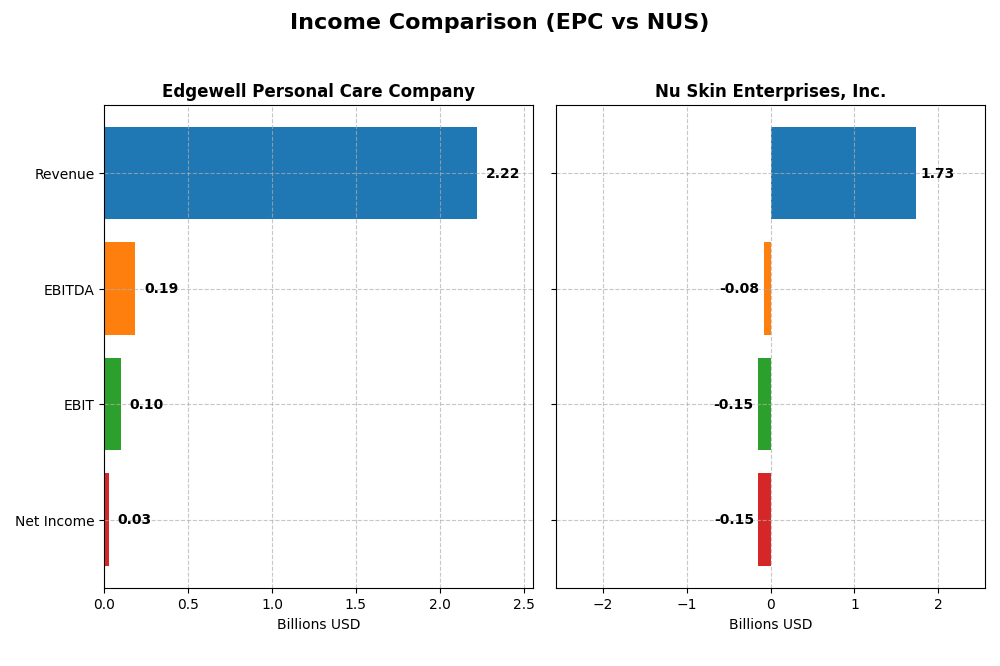
| Market Cap | 847M | 518M |
| Revenue | 2.22B | 1.73B |
| EBITDA | 186M | -79M |
| EBIT | 97M | -149M |
| Net Income | 25M | -147M |
| EPS | 0.53 | -2.95 |
| Fiscal Year | 2025 | 2024 |
Income Statement Interpretations
Edgewell Personal Care Company
Edgewell’s revenue showed a modest overall growth of 6.53% from 2021 to 2025 but declined by 1.34% in the most recent year. Net income and margins deteriorated significantly, with net income dropping 78.44% over the period and net margin falling to 1.14% in 2025. The latest fiscal year saw notable declines in EBIT and EPS, reflecting profitability challenges despite a stable gross margin of 41.6%.
Nu Skin Enterprises, Inc.
Nu Skin experienced a sharp revenue decline of 32.92% over 2020-2024, with a 12.04% drop in the last year. The company’s profitability worsened considerably, as net income and net margin turned negative, resulting in a net margin of -8.46% in 2024. EBIT also fell dramatically, and EPS plummeted, indicating persistent operational and financial difficulties throughout the period.
Which one has the stronger fundamentals?
Both companies exhibit unfavorable income statement trends with limited favorable aspects. Edgewell maintains a positive gross margin and lower interest expense but struggles with shrinking net income and margins. Nu Skin faces deeper revenue contraction and negative profitability metrics, including a negative EBIT margin. Overall, Edgewell shows relatively stronger fundamentals, albeit with caution warranted given recent declines.
Financial Ratios Comparison
This table presents the most recent key financial ratios for Edgewell Personal Care Company (EPC) and Nu Skin Enterprises, Inc. (NUS) based on their latest fiscal year data.
| Ratios | Edgewell Personal Care Company (EPC) 2025 | Nu Skin Enterprises, Inc. (NUS) 2024 |
|---|---|---|
| ROE | 1.64% | -22.50% |
| ROIC | 3.00% | -10.40% |
| P/E | 38.07 | -2.33 |
| P/B | 0.62 | 0.53 |
| Current Ratio | 1.76 | 1.82 |
| Quick Ratio | 0.90 | 1.17 |
| D/E (Debt-to-Equity) | 0.91 | 0.73 |
| Debt-to-Assets | 37.61% | 32.56% |
| Interest Coverage | 1.32 | -5.74 |
| Asset Turnover | 0.59 | 1.18 |
| Fixed Asset Turnover | 6.02 | 3.71 |
| Payout ratio | 115.35% | -8.14% |
| Dividend yield | 3.03% | 3.49% |
Interpretation of the Ratios
Edgewell Personal Care Company
Edgewell’s financial ratios present a mixed picture with equal proportions of favorable and unfavorable indicators. Key concerns include low net margin (1.14%) and return on equity (1.64%), reflecting weak profitability. However, the company maintains a solid current ratio (1.76) and a low price-to-book ratio (0.62), supporting financial stability. The dividend yield stands at 3.03%, suggesting consistent shareholder returns, but coverage by free cash flow is weak, posing potential sustainability risks.
Nu Skin Enterprises, Inc.
Nu Skin shows several favorable ratios such as a strong current ratio (1.82), quick ratio (1.17), and asset turnover (1.18), indicating operational efficiency and liquidity. However, profitability metrics are negative, with net margin at -8.46% and return on equity at -22.5%, signaling losses. Despite this, the company pays a dividend with a 3.49% yield, possibly funded by reinvestment strategies or cash reserves, as free cash flow coverage is not indicated.
Which one has the best ratios?
Nu Skin appears to have a more favorable overall ratio profile with 57.14% favorable ratios compared to Edgewell’s 35.71%. While Nu Skin struggles with profitability, it excels in liquidity and asset efficiency. Edgewell shows balanced but weaker profitability and financial leverage ratios. Investors should weigh liquidity and profitability carefully when comparing these companies’ financial health.
Strategic Positioning
This section compares the strategic positioning of Edgewell Personal Care Company and Nu Skin Enterprises, Inc., including Market position, Key segments, and disruption:
Edgewell Personal Care Company
- Operates in household & personal products with moderate market cap $847M, facing consumer defensive sector pressure.
- Key segments: Wet shave (razors, blades), sun and skin care, feminine care; driven by branded personal care products.
- Exposure to disruption is moderate; traditional personal care products with limited tech integration.
Nu Skin Enterprises, Inc.
- Operates in household & personal products with smaller market cap $518M, also in consumer defensive sector.
- Key segments: skin care systems, nutritional supplements, wellness products; driven by brand and direct sales.
- Exposure to technological disruption through skin treatment devices and product R&D focus.
Edgewell Personal Care Company vs Nu Skin Enterprises, Inc. Positioning
Edgewell’s approach is diversified across multiple personal care segments, including razors and feminine care. Nu Skin concentrates on skin care technology and nutritional supplements, leveraging direct sales and innovation. Edgewell has broader product coverage, while Nu Skin focuses on technology-driven wellness.
Which has the best competitive advantage?
Both companies show very unfavorable moat evaluations with declining ROIC below WACC, indicating value destruction and weakened competitive advantages. Neither currently demonstrates a sustainable economic moat based on provided data.
Stock Comparison
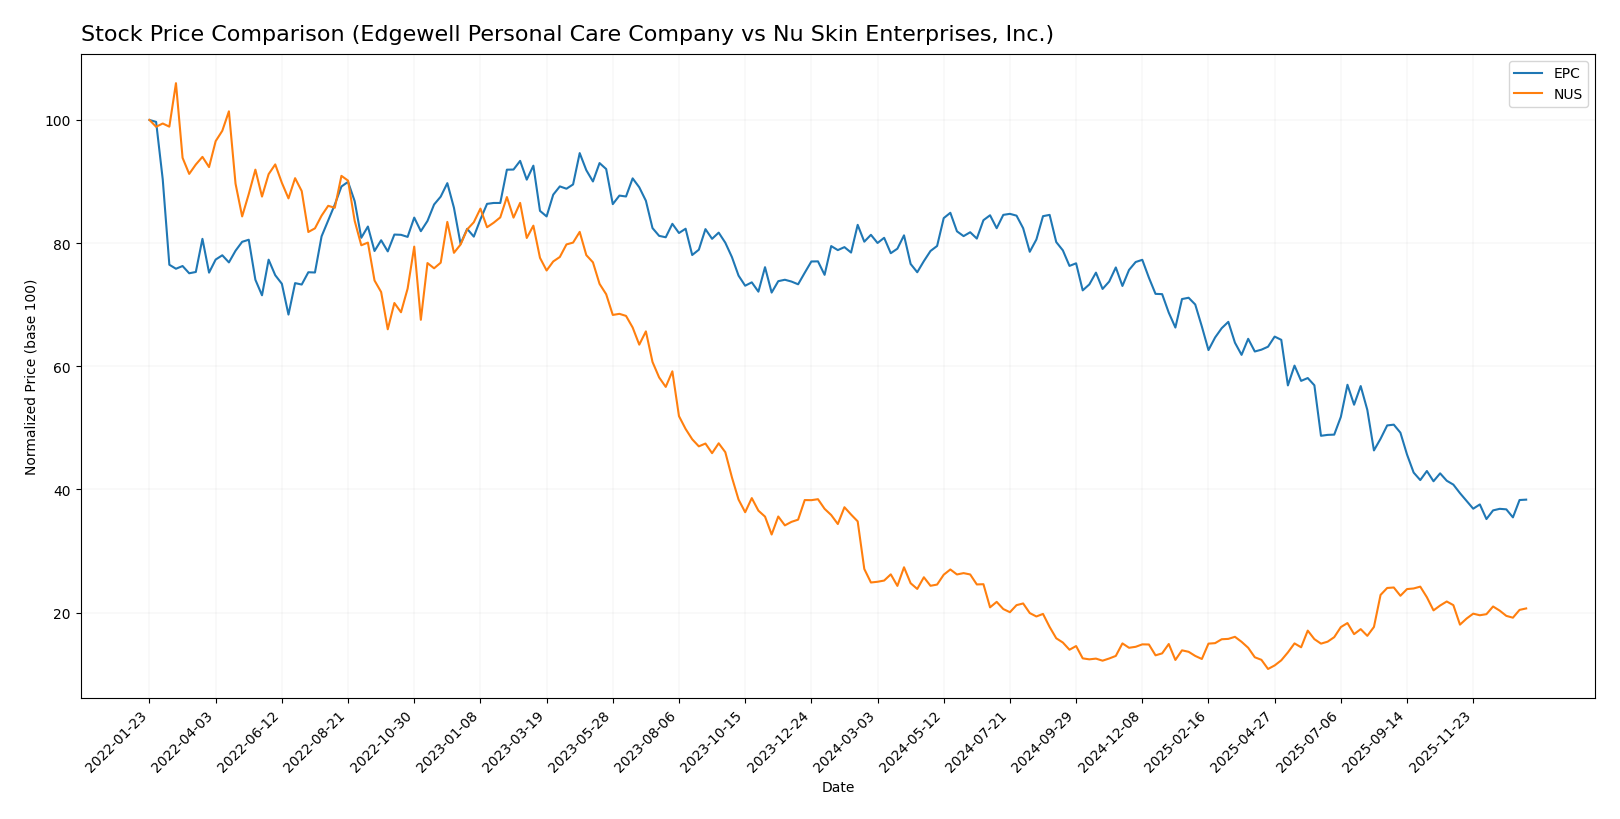
The stock prices of Edgewell Personal Care Company (EPC) and Nu Skin Enterprises, Inc. (NUS) have shown significant downward movements over the past 12 months, reflecting bearish trends with accelerating declines and notable price volatility.
Trend Analysis
Edgewell Personal Care Company’s stock experienced a 52.87% decrease over the past year, indicating a strong bearish trend with accelerating decline and price volatility reflected by a 7.54 standard deviation. The highest price reached was 40.38, and the lowest was 16.73.
Nu Skin Enterprises, Inc. showed a 16.93% price decline over the same period, confirming a bearish trend with accelerating loss. Price volatility was moderate with a 2.34 standard deviation, with highs at 13.83 and lows at 5.48.
Comparing both stocks, Edgewell Personal Care Company delivered the lower market performance with a steeper decline than Nu Skin Enterprises, Inc. over the past year.
Target Prices
The current analyst consensus offers clear target price ranges for both Edgewell Personal Care Company and Nu Skin Enterprises, Inc.
| Company | Target High | Target Low | Consensus |
|---|---|---|---|
| Edgewell Personal Care Company | 23 | 20 | 21.5 |
| Nu Skin Enterprises, Inc. | 11 | 11 | 11 |
Analysts expect Edgewell Personal Care’s stock to rise from its current price of 18.23 USD to around 21.5 USD, indicating moderate upside potential. Nu Skin’s consensus target equals its current price of 10.45 USD, suggesting a stable outlook with limited near-term price movement.
Analyst Opinions Comparison
This section compares analysts’ ratings and grades for Edgewell Personal Care Company and Nu Skin Enterprises, Inc.:
Rating Comparison
EPC Rating
- Rating: B, considered very favorable.
- Discounted Cash Flow Score: 5, very favorable, indicating strong valuation based on projected cash flows.
- ROE Score: 2, moderate, showing average efficiency in generating profit from equity.
- ROA Score: 2, moderate, reflecting average asset utilization for earnings.
- Debt To Equity Score: 2, moderate, suggesting moderate financial risk with debt levels.
- Overall Score: 3, moderate overall financial standing.
NUS Rating
- Rating: A, considered very favorable.
- Discounted Cash Flow Score: 4, favorable, showing good valuation based on cash flow projections.
- ROE Score: 4, favorable, indicating efficient profit generation from shareholders’ equity.
- ROA Score: 4, favorable, showing effective asset utilization for earnings.
- Debt To Equity Score: 3, moderate, indicating moderate financial risk from leverage.
- Overall Score: 4, favorable overall financial standing.
Which one is the best rated?
Nu Skin Enterprises, Inc. holds a higher overall rating (A) and better scores in ROE, ROA, and overall financial standing compared to Edgewell Personal Care Company, which has a moderate overall rating (B) and mixed scores.
Scores Comparison
Here is a comparison of the Altman Z-Score and Piotroski Score for both companies:
EPC Scores
- Altman Z-Score: 1.44, in distress zone, high bankruptcy risk.
- Piotroski Score: 6, average financial strength.
NUS Scores
- Altman Z-Score: 3.94, in safe zone, low bankruptcy risk.
- Piotroski Score: 8, very strong financial strength.
Which company has the best scores?
NUS shows a stronger financial position with a safe zone Altman Z-Score and a very strong Piotroski Score. EPC is in distress zone with average Piotroski strength, indicating higher financial risk.
Grades Comparison
Here is the grades comparison for Edgewell Personal Care Company and Nu Skin Enterprises, Inc.:
Edgewell Personal Care Company Grades
Summary of recent grades assigned by major financial institutions:
| Grading Company | Action | New Grade | Date |
|---|---|---|---|
| Wells Fargo | Maintain | Overweight | 2026-01-05 |
| Morgan Stanley | Maintain | Equal Weight | 2025-11-18 |
| Barclays | Maintain | Equal Weight | 2025-11-14 |
| RBC Capital | Maintain | Outperform | 2025-11-14 |
| Wells Fargo | Maintain | Overweight | 2025-11-14 |
| Wells Fargo | Maintain | Overweight | 2025-09-25 |
| Morgan Stanley | Upgrade | Equal Weight | 2025-08-06 |
| UBS | Maintain | Neutral | 2025-08-06 |
| Barclays | Maintain | Equal Weight | 2025-08-06 |
| Canaccord Genuity | Maintain | Buy | 2025-08-06 |
Edgewell’s grades trend mostly between Hold equivalents and Buy, with no downgrades, indicating a stable to moderately positive outlook.
Nu Skin Enterprises, Inc. Grades
Summary of recent grades assigned by major financial institutions:
| Grading Company | Action | New Grade | Date |
|---|---|---|---|
| DA Davidson | Maintain | Neutral | 2024-12-20 |
| Citigroup | Maintain | Neutral | 2024-10-22 |
| DA Davidson | Maintain | Neutral | 2024-08-12 |
| Citigroup | Maintain | Neutral | 2024-08-09 |
| DA Davidson | Maintain | Neutral | 2024-05-09 |
| DA Davidson | Maintain | Neutral | 2024-01-05 |
| Stifel | Maintain | Hold | 2023-10-16 |
| Stifel | Maintain | Hold | 2023-10-15 |
| Citigroup | Maintain | Neutral | 2023-09-29 |
| Citigroup | Maintain | Neutral | 2023-09-28 |
Nu Skin’s grades remain consistently neutral to Hold, with no upgrades or downgrades, reflecting a cautious stance.
Which company has the best grades?
Edgewell Personal Care Company shows a more favorable grading profile with several Buy and Outperform ratings, while Nu Skin Enterprises, Inc. maintains a neutral to Hold consensus. This difference may suggest that Edgewell is viewed as having better near-term potential, which could influence investor confidence and portfolio allocation considerations.
Strengths and Weaknesses
Below is a comparative table highlighting the main strengths and weaknesses of Edgewell Personal Care Company (EPC) and Nu Skin Enterprises, Inc. (NUS), based on their latest financials and market positions.
| Criterion | Edgewell Personal Care Company (EPC) | Nu Skin Enterprises, Inc. (NUS) |
|---|---|---|
| Diversification | Broad product range including razors, sun care, feminine care, and infant products; moderate diversification | Focused mainly on skin care and wellness products; less diversified |
| Profitability | Low net margin at 1.14%, ROIC at 3.0% below WACC; value destroying | Negative net margin (-8.46%) and ROIC (-10.4%); value destroying |
| Innovation | Traditional personal care products; limited innovation evidence | Some innovation in wellness segment but declining profitability |
| Global presence | Significant presence with diverse product lines globally | Global but more dependent on direct sales and wellness segment |
| Market Share | Strong in razors and feminine care with stable revenues around $1.1B in razors | Leading in skin care, with Nu Skin segment revenue at $1.45B in 2024 |
Key takeaways: Both companies are currently facing profitability challenges, with ROIC below WACC indicating value destruction. EPC benefits from a more diversified product portfolio and stable market segments, while NUS shows higher exposure to skin care innovation but suffers from sharper financial declines. Caution and close monitoring are advised before investing.
Risk Analysis
Below is a comparative risk table for Edgewell Personal Care Company (EPC) and Nu Skin Enterprises, Inc. (NUS) based on the most recent evaluations.
| Metric | Edgewell Personal Care Company (EPC) | Nu Skin Enterprises, Inc. (NUS) |
|---|---|---|
| Market Risk | Moderate (Beta 0.62, lower volatility) | Higher (Beta 0.98, more sensitive to market swings) |
| Debt level | Moderate (Debt/Equity 0.91; Neutral) | Moderate (Debt/Equity 0.73; Neutral) |
| Regulatory Risk | Moderate (Consumer products regulations) | Elevated (Direct selling model with regulatory scrutiny) |
| Operational Risk | Moderate (Global manufacturing and supply chains) | Moderate to High (Retail and distributor network complexity) |
| Environmental Risk | Moderate (Consumer goods sector) | Moderate (Wellness and cosmetics sector) |
| Geopolitical Risk | Moderate (Global presence, US-based) | Elevated (Significant operations in Mainland China) |
Synthesis: Nu Skin faces higher regulatory and geopolitical risks due to its direct selling model and exposure to China’s market. Edgewell shows moderate market and operational risks but is in financial distress territory per its Altman Z-Score, signaling caution. Nu Skin’s stronger financial health and safer bankruptcy risk make it comparatively less risky despite higher market sensitivity.
Which Stock to Choose?
Edgewell Personal Care Company (EPC) shows a declining income trend with unfavorable net margin and profitability ratios, neutral to favorable debt levels, and a very favorable rating overall, despite a very unfavorable economic moat due to value destruction.
Nu Skin Enterprises, Inc. (NUS) has an unfavorable income evolution marked by negative profitability and declining margins, but presents a favorable set of financial ratios and a very favorable rating, supported by strong scores and a safe financial distress zone.
For investors prioritizing financial stability and strong rating scores, NUS might appear more favorable, while those focusing on dividend yield and moderate valuation could find EPC’s profile relevant; both companies exhibit very unfavorable moats signaling caution.
Disclaimer: Investment carries a risk of loss of initial capital. The past performance is not a reliable indicator of future results. Be sure to understand risks before making an investment decision.
Go Further
I encourage you to read the complete analyses of Edgewell Personal Care Company and Nu Skin Enterprises, Inc. to enhance your investment decisions: