Home > Comparison > Consumer Defensive > NWL vs EPC
The strategic rivalry between Newell Brands Inc. and Edgewell Personal Care Company shapes the competitive landscape of the Household & Personal Products sector. Newell operates as a diversified consumer products conglomerate with broad market reach, while Edgewell focuses on specialized personal care segments like wet shave and skin care. This analysis probes their contrasting operational models to determine which offers superior risk-adjusted returns for a diversified portfolio in an evolving consumer defensive market.
Table of contents
Companies Overview
Newell Brands and Edgewell Personal Care hold pivotal roles in the household and personal products market, shaping consumer choices globally.
Newell Brands Inc.: Diverse Consumer Products Powerhouse
Newell Brands dominates the consumer and commercial products space with a broad portfolio spanning commercial cleaning, home appliances, and outdoor recreation. Its revenue stems from iconic brands like Rubbermaid and Yankee Candle. In 2026, the company prioritizes expanding its multi-segment reach while optimizing product innovation across five distinct divisions.
Edgewell Personal Care Company: Specialty Personal Care Leader
Edgewell Personal Care focuses on personal care products, earning revenue mainly from wet shave, sun and skin care, and feminine care segments. It leverages brands like Schick and Banana Boat to maintain market relevance. The company’s strategic thrust in 2026 centers on deepening brand loyalty and innovation within targeted personal care categories.
Strategic Collision: Similarities & Divergences
Both firms excel in consumer essentials but differ in scope: Newell Brands pursues a diversified portfolio across household and commercial sectors, while Edgewell zeroes in on specialized personal care. Their primary battleground lies in brand strength and product innovation. Newell’s broad exposure contrasts with Edgewell’s focused niche, creating distinct risk and growth profiles for investors.
Income Statement Comparison
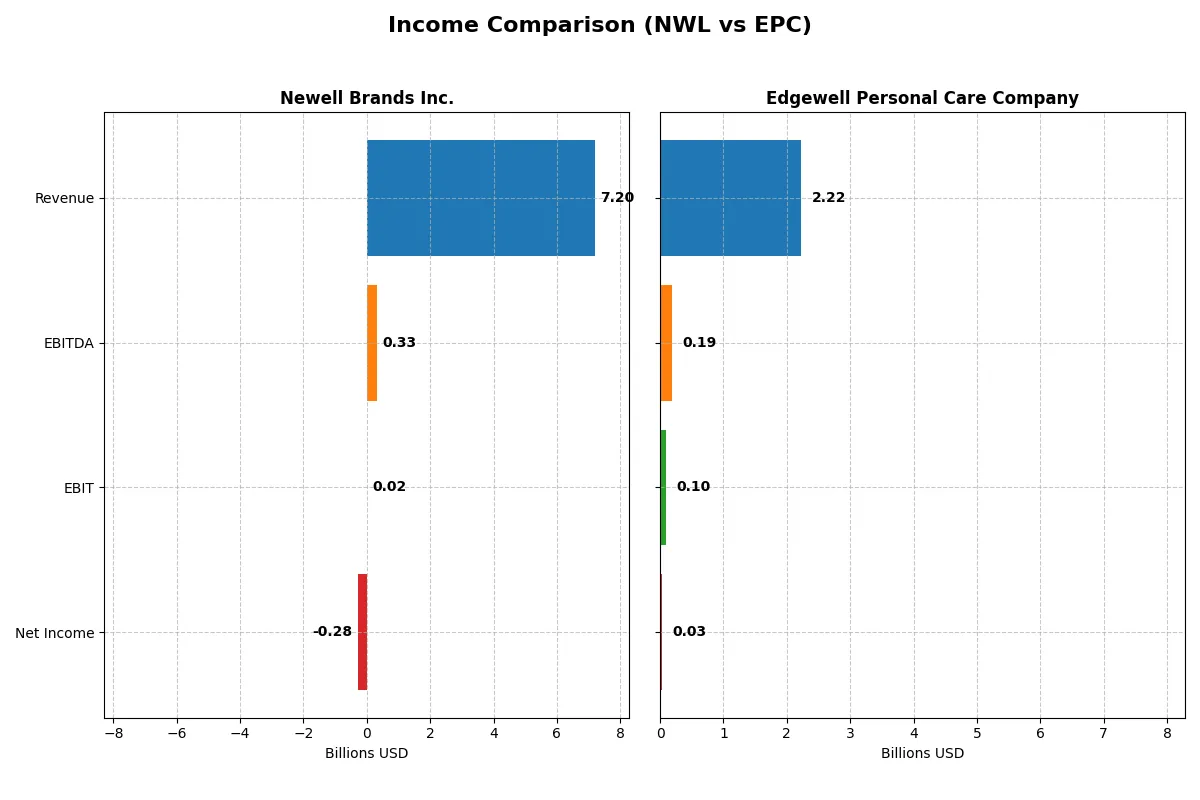
This data dissects the core profitability and scalability of both corporate engines to reveal who dominates the bottom line:
| Metric | Newell Brands Inc. (NWL) | Edgewell Personal Care Company (EPC) |
|---|---|---|
| Revenue | 7.2B | 2.2B |
| Cost of Revenue | 4.8B | 1.3B |
| Operating Expenses | 2.0B | 828M |
| Gross Profit | 2.4B | 925M |
| EBITDA | 331M | 186M |
| EBIT | 20M | 97M |
| Interest Expense | 321M | 73M |
| Net Income | -285M | 25M |
| EPS | -0.68 | 0.53 |
| Fiscal Year | 2025 | 2025 |
Income Statement Analysis: The Bottom-Line Duel
This income statement comparison exposes which company operates with greater efficiency and profitability under current market conditions.
Newell Brands Inc. Analysis
Newell Brands’ revenue slid nearly 5% in 2025, continuing a downward trend since 2021. Gross margins remain solid at 33.8%, but net margins turned negative at -4%, reflecting high interest costs and operating challenges. The latest year shows worsening net income losses, signaling deteriorating operational momentum.
Edgewell Personal Care Company Analysis
Edgewell’s revenue dipped slightly by 1.3% in 2025 but maintains a stronger gross margin of 41.6%. Net margins stay positive at 1.1%, albeit down sharply from prior years. Despite declining EBIT and net income, Edgewell demonstrates better cost control and operating efficiency than its peer.
Margin Resilience vs. Revenue Decline
Both companies face revenue headwinds and shrinking profits, yet Edgewell’s superior gross and net margins underscore a more resilient business model. Newell suffers deeper net losses and margin compression. For investors, Edgewell’s profile suggests steadier profitability, while Newell grapples with structural earnings challenges.
Financial Ratios Comparison
These vital ratios act as a diagnostic tool to expose the underlying fiscal health, valuation premiums, and capital efficiency of the companies compared below:
| Ratios | Newell Brands Inc. (NWL) | Edgewell Personal Care Company (EPC) |
|---|---|---|
| ROE | -11.9% | 1.64% |
| ROIC | 5.1% | 3.0% |
| P/E | -5.46 | 38.07 |
| P/B | 0.65 | 0.62 |
| Current Ratio | 1.07 | 1.76 |
| Quick Ratio | 0.57 | 0.90 |
| D/E (Debt-to-Equity) | 2.32 | 0.91 |
| Debt-to-Assets | 51.7% | 37.6% |
| Interest Coverage | 1.39 | 1.32 |
| Asset Turnover | 0.67 | 0.59 |
| Fixed Asset Turnover | 4.33 | 6.02 |
| Payout Ratio | -42.1% | 115.4% |
| Dividend Yield | 7.71% | 3.03% |
| Fiscal Year | 2025 | 2025 |
Efficiency & Valuation Duel: The Vital Signs
Financial ratios act as the company’s DNA, revealing hidden risks, operational efficiency, and valuation nuances critical for informed investment decisions.
Newell Brands Inc.
Newell Brands shows a stretched profitability with a negative ROE of -11.9% and a net margin of -4.0%. However, its valuation appears attractive, with a favorable P/E of -5.46 and P/B of 0.65. The company offers a solid 7.7% dividend yield, signaling steady shareholder returns despite operational headwinds.
Edgewell Personal Care Company
Edgewell posts modest profitability, with a 1.6% ROE and 1.1% net margin, but its valuation is expensive, reflected by a high P/E of 38.1. Its P/B of 0.62 and 3.0% dividend yield are more reasonable. Edgewell maintains a strong current ratio of 1.76, indicating healthy liquidity, while balancing growth reinvestment and shareholder payouts.
Premium Valuation vs. Operational Safety
Newell Brands offers a more attractive valuation and higher dividend yield but suffers from weak profitability and leverage concerns. Edgewell balances moderate returns with stronger liquidity and a neutral risk profile. Investors seeking income might prefer Newell, while those prioritizing operational safety may lean toward Edgewell.
Which one offers the Superior Shareholder Reward?
I compare Newell Brands Inc. (NWL) and Edgewell Personal Care Company (EPC) on dividends, payout ratios, and buybacks. NWL yields 7.7%, but its payout ratio is negative, signaling dividend stress. EPC yields 3.0% with a sustainable 115% payout ratio, backed by moderate free cash flow. NWL’s buybacks are minimal given its tight free cash flow (0.04/share), while EPC shows consistent buyback support amid stronger cash generation (0.87 FCF/share). EPC’s distribution balances dividends and buybacks sustainably. NWL’s high yield masks underlying profitability and leverage risks. I conclude EPC provides a superior total shareholder return profile for 2026 investors.
Comparative Score Analysis: The Strategic Profile
The radar chart reveals the fundamental DNA and trade-offs of Newell Brands and Edgewell Personal Care, highlighting their core financial strengths and weaknesses:
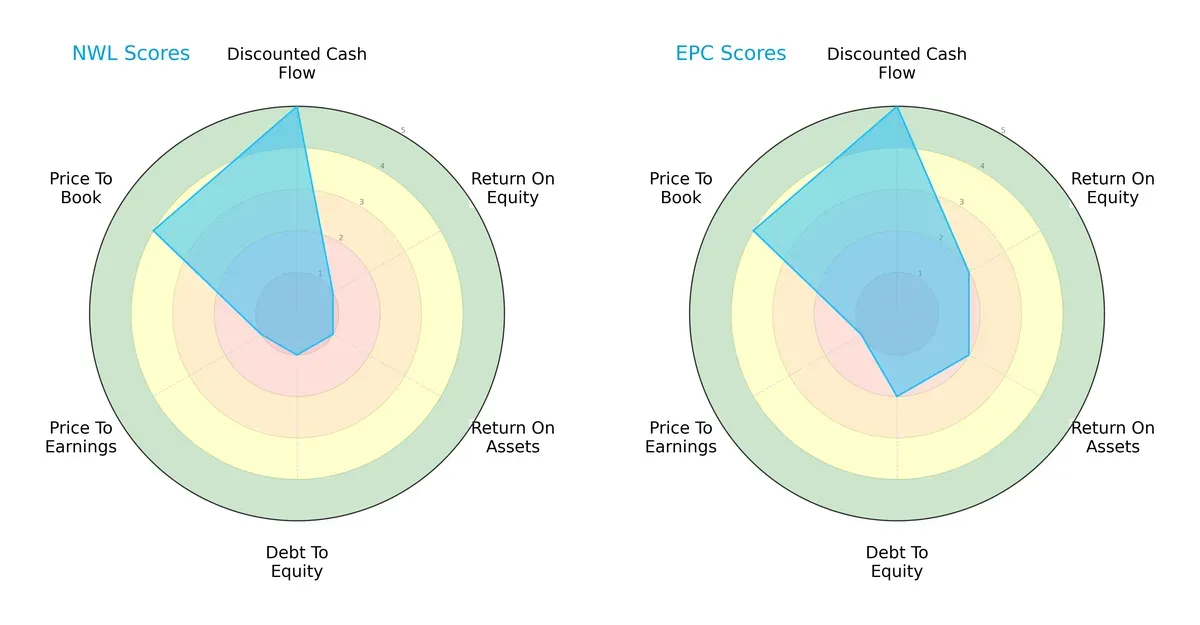
Newell Brands excels in discounted cash flow and price-to-book valuation, signaling strong intrinsic value and asset backing. However, it scores poorly in profitability (ROE, ROA), leverage (debt/equity), and valuation (P/E), indicating operational and financial strain. Edgewell offers a more balanced profile with moderate improvements in profitability and leverage but shares weaknesses in valuation metrics. Edgewell’s overall rating (B) outpaces Newell’s (C+), reflecting steadier financial footing despite modest profitability.
Bankruptcy Risk: Solvency Showdown
Newell’s Altman Z-Score at 0.84 versus Edgewell’s 1.47 places both in the distress zone, signaling elevated bankruptcy risk, but Edgewell shows a slightly less precarious position:
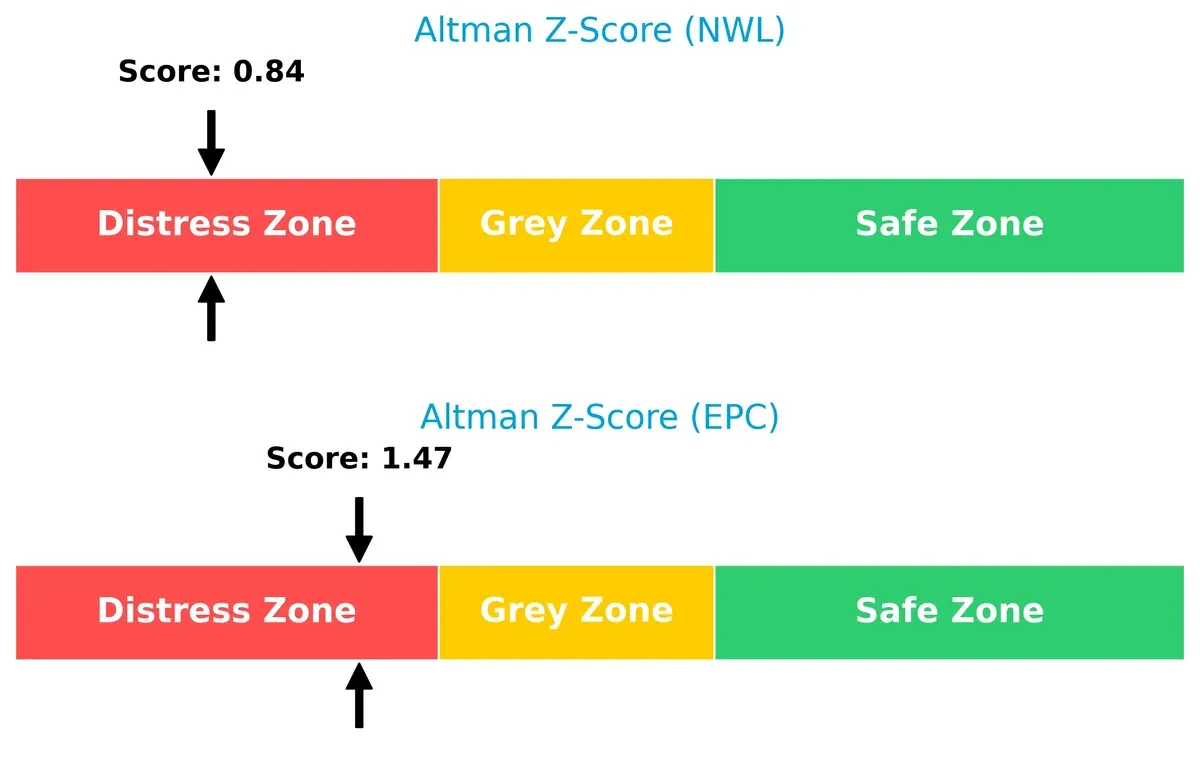
This suggests that neither firm currently enjoys a safe buffer against financial distress in this cycle. Investors must brace for volatility and closely monitor liquidity and debt management.
Financial Health: Quality of Operations
Newell’s Piotroski F-Score of 2 signals very weak financial health, while Edgewell’s score of 6 indicates average operational quality and fewer red flags:
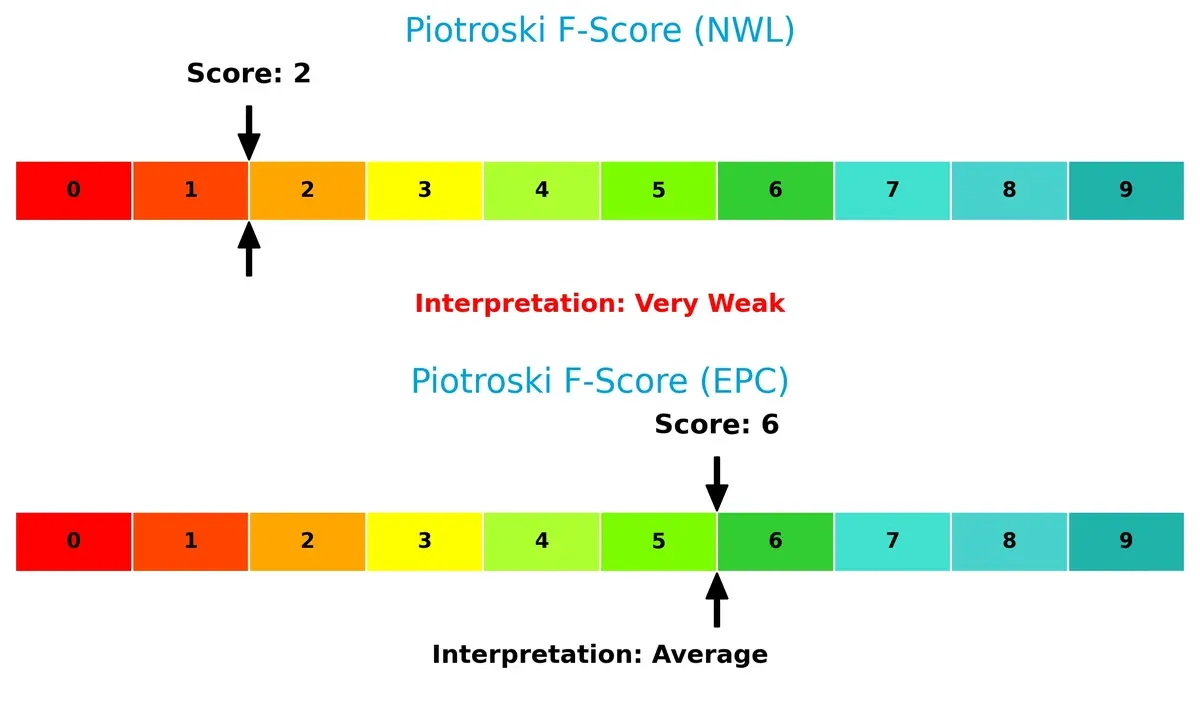
Edgewell’s stronger internal metrics reflect better profitability, efficiency, and balance sheet quality. Newell’s low score warns of potential internal weaknesses that could impair recovery and growth, demanding caution from investors.
How are the two companies positioned?
This section dissects the operational DNA of Newell Brands and Edgewell by comparing revenue distribution and internal dynamics. The goal is to confront their economic moats to reveal the most resilient competitive advantage today.
Revenue Segmentation: The Strategic Mix
This comparison dissects how Newell Brands Inc. and Edgewell Personal Care Company diversify their income streams and where their primary sector bets lie:
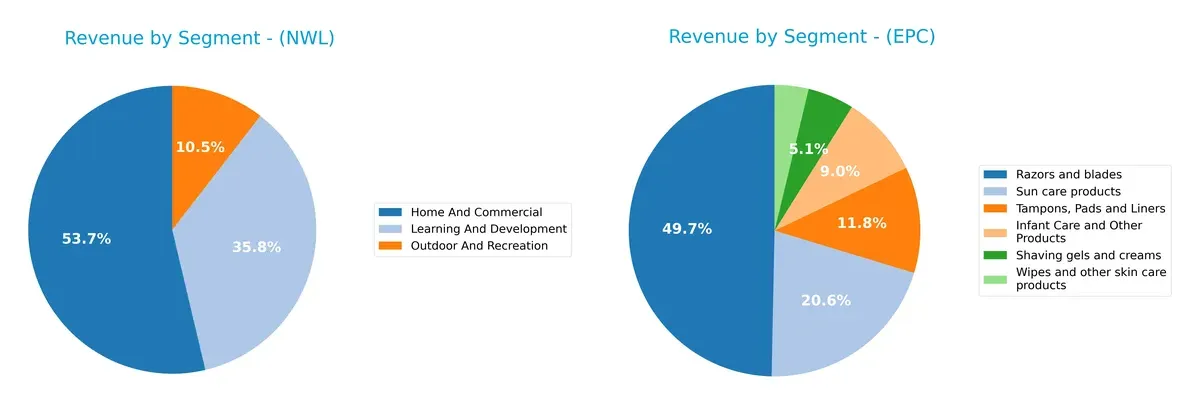
Newell Brands pivots on a more diversified portfolio with segments like Home and Commercial at $4.07B and Learning and Development at $2.72B in 2024. Edgewell relies heavily on Razors and Blades, anchoring $1.1B, while other segments like Sun Care ($459M) and Tampons, Pads and Liners ($262M) lag. Newell’s spread reduces concentration risk; Edgewell’s focus suggests strong ecosystem lock-in but exposes it to category-specific volatility.
Strengths and Weaknesses Comparison
This table compares the strengths and weaknesses of Newell Brands Inc. (NWL) and Edgewell Personal Care Company (EPC):
NWL Strengths
- Diverse product segments including Home, Learning, Outdoor
- Established North American and foreign markets
- Favorable fixed asset turnover and WACC
- Low price-to-book ratio indicates undervaluation
EPC Strengths
- Focused product categories with strong Razors and blades sales
- Higher current ratio indicates good short-term liquidity
- Favorable WACC and fixed asset turnover
- Moderate dividend yield supports shareholder returns
NWL Weaknesses
- Negative net margin and ROE indicate profitability issues
- High debt-to-equity and low interest coverage pose financial risk
- Quick ratio below 1 suggests liquidity concerns
- Net margin and ROIC only neutral or unfavorable
EPC Weaknesses
- Low profitability metrics with narrow net margin and ROE
- Elevated P/E ratio may reflect overvaluation risk
- Interest coverage is weak, indicating vulnerability to interest costs
- ROIC below WACC signals poor capital efficiency
Overall, NWL displays broad diversification and asset efficiency but struggles with profitability and financial leverage. EPC maintains solid liquidity and asset use but faces profitability and valuation pressures. These factors influence each company’s strategic focus on operational improvements or market positioning.
The Moat Duel: Analyzing Competitive Defensibility
A structural moat alone shields long-term profits from relentless competitive erosion in consumer products. Let’s dissect the core moats of Newell Brands and Edgewell Personal Care:
Newell Brands Inc.: Intangible Assets and Brand Portfolio Moat
Newell’s primary moat lies in its diverse portfolio of strong household brands, reflected in stable gross margins around 34%. Yet, declining revenues and profitability signal pressure on its intangible asset moat in 2026.
Edgewell Personal Care Company: Cost Advantage and Niche Market Focus
Edgewell leverages cost efficiencies and focused personal care segments. Its higher gross margin of 42% outperforms Newell’s, but shrinking EBIT and net margins reveal a weakening cost moat under competitive strain.
Intangible Assets vs. Cost Efficiency: The Moat Face-off
Both firms destroy value with declining ROICs below WACC, but Newell’s broader brand portfolio offers a deeper moat. Still, neither is well-positioned to defend market share without strategic turnaround.
Which stock offers better returns?
The past year reveals steep declines for both stocks, with recent months showing a recovery phase marked by stronger buyer dominance and accelerating price trends.
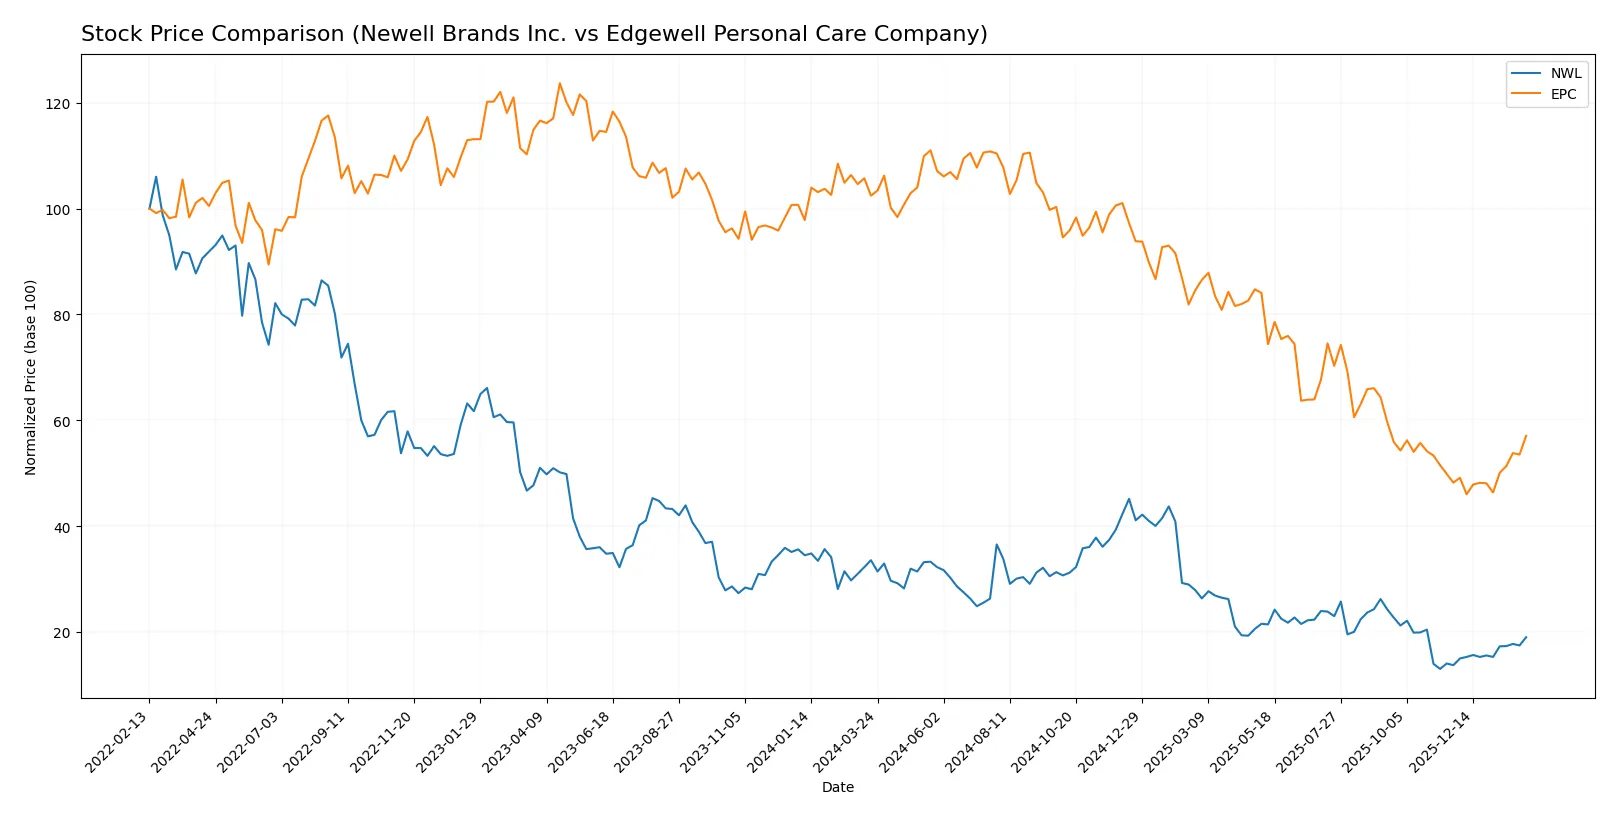
Trend Comparison
Newell Brands Inc. (NWL) shows a 43.4% price decline over the past 12 months, confirming a bearish trend with accelerating downward momentum. Recent data indicate a 38.62% rebound since late November 2025.
Edgewell Personal Care Company (EPC) dropped 44.31% during the same period, also bearish with accelerating losses and higher volatility (std dev 7.62). It gained 18.37% recently, showing a moderate recovery.
Comparing both, NWL outperforms EPC in recent market recovery and total volume, delivering the highest market performance despite sharp declines over the full year.
Target Prices
Analysts show a clear consensus on target prices for Newell Brands Inc. and Edgewell Personal Care Company.
| Company | Target Low | Target High | Consensus |
|---|---|---|---|
| Newell Brands Inc. | 4.25 | 8.00 | 5.58 |
| Edgewell Personal Care Company | 20.00 | 23.00 | 21.50 |
The consensus target for Newell Brands sits modestly above its current price of 4.63, implying cautious upside. Edgewell’s target consensus of 21.5 exceeds its 20.75 share price, signaling moderate analyst confidence.

Don’t Let Luck Decide Your Entry Point
Optimize your entry points with our advanced ProRealTime indicators. You’ll get efficient buy signals with precise price targets for maximum performance. Start outperforming now!
How do institutions grade them?
Newell Brands Inc. Grades
The following table summarizes recent grades issued by reputable institutions for Newell Brands Inc.:
| Grading Company | Action | New Grade | Date |
|---|---|---|---|
| Canaccord Genuity | Maintain | Buy | 2026-01-26 |
| UBS | Maintain | Neutral | 2026-01-14 |
| Citigroup | Maintain | Neutral | 2026-01-14 |
| Citigroup | Maintain | Neutral | 2025-12-17 |
| UBS | Maintain | Neutral | 2025-12-02 |
| Canaccord Genuity | Maintain | Buy | 2025-11-03 |
| RBC Capital | Maintain | Sector Perform | 2025-11-03 |
| Citigroup | Maintain | Neutral | 2025-11-03 |
| JP Morgan | Maintain | Overweight | 2025-11-03 |
| JP Morgan | Maintain | Overweight | 2025-10-23 |
Edgewell Personal Care Company Grades
Below is a summary of recent institutional grades for Edgewell Personal Care Company:
| Grading Company | Action | New Grade | Date |
|---|---|---|---|
| Wells Fargo | Maintain | Overweight | 2026-01-05 |
| Morgan Stanley | Maintain | Equal Weight | 2025-11-18 |
| Barclays | Maintain | Equal Weight | 2025-11-14 |
| RBC Capital | Maintain | Outperform | 2025-11-14 |
| Wells Fargo | Maintain | Overweight | 2025-11-14 |
| Wells Fargo | Maintain | Overweight | 2025-09-25 |
| Morgan Stanley | Upgrade | Equal Weight | 2025-08-06 |
| Canaccord Genuity | Maintain | Buy | 2025-08-06 |
| UBS | Maintain | Neutral | 2025-08-06 |
| Barclays | Maintain | Equal Weight | 2025-08-06 |
Which company has the best grades?
Newell Brands receives a strong consensus of Buy and Overweight ratings, while Edgewell’s grades cluster around Overweight and Equal Weight, with one Outperform. Newell’s more consistent Buy signals might indicate stronger institutional confidence, potentially attracting investors seeking clearer positive momentum.
Risks specific to each company
The following categories identify critical pressure points and systemic threats facing Newell Brands Inc. and Edgewell Personal Care Company in the 2026 market environment:
1. Market & Competition
Newell Brands Inc.
- Faces intense competition in diverse consumer product segments, requiring constant innovation to maintain market share.
Edgewell Personal Care Company
- Operates in a concentrated personal care niche with strong brand presence but vulnerable to shifting consumer preferences.
2. Capital Structure & Debt
Newell Brands Inc.
- High debt-to-equity ratio (2.32) and interest coverage near zero signal significant financial risk and low buffer for debt servicing.
Edgewell Personal Care Company
- Moderate leverage (debt-to-equity 0.91) with better interest coverage, indicating more resilient capital structure.
3. Stock Volatility
Newell Brands Inc.
- Beta of 0.929 suggests stock moves roughly in line with the market, implying moderate volatility.
Edgewell Personal Care Company
- Lower beta at 0.628 indicates relatively lower volatility and defensive stock behavior.
4. Regulatory & Legal
Newell Brands Inc.
- Must comply with broad regulatory standards across multiple product categories, increasing complexity and risk.
Edgewell Personal Care Company
- Faces regulatory scrutiny focused on personal care product safety and labeling, with potential for costly compliance.
5. Supply Chain & Operations
Newell Brands Inc.
- Diverse global supply chain exposes it to disruptions and cost inflation risks across many segments.
Edgewell Personal Care Company
- More concentrated supply chain in personal care segments, somewhat reducing complexity but still vulnerable to raw material price swings.
6. ESG & Climate Transition
Newell Brands Inc.
- Larger footprint requires substantial investment in sustainable operations to meet evolving ESG standards.
Edgewell Personal Care Company
- Smaller scale enables quicker adaptation but limited resources may constrain ESG initiatives.
7. Geopolitical Exposure
Newell Brands Inc.
- Global operations expose it to geopolitical tensions, tariffs, and trade policy shifts.
Edgewell Personal Care Company
- Primarily US-based operations reduce geopolitical risk but limit international growth opportunities.
Which company shows a better risk-adjusted profile?
Newell Brands’ most pressing risk is its precarious capital structure, marked by heavy debt and near-zero interest coverage. Edgewell faces significant market and valuation risk, with a high P/E and moderate profitability. Edgewell’s stronger liquidity and lower leverage yield a more balanced risk profile. Notably, Newell’s Altman Z-Score in the distress zone underscores acute bankruptcy risk, whereas Edgewell, also in distress, maintains a better Piotroski score, signaling comparatively stronger financial health. Overall, Edgewell demonstrates a superior risk-adjusted profile amid 2026’s challenging landscape.
Final Verdict: Which stock to choose?
Newell Brands Inc. wields a notable superpower in its strong asset turnover, demonstrating operational efficiency in managing its fixed assets. However, its persistent value destruction and weakening profitability remain points of vigilance. It might appeal to investors targeting aggressive growth with a high tolerance for operational turnaround risks.
Edgewell Personal Care Company leverages a strategic moat rooted in its recurring revenue streams and solid gross margins. Compared to Newell, it offers better liquidity and a more stable balance sheet, presenting a safer profile. It could fit well within a GARP (Growth at a Reasonable Price) portfolio seeking moderate growth with financial discipline.
If you prioritize operational efficiency and are willing to navigate value erosion risks, Newell Brands might be the compelling choice due to its asset utilization. However, if you seek more stability and a defensible market position, Edgewell offers better financial resilience despite its modest growth outlook. Both present analytical scenarios of risk and potential depending on your investment appetite.
Disclaimer: Investment carries a risk of loss of initial capital. The past performance is not a reliable indicator of future results. Be sure to understand risks before making an investment decision.
Go Further
I encourage you to read the complete analyses of Newell Brands Inc. and Edgewell Personal Care Company to enhance your investment decisions: