Home > Comparison > Consumer Defensive > KMB vs EPC
The strategic rivalry between Kimberly-Clark Corporation and Edgewell Personal Care Company shapes the competitive landscape of the household and personal products sector. Kimberly-Clark operates as a diversified consumer defensive giant with broad product lines, while Edgewell focuses on niche personal care segments like wet shave and skin care. This analysis pits scale against specialization to determine which business model offers superior risk-adjusted returns for a diversified portfolio in 2026.
Table of contents
Companies Overview
Kimberly-Clark and Edgewell Personal Care shape the global personal care market with distinct scale and focus.
Kimberly-Clark Corporation: Global Leader in Consumer Tissue and Personal Care
Kimberly-Clark commands the household and personal products sector with a $33B market cap. It generates revenue by manufacturing and marketing personal care items, consumer tissue, and professional products. Its 2026 strategy emphasizes brand strength through iconic lines like Huggies and Kleenex, leveraging broad retail and institutional distribution for global reach.
Edgewell Personal Care Company: Specialized Personal Care Innovator
Edgewell Personal Care operates in the personal care niche with a $900M market cap. Its revenue stems from wet shave, sun and skin care, and feminine care products under brands like Schick and Banana Boat. The company’s 2026 focus centers on innovation and category diversification to capture market segments in grooming and skin protection.
Strategic Collision: Similarities & Divergences
Kimberly-Clark pursues a broad mass-market approach, while Edgewell targets specialized segments with innovation-driven brands. Both compete fiercely in personal care but differ in scale and distribution breadth. Kimberly-Clark’s deep brand portfolio contrasts with Edgewell’s nimble product focus, defining distinct investment profiles—one a stable giant, the other a focused challenger.
Income Statement Comparison
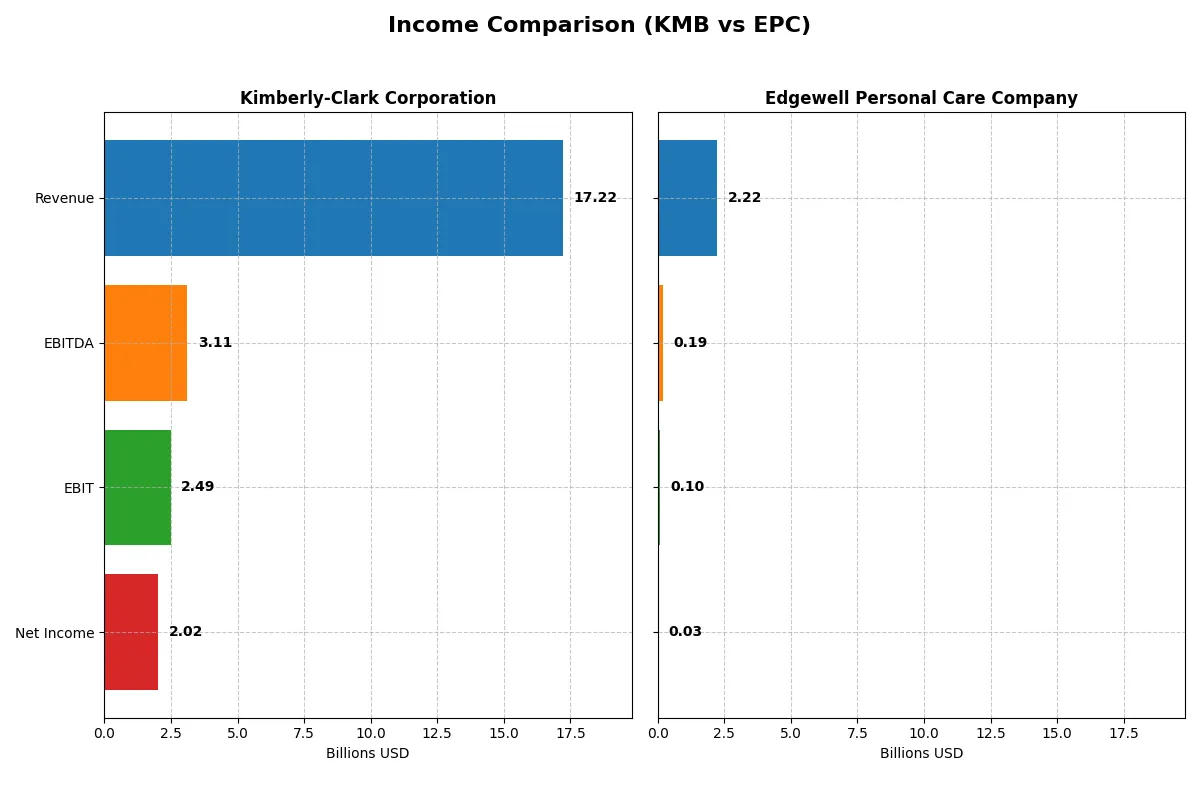
This data dissects the core profitability and scalability of both corporate engines to reveal who dominates the bottom line:
| Metric | Kimberly-Clark Corporation (KMB) | Edgewell Personal Care Company (EPC) |
|---|---|---|
| Revenue | 17.2B | 2.22B |
| Cost of Revenue | 11.1B | 1.30B |
| Operating Expenses | 3.64B | 828M |
| Gross Profit | 6.13B | 925M |
| EBITDA | 3.11B | 186M |
| EBIT | 2.49B | 97M |
| Interest Expense | 256M | 73M |
| Net Income | 2.02B | 25.4M |
| EPS | 6.08 | 0.53 |
| Fiscal Year | 2025 | 2025 |
Income Statement Analysis: The Bottom-Line Duel
This income statement comparison reveals which company drives more efficient profit generation and sustainable margin control.
Kimberly-Clark Corporation Analysis
Kimberly-Clark’s revenue declined 14% from 20B in 2024 to 17.2B in 2025, yet net income remained resilient at 2B. Gross margin stays strong at 35.6%, and net margin holds a healthy 11.7%, reflecting efficient cost management despite top-line pressure. The 2025 drop in EBIT and EPS signals short-term momentum loss but solid profitability endures.
Edgewell Personal Care Company Analysis
Edgewell’s revenue edged down slightly to 2.22B in 2025 from 2.25B in 2024. Gross margin at 41.6% exceeds Kimberly-Clark’s, but EBIT margin contracts sharply to 4.35%, dragging net margin down to 1.14%. Net income plunged over 70% year-over-year, highlighting operational challenges and weakening earnings power in the latest fiscal year.
Margin Strength vs. Earnings Durability
Kimberly-Clark demonstrates superior margin stability and a robust net income base despite revenue declines. Edgewell’s higher gross margin fails to translate into meaningful profits, with net income and margins deteriorating significantly. For investors, Kimberly-Clark’s profile offers more reliable earnings and margin durability over cyclical fluctuations.
Financial Ratios Comparison
These vital ratios act as a diagnostic tool to expose the underlying fiscal health, valuation premiums, and capital efficiency of Kimberly-Clark Corporation (KMB) and Edgewell Personal Care Company (EPC):
| Ratios | Kimberly-Clark (KMB) | Edgewell Personal Care (EPC) |
|---|---|---|
| ROE | 3.03% (2024) | 6.22% (2024) |
| ROIC | 25.33% (2024) | 5.07% (2024) |
| P/E | 17.35 (2024) | 18.32 (2024) |
| P/B | 52.57 (2024) | 1.14 (2024) |
| Current Ratio | 0.80 (2024) | 1.66 (2024) |
| Quick Ratio | 0.54 (2024) | 0.81 (2024) |
| D/E | 9.42 (2024) | 0.87 (2024) |
| Debt-to-Assets | 47.84% (2024) | 37.15% (2024) |
| Interest Coverage | 11.89 (2024) | 2.61 (2024) |
| Asset Turnover | 1.21 (2024) | 0.60 (2024) |
| Fixed Asset Turnover | 2.67 (2024) | 5.19 (2024) |
| Payout Ratio | 64.0% (2024) | 31.1% (2024) |
| Dividend Yield | 3.69% (2024) | 1.70% (2024) |
| Fiscal Year | 2024 | 2024 |
Efficiency & Valuation Duel: The Vital Signs
Financial ratios act as the company’s DNA, uncovering hidden risks and revealing operational excellence critical for investment analysis.
Kimberly-Clark Corporation
Kimberly-Clark shows strong profitability with an 11.74% net margin but struggles with zero ROE and ROIC, signaling operational challenges. Its P/E of 16.63 suggests a fair valuation, neither expensive nor cheap. The 4.94% dividend yield rewards shareholders consistently, reflecting a mature capital allocation focused on income rather than aggressive growth.
Edgewell Personal Care Company
Edgewell posts low profitability with a 1.14% net margin and weak ROE at 1.64%, indicating limited efficiency. Its P/E ratio of 38.07 marks the stock as expensive relative to earnings. The 3.03% dividend yield offers some income, but high leverage and low interest coverage pose material risks, complicating the valuation despite moderate asset turnover.
Mature Profitability vs. Growth Risk
Kimberly-Clark balances steady dividends and fair valuation against weak returns on equity and invested capital. Edgewell’s premium valuation and modest dividends come with operational and financial risks. Investors seeking income and stability may prefer Kimberly-Clark, while those tolerating risk for growth potential might consider Edgewell’s profile.
Which one offers the Superior Shareholder Reward?
I see Kimberly-Clark (KMB) delivers a 4.94% dividend yield with a high 82% payout ratio, supported by solid free cash flow (FCF) coverage above 1.6x. Its buybacks are steady but overshadowed by the capital-intensive, debt-heavy balance sheet. Edgewell Personal Care (EPC) yields 3.03% but maintains a conservative 115% payout ratio, signaling risk or special dividends. EPC’s buybacks are modest, and reinvestment focuses on growth and efficiency improvements. EPC’s lower leverage and stronger operating cash flow margins suggest a more sustainable distribution model. I conclude EPC offers a superior total return profile in 2026 due to its balanced capital allocation and healthier financials despite a lower yield.
Comparative Score Analysis: The Strategic Profile
The radar chart reveals the fundamental DNA and trade-offs of Kimberly-Clark Corporation and Edgewell Personal Care Company:
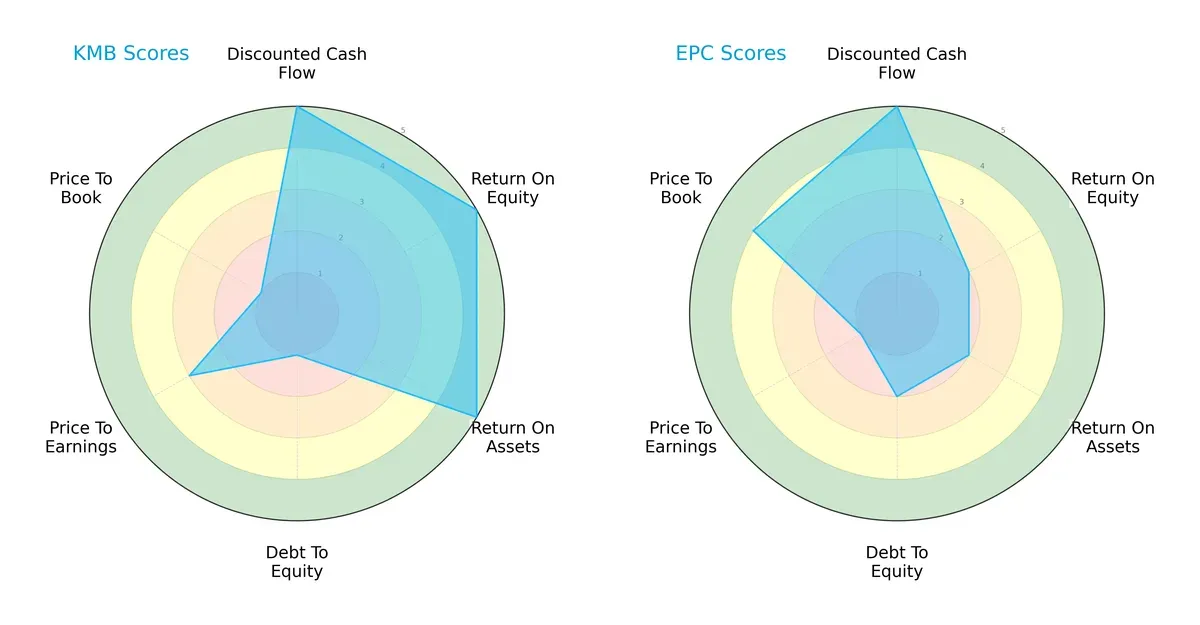
Kimberly-Clark exhibits a highly balanced profile, excelling in DCF, ROE, and ROA with top scores of 5, but struggles with debt-to-equity and price-to-book ratios. Edgewell matches Kimberly-Clark’s DCF strength but lags significantly in profitability metrics and valuation, relying more on a favorable price-to-book score. Kimberly-Clark’s strength lies in operational efficiency, while Edgewell depends on valuation appeal.
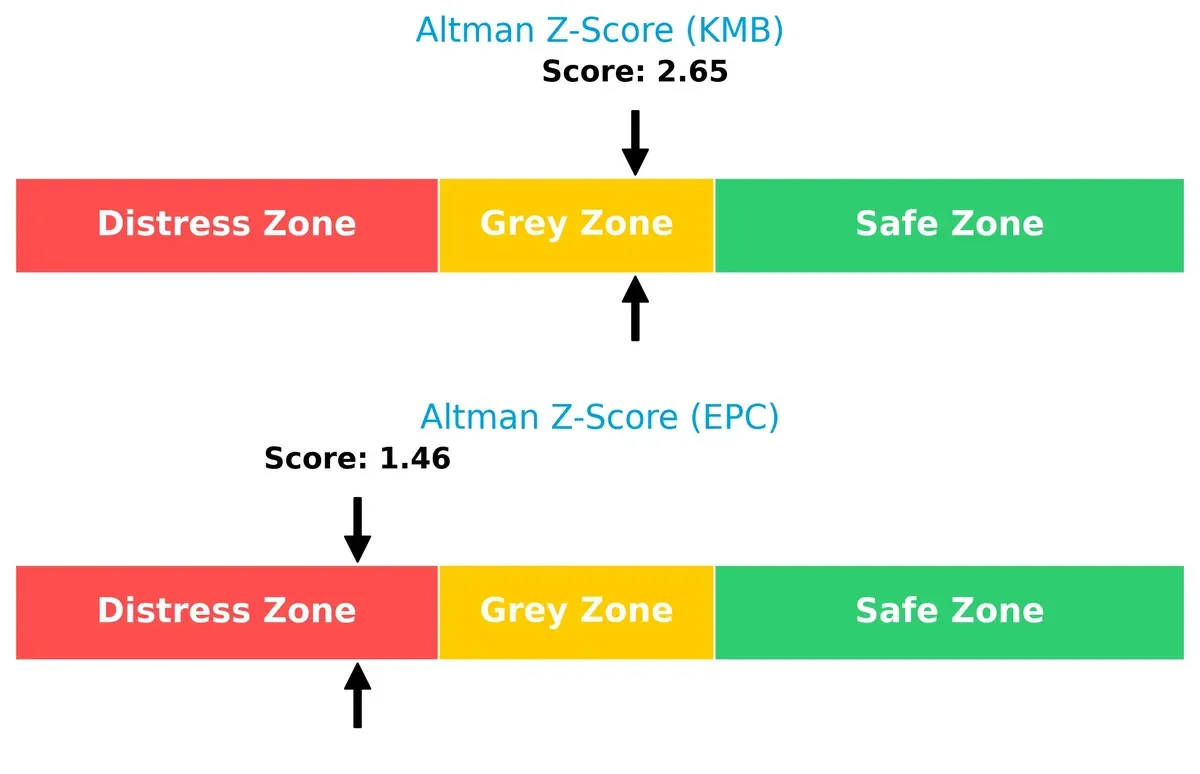
Bankruptcy Risk: Solvency Showdown
Kimberly-Clark’s Altman Z-Score of 2.65 places it in the grey zone, signaling moderate financial risk. Edgewell’s score of 1.46 puts it in the distress zone, indicating heightened bankruptcy risk in this economic cycle:
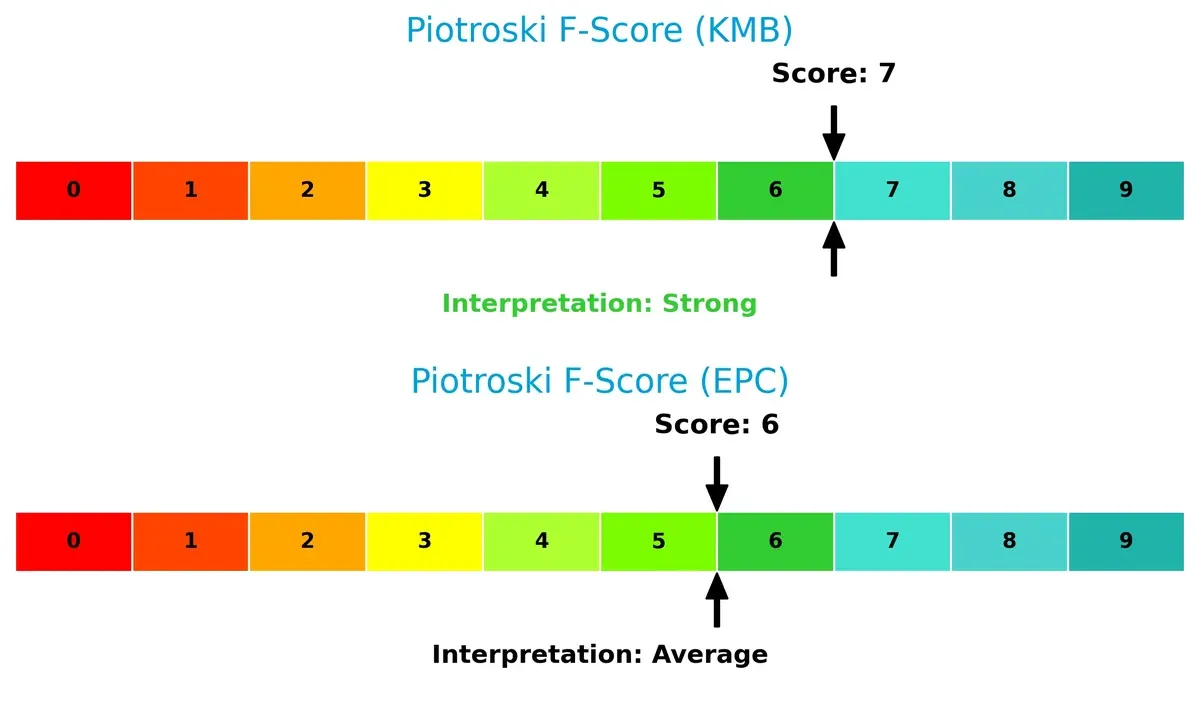
Financial Health: Quality of Operations
Kimberly-Clark posts a strong Piotroski F-Score of 7, reflecting robust financial health and operational quality. Edgewell’s score of 6 is average, suggesting some internal metric weaknesses compared to Kimberly-Clark:
How are the two companies positioned?
This section dissects the operational DNA of Kimberly-Clark and Edgewell by comparing their revenue distribution and internal dynamics of strengths and weaknesses. The final goal is to confront their economic moats and identify which business model offers the most resilient competitive advantage today.
Revenue Segmentation: The Strategic Mix
The following visual comparison dissects how Kimberly-Clark Corporation and Edgewell Personal Care diversify their income streams and where their primary sector bets lie:
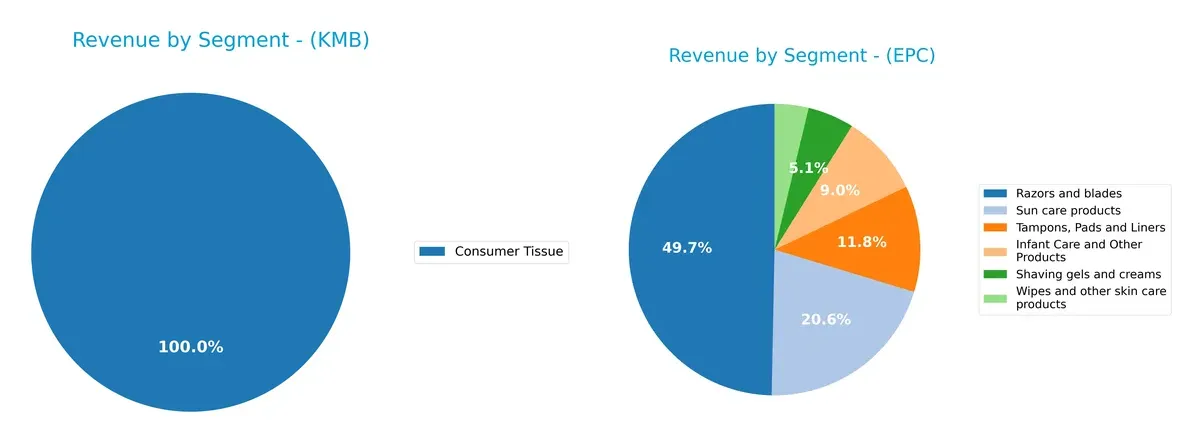
Kimberly-Clark anchors its revenue in Personal Care, generating over $10B, complemented by Consumer Tissue (~$6B) and K-C Professional (~$3.4B). This mix shows moderate diversification with a strong consumer essentials focus. Edgewell Personal Care pivots around Razors and Blades (~$1.1B), but spreads revenue across Sun Care ($459M), Tampons, Pads and Liners ($262M), and other categories. Edgewell’s broader product base reduces concentration risk, while Kimberly-Clark’s dominance in Personal Care signals deep ecosystem lock-in.
Strengths and Weaknesses Comparison
This table compares the strengths and weaknesses of Kimberly-Clark Corporation (KMB) and Edgewell Personal Care Company (EPC):
KMB Strengths
- Diversified revenue across Consumer Tissue, K-C Professional, and Personal Care segments
- Favorable net margin at 11.74%
- Strong dividend yield of 4.94%
- Low debt-to-assets ratio and good interest coverage
EPC Strengths
- Presence in diverse personal care categories including razors, sun care, and feminine products
- Favorable weighted average cost of capital (5.28%)
- Strong fixed asset turnover (6.02)
- Positive current ratio (1.76) and dividend yield (3.03%)
KMB Weaknesses
- Unfavorable return on equity and return on invested capital at 0%
- Poor liquidity ratios (current and quick ratios at 0)
- Unavailable WACC data
- Low asset and fixed asset turnover
EPC Weaknesses
- Low net margin (1.14%) and weak return on equity (1.64%) and ROIC (3.0%)
- High price-to-earnings ratio (38.07) indicating overvaluation risk
- Weak interest coverage ratio (1.32)
- Moderate debt-to-equity ratio (0.91) and debt-to-assets (37.61%)
Kimberly-Clark shows strength in profitability, dividend yield, and conservative leverage but suffers from liquidity and efficiency issues. Edgewell demonstrates operational asset efficiency and balanced liquidity but faces challenges in profitability and valuation metrics. These contrasts highlight differing strategic and financial positioning in their markets.
The Moat Duel: Analyzing Competitive Defensibility
A structural moat is the only reliable shield against relentless competition eroding long-term profits. Let’s dissect how Kimberly-Clark and Edgewell Personal Care defend their turf:
Kimberly-Clark Corporation: Intangible Assets Cementing Brand Leadership
Kimberly-Clark leverages powerful brand recognition and product innovation, reflected in stable 35.6% gross margins and 11.7% net margins. Despite recent revenue softness, new markets could reinforce its moat in 2026.
Edgewell Personal Care Company: Cost Disadvantage and Margin Pressure
Edgewell’s moat relies on niche product segments but suffers from weaker margins (41.6% gross, 1.1% net) and shrinking returns, contrasting Kimberly-Clark’s scale. Expansion into premium skincare may offer growth, but value destruction persists.
Brand Equity vs. Operational Efficiency: The Moat Verdict
Kimberly-Clark’s intangible asset moat is wider and more durable than Edgewell’s fragmented positioning. Its superior margin stability and brand depth better defend market share amid rising competition in 2026.
Which stock offers better returns?
Over the past year, Kimberly-Clark and Edgewell stocks both trended downward, with significant price declines and contrasting recent momentum patterns.
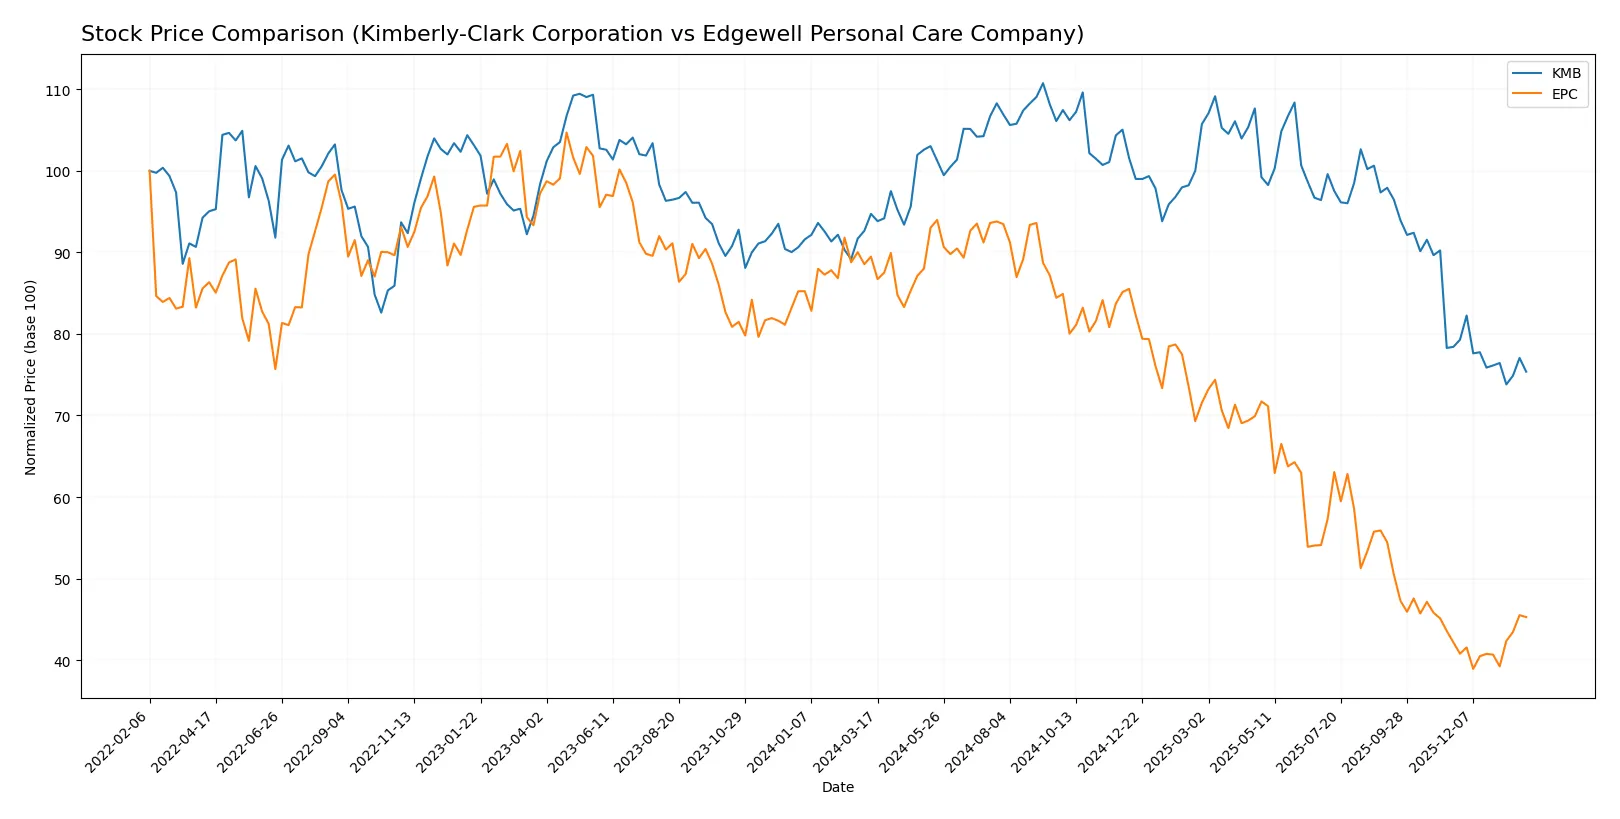
Trend Comparison
Kimberly-Clark’s stock declined 20.42% over the last 12 months, showing a bearish trend with decelerating losses. The price ranged between 147 and 98, with increased trading volume favoring buyers.
Edgewell’s stock fell sharply by 49.39%, marking a bearish trend but with accelerating losses. Recently, it gained 7.34%, indicating a short-term rebound amid neutral buyer-seller volume balance.
Kimberly-Clark’s decline was less severe than Edgewell’s, delivering relatively stronger market performance over the past year.
Target Prices
Analysts provide a clear consensus on target prices for Kimberly-Clark and Edgewell Personal Care.
| Company | Target Low | Target High | Consensus |
|---|---|---|---|
| Kimberly-Clark Corporation | 102 | 162 | 122.38 |
| Edgewell Personal Care Company | 20 | 23 | 21.5 |
The consensus target for Kimberly-Clark sits about 22% above its current price, signaling moderate upside. Edgewell’s target is roughly 10% higher than its current trading level, reflecting cautious optimism.

Don’t Let Luck Decide Your Entry Point
Optimize your entry points with our advanced ProRealTime indicators. You’ll get efficient buy signals with precise price targets for maximum performance. Start outperforming now!
How do institutions grade them?
Here is a summary of recent institutional grades for Kimberly-Clark Corporation and Edgewell Personal Care Company:
Kimberly-Clark Corporation Grades
This table presents the latest grades issued by recognized financial institutions for Kimberly-Clark Corporation.
| Grading Company | Action | New Grade | Date |
|---|---|---|---|
| UBS | Maintain | Neutral | 2026-01-28 |
| Citigroup | Maintain | Sell | 2026-01-14 |
| UBS | Maintain | Neutral | 2026-01-14 |
| TD Cowen | Maintain | Hold | 2026-01-08 |
| Wells Fargo | Maintain | Equal Weight | 2026-01-05 |
| Citigroup | Maintain | Sell | 2025-12-17 |
| BNP Paribas Exane | Maintain | Neutral | 2025-12-01 |
| Argus Research | Upgrade | Buy | 2025-11-13 |
| Wells Fargo | Maintain | Equal Weight | 2025-11-04 |
| Evercore ISI Group | Downgrade | In Line | 2025-11-04 |
Edgewell Personal Care Company Grades
Below are the recent grades from reputable grading firms for Edgewell Personal Care Company.
| Grading Company | Action | New Grade | Date |
|---|---|---|---|
| Wells Fargo | Maintain | Overweight | 2026-01-05 |
| Morgan Stanley | Maintain | Equal Weight | 2025-11-18 |
| Barclays | Maintain | Equal Weight | 2025-11-14 |
| Wells Fargo | Maintain | Overweight | 2025-11-14 |
| RBC Capital | Maintain | Outperform | 2025-11-14 |
| Wells Fargo | Maintain | Overweight | 2025-09-25 |
| Canaccord Genuity | Maintain | Buy | 2025-08-06 |
| Morgan Stanley | Upgrade | Equal Weight | 2025-08-06 |
| UBS | Maintain | Neutral | 2025-08-06 |
| Barclays | Maintain | Equal Weight | 2025-08-06 |
Which company has the best grades?
Edgewell Personal Care consistently secures higher ratings, including Overweight and Outperform. Kimberly-Clark mostly receives Neutral to Sell grades, with few upgrades. This disparity may influence investor sentiment and portfolio positioning.
Risks specific to each company
The following risk categories identify the critical pressure points and systemic threats facing Kimberly-Clark Corporation and Edgewell Personal Care Company in the 2026 market environment:
1. Market & Competition
Kimberly-Clark Corporation
- Strong brand portfolio with global reach, but faces intense competition in personal care segments
Edgewell Personal Care Company
- Smaller market cap limits scale; competes aggressively in niche personal care and shaving markets
2. Capital Structure & Debt
Kimberly-Clark Corporation
- Favorable debt metrics and strong interest coverage; low leverage enhances financial stability
Edgewell Personal Care Company
- Moderate debt-to-equity ratio around 0.91; weaker interest coverage poses refinancing risks
3. Stock Volatility
Kimberly-Clark Corporation
- Low beta (0.276) indicates defensive stock with limited price swings
Edgewell Personal Care Company
- Higher beta (0.616) signals more volatility and market sensitivity
4. Regulatory & Legal
Kimberly-Clark Corporation
- Operates in mature, regulated consumer goods space with manageable compliance costs
Edgewell Personal Care Company
- Faces regulatory scrutiny in personal care and cosmetics, with potential risk from evolving safety standards
5. Supply Chain & Operations
Kimberly-Clark Corporation
- Large, complex global supply chain vulnerable to raw material inflation and logistics disruptions
Edgewell Personal Care Company
- Smaller scale supply chain may offer agility but risks higher per-unit costs and sourcing challenges
6. ESG & Climate Transition
Kimberly-Clark Corporation
- Increasing ESG commitments; pressure to reduce environmental footprint in tissue and personal care products
Edgewell Personal Care Company
- ESG policies improving but less mature; climate transition costs could impact margins
7. Geopolitical Exposure
Kimberly-Clark Corporation
- Global footprint exposes it to currency fluctuations and trade tensions
Edgewell Personal Care Company
- Primarily US-focused but still exposed to import tariffs and geopolitical uncertainties
Which company shows a better risk-adjusted profile?
Kimberly-Clark’s strongest risk is operational complexity and supply chain inflation. Edgewell’s biggest risk is its weaker capital structure and higher stock volatility. Kimberly-Clark offers a more stable risk-adjusted profile, supported by superior debt metrics and lower beta. Edgewell’s distress-level Altman Z-score signals elevated bankruptcy risk, while Kimberly-Clark remains in the grey zone with stronger financial health. The recent low beta and robust interest coverage at Kimberly-Clark justify my confidence in its defensive positioning amid 2026 uncertainties.
Final Verdict: Which stock to choose?
Kimberly-Clark Corporation’s superpower lies in its resilient cash flow generation and solid dividend yield, appealing to income-focused investors. Its point of vigilance is a declining revenue trend and weakening liquidity, which could pressure near-term stability. It suits portfolios targeting steady income with moderate risk tolerance.
Edgewell Personal Care’s strategic moat centers on its niche personal care brands and relatively stronger liquidity position, offering better short-term financial flexibility than Kimberly-Clark. However, its value destruction and diminishing profitability highlight operational challenges. It fits growth-at-a-reasonable-price (GARP) portfolios willing to tolerate volatility.
If you prioritize consistent income and established cash generation, Kimberly-Clark is the compelling choice due to its dividend strength and operational scale. However, if you seek upside potential from a turnaround story with liquidity resilience, Edgewell offers better tactical exposure despite its profitability headwinds. Both require careful risk management given sector headwinds and financial pressures.
Disclaimer: Investment carries a risk of loss of initial capital. The past performance is not a reliable indicator of future results. Be sure to understand risks before making an investment decision.
Go Further
I encourage you to read the complete analyses of Kimberly-Clark Corporation and Edgewell Personal Care Company to enhance your investment decisions: