Home > Comparison > Basic Materials > SHW vs ECL
The strategic rivalry between The Sherwin-Williams Company and Ecolab Inc. defines the current trajectory of the specialty chemicals sector. Sherwin-Williams operates as a capital-intensive industrial giant focusing on paints and coatings, while Ecolab specializes in high-margin water, hygiene, and infection prevention services. This analysis pits Sherwin-Williams’ manufacturing scale against Ecolab’s service innovation to identify which corporate trajectory offers superior risk-adjusted returns for a diversified portfolio.
Table of contents
Companies Overview
The Sherwin-Williams Company and Ecolab Inc. stand as pillars in the specialty chemicals industry, shaping diverse markets globally.
The Sherwin-Williams Company: Specialty Coatings Powerhouse
The Sherwin-Williams Company dominates as a leading manufacturer and distributor of paints and coatings. It earns revenue through three core segments: Americas Group, Consumer Brands, and Performance Coatings. In 2026, its strategic focus centers on expanding its retail footprint with 5,000 company-operated stores, leveraging direct sales and strong brand recognition to maintain its competitive edge.
Ecolab Inc.: Water and Hygiene Solutions Leader
Ecolab Inc. excels in providing water treatment, hygiene, and infection prevention services worldwide. Revenues flow from its Global Industrial, Institutional & Specialty, and Healthcare segments. In 2026, Ecolab emphasizes integrated solutions combining chemical products with technology-driven water and energy management programs, targeting sectors from manufacturing to healthcare with tailored service models.
Strategic Collision: Similarities & Divergences
Both companies operate in specialty chemicals but diverge sharply in business philosophy. Sherwin-Williams relies on a closed ecosystem of branded coatings and retail stores, while Ecolab offers an open infrastructure of service-driven chemical solutions. They clash primarily in industrial and institutional markets, competing on innovation and client integration. Their investment profiles differ: Sherwin-Williams focuses on scale and distribution, Ecolab on technology and service complexity.
Income Statement Comparison
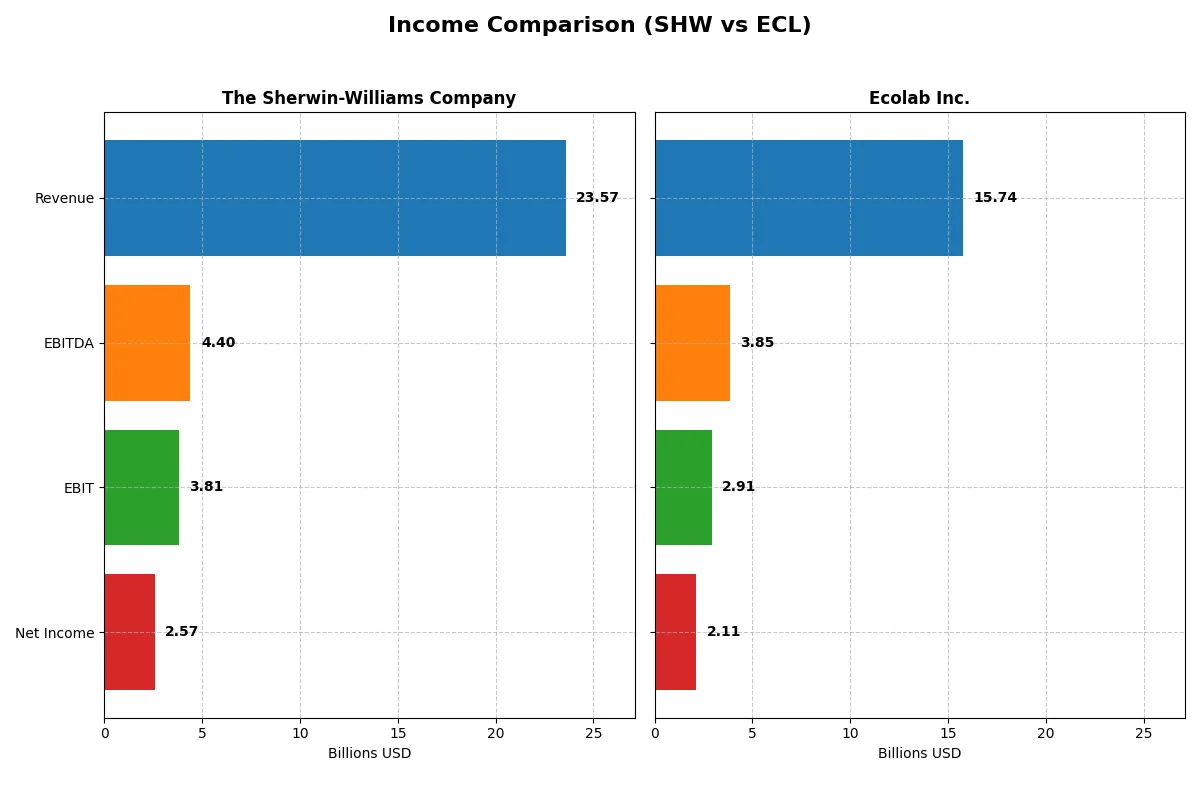
This data dissects the core profitability and scalability of both corporate engines to reveal who dominates the bottom line:
| Metric | The Sherwin-Williams Company (SHW) | Ecolab Inc. (ECL) |
|---|---|---|
| Revenue | 23.6B | 15.7B |
| Cost of Revenue | 12.0B | 8.9B |
| Operating Expenses | 7.7B | 4.2B |
| Gross Profit | 11.5B | 6.8B |
| EBITDA | 4.4B | 3.8B |
| EBIT | 3.8B | 2.9B |
| Interest Expense | 469M | 338M |
| Net Income | 2.6B | 2.1B |
| EPS | 10.38 | 7.43 |
| Fiscal Year | 2025 | 2024 |
Income Statement Analysis: The Bottom-Line Duel
This income statement comparison reveals the true efficiency and profitability dynamics behind each company’s financial engine over recent years.
The Sherwin-Williams Company Analysis
Sherwin-Williams steadily grew revenue from $19.9B in 2021 to $23.6B in 2025, with net income advancing from $1.86B to $2.57B. The company maintains a robust gross margin near 49%, while net margin hovers around 11%, signaling solid cost control. Despite modest revenue growth of 2.06% in 2025, net income and margins showed slight declines, indicating emerging pressure on profitability.
Ecolab Inc. Analysis
Ecolab increased revenue from $11.8B in 2020 to $15.7B in 2024, with net income surging from a loss of $1.2B in 2020 to $2.11B in 2024. The firm posts a slightly lower gross margin at 43.5% but compensates with a higher net margin of 13.4%, reflecting efficient expense management. Recent year earnings exploded with 53.9% EPS growth and nearly 50% net margin expansion, demonstrating exceptional momentum and operational leverage.
Margin Resilience vs. Earnings Momentum
Sherwin-Williams exhibits steady margin resilience and consistent profitability growth over five years. In contrast, Ecolab delivers dramatic earnings and margin acceleration after a challenging 2020 baseline. Ecolab’s profile appeals more to investors seeking rapid improvement and momentum, while Sherwin-Williams suits those favoring stable, margin-driven returns.
Financial Ratios Comparison
These vital ratios act as a diagnostic tool to expose the underlying fiscal health, valuation premiums, and capital efficiency of the companies compared below:
| Ratios | The Sherwin-Williams Company (SHW) | Ecolab Inc. (ECL) |
|---|---|---|
| ROE | 55.86% | 24.12% |
| ROIC | 15.21% | 11.80% |
| P/E | 31.08 | 31.54 |
| P/B | 17.36 | 7.61 |
| Current Ratio | 0.87 | 1.26 |
| Quick Ratio | 0.53 | 0.95 |
| D/E | 2.81 | 0.95 |
| Debt-to-Assets | 49.97% | 37.00% |
| Interest Coverage | 8.11 | 7.72 |
| Asset Turnover | 0.91 | 0.70 |
| Fixed Asset Turnover | 3.84 | 3.52 |
| Payout Ratio | 30.31% | 31.45% |
| Dividend Yield | 0.98% | 1.00% |
| Fiscal Year | 2025 | 2024 |
Efficiency & Valuation Duel: The Vital Signs
Financial ratios act as a company’s DNA, exposing hidden risks and highlighting operational strengths critical to investment decisions.
The Sherwin-Williams Company
Sherwin-Williams posts a stellar 55.9% ROE and a solid 10.9% net margin, signaling robust profitability. However, its P/E of 31.1 and P/B of 17.4 suggest the stock trades at a premium. Shareholder returns rely on modest dividends (0.98% yield), indicating cautious capital allocation amid elevated leverage and liquidity concerns.
Ecolab Inc.
Ecolab delivers a balanced 24.1% ROE and a 13.4% net margin, reflecting efficient operations. Despite a comparable P/E of 31.5, its lower P/B of 7.6 implies less valuation stretch than Sherwin-Williams. The company maintains a 1.0% dividend yield and invests steadily in growth, supported by healthier liquidity and moderate debt levels.
Premium Valuation vs. Operational Balance
Sherwin-Williams offers exceptional profitability but at a stretched valuation and tighter liquidity. Ecolab presents a more moderate but stable profile with better balance sheet health. Investors prioritizing high returns may lean toward Sherwin-Williams, while those valuing financial prudence and steady growth might prefer Ecolab.
Which one offers the Superior Shareholder Reward?
I see Sherwin-Williams (SHW) offers a 0.98% dividend yield with a 30% payout ratio, balancing cash return and reinvestment. Ecolab (ECL) yields slightly higher at 1.0%, but with a 31% payout and stronger buybacks supporting total return. SHW’s aggressive leverage and thin liquidity raise risk. ECL’s conservative debt and robust free cash flow coverage drive a more sustainable distribution. While SHW’s share buybacks are modest, ECL executes buybacks consistently, enhancing shareholder value. I conclude Ecolab delivers the superior total shareholder reward in 2026, blending yield, buybacks, and financial prudence.
Comparative Score Analysis: The Strategic Profile
The radar chart reveals the fundamental DNA and trade-offs of The Sherwin-Williams Company and Ecolab Inc.:
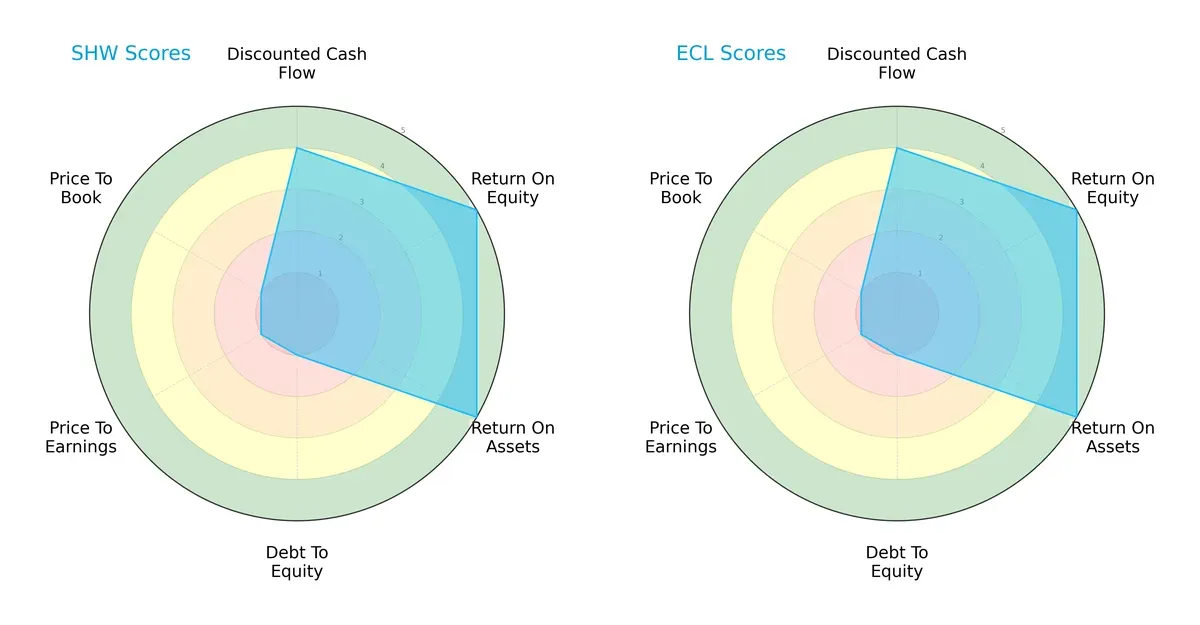
Both companies share identical profiles with strong ROE and ROA scores (5), indicating efficient profit generation and asset use. Their DCF scores (4) suggest favorable valuations based on cash flow. However, both carry very unfavorable debt-to-equity and valuation scores (1), exposing financial leverage risks and potential overpricing. Neither firm shows a more balanced profile; each relies heavily on operational efficiency while facing similar valuation challenges.
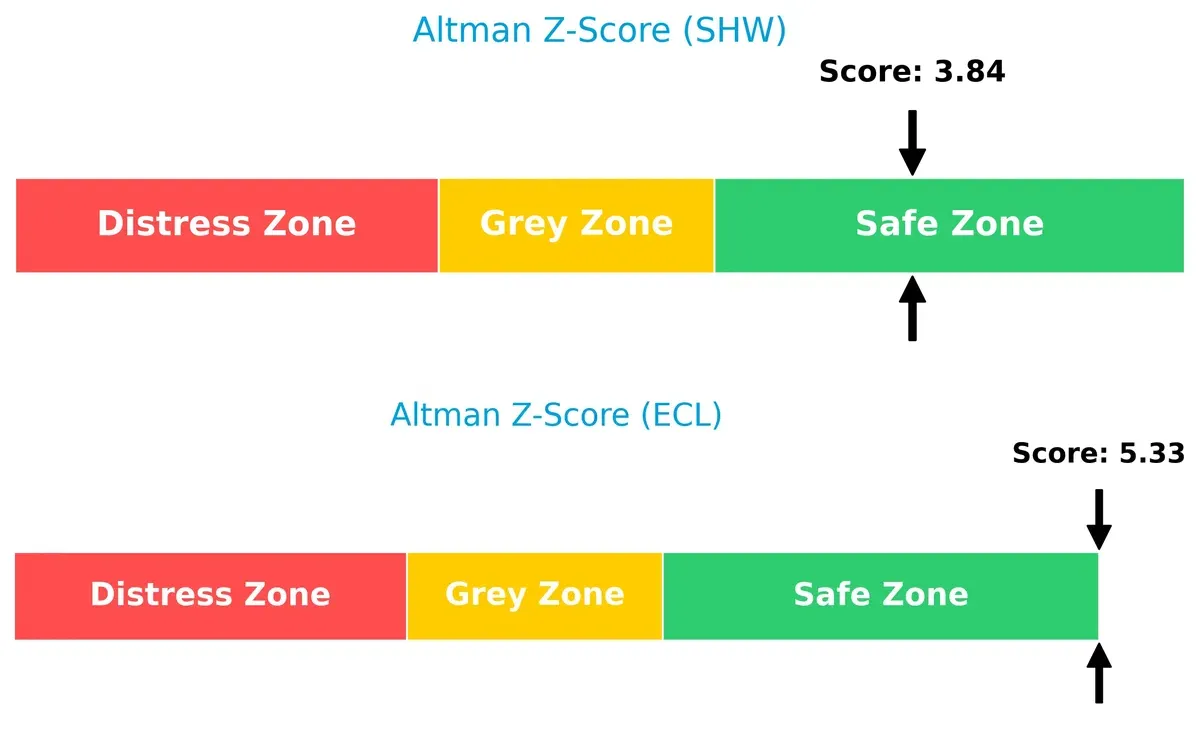
Bankruptcy Risk: Solvency Showdown
Ecolab’s Altman Z-Score (5.33) surpasses Sherwin-Williams’ (3.84), signaling stronger solvency and lower bankruptcy risk in this cycle:
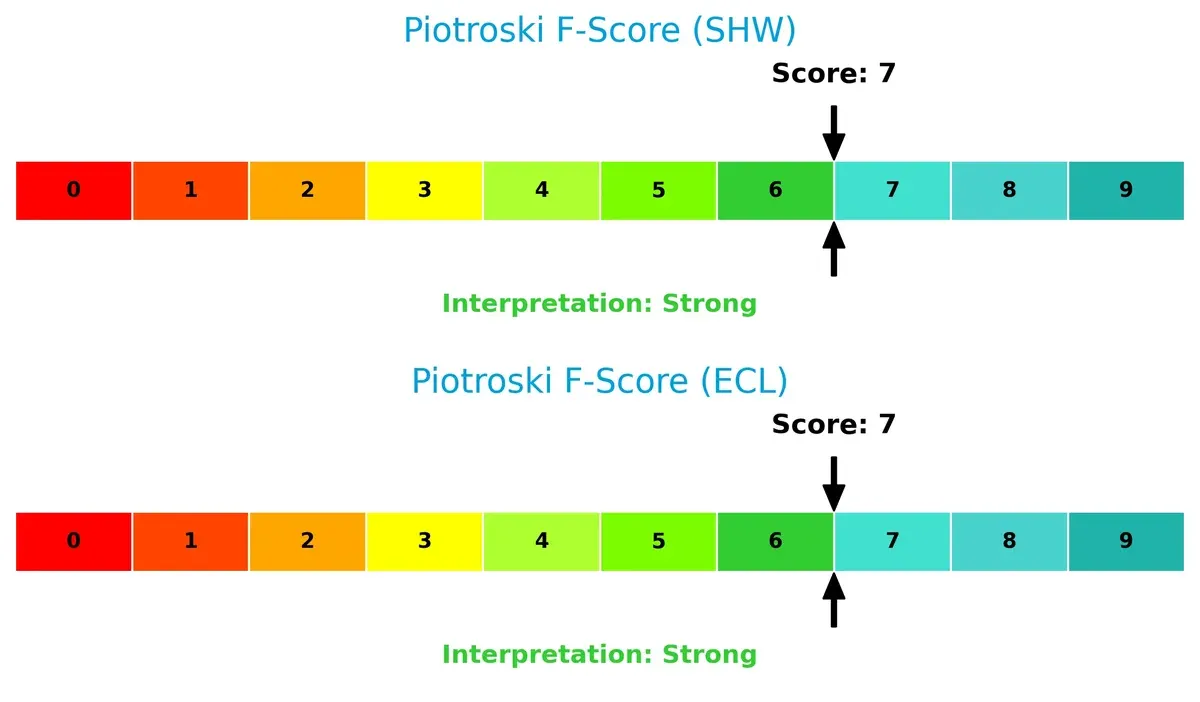
Financial Health: Quality of Operations
Both firms report a Piotroski F-Score of 7, indicating strong financial health without red flags in internal metrics:
How are the two companies positioned?
This section dissects the operational DNA of Sherwin-Williams and Ecolab by comparing their revenue distribution and internal dynamics. The goal is to confront their economic moats and identify which business model offers the most resilient, sustainable competitive advantage today.
Revenue Segmentation: The Strategic Mix
This comparison dissects how The Sherwin-Williams Company and Ecolab Inc. diversify their income streams and where their primary sector bets lie:
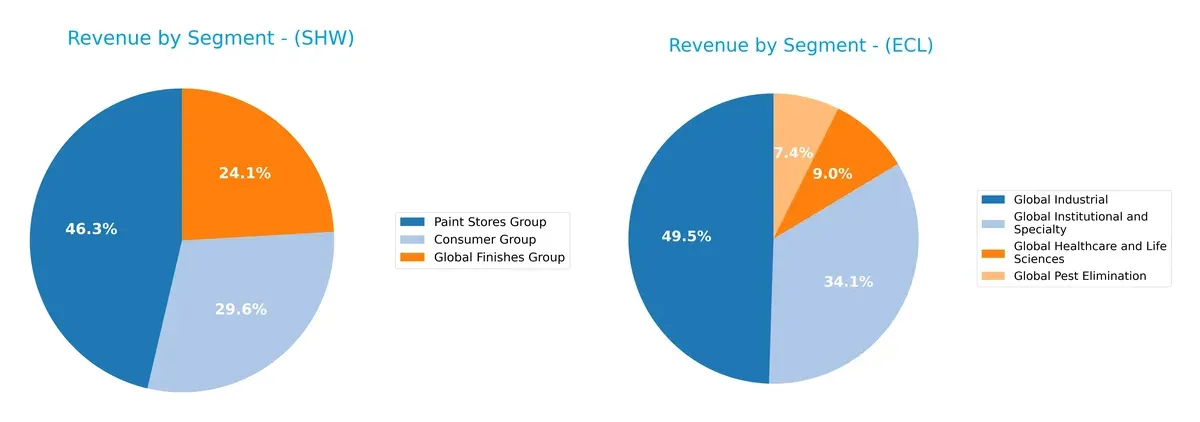
Sherwin-Williams anchors revenue in Paint Stores Group at $13.2B, dwarfing Consumer Group ($8.4B) and Global Finishes Group ($6.9B). This concentration highlights strong retail ecosystem lock-in but poses concentration risk. Ecolab displays a more balanced mix: Global Industrial leads at $7.9B, followed by Global Institutional and Specialty at $5.4B, with Global Healthcare and Life Sciences adding $1.4B. Ecolab’s diversification supports resilience across multiple industrial sectors.
Strengths and Weaknesses Comparison
This table compares the Strengths and Weaknesses of The Sherwin-Williams Company (SHW) and Ecolab Inc. (ECL):
SHW Strengths
- High ROE at 55.86% indicating strong profitability
- ROIC of 15.21% above WACC shows efficient capital use
- Favorable net margin of 10.9%
- Strong fixed asset turnover at 3.84
- Diverse revenue streams including Consumer and Paint Stores groups
- Solid interest coverage at 8.12
ECL Strengths
- Favorable net margin at 13.42%
- ROE of 24.12% shows good shareholder returns
- ROIC of 11.8% exceeds WACC of 7.96%
- Broad global presence with revenues from Asia Pacific, Europe, and Americas
- Diverse segments including Industrial, Healthcare, and Pest Elimination
- Interest coverage of 8.6 supports debt service
SHW Weaknesses
- Low current ratio of 0.87 signals liquidity risk
- High debt-to-equity of 2.81 raises financial leverage concerns
- Unfavorable P/E of 31.08 and P/B of 17.36 suggest valuation risk
- Dividend yield below 1% may deter income investors
- Net unfavorable ratio percentage at 42.86%
- Asset turnover moderate at 0.91
ECL Weaknesses
- P/E ratio at 31.54 and P/B at 7.61 are relatively high
- Dividend yield at 1.0% is low for income focus
- Neutral current and quick ratios around 1.26 and 0.95 imply tight liquidity
- Debt-to-equity at 0.95 indicates moderate leverage
- Asset turnover at 0.7 is modest
SHW shows exceptional profitability and capital efficiency but faces liquidity and leverage risks. ECL presents a balanced financial profile with strong profitability and global diversification, though valuation and liquidity metrics warrant attention. These factors shape their strategic focus on capital management and market positioning.
The Moat Duel: Analyzing Competitive Defensibility
A structural moat is the only reliable barrier protecting long-term profits from relentless competition and market pressure. Let’s dissect these two chemical giants:
The Sherwin-Williams Company: Durable Brand and Distribution Network Moat
Sherwin-Williams leverages strong brand loyalty and an extensive retail footprint. Its 6.3% ROIC premium over WACC confirms value creation. In 2026, innovation in coatings and expansion in industrial segments could deepen this moat.
Ecolab Inc.: Service-Driven Solutions and Scale Moat
Ecolab’s moat arises from high switching costs and integrated water and hygiene services. It posts a 3.8% ROIC excess over WACC, showing efficient capital use. Growing global markets and digital water management solutions offer expansion opportunities.
Moat Strength Showdown: Brand Loyalty vs. Service Integration
Sherwin-Williams commands a wider moat via its iconic brand and direct retail control, while Ecolab’s moat is narrower but reinforced by service complexity. Sherwin-Williams appears better equipped to defend market share amid evolving industry dynamics.
Which stock offers better returns?
The past year showed distinct bullish trends for both stocks, with Ecolab significantly outperforming The Sherwin-Williams Company in price appreciation and buyer dominance.
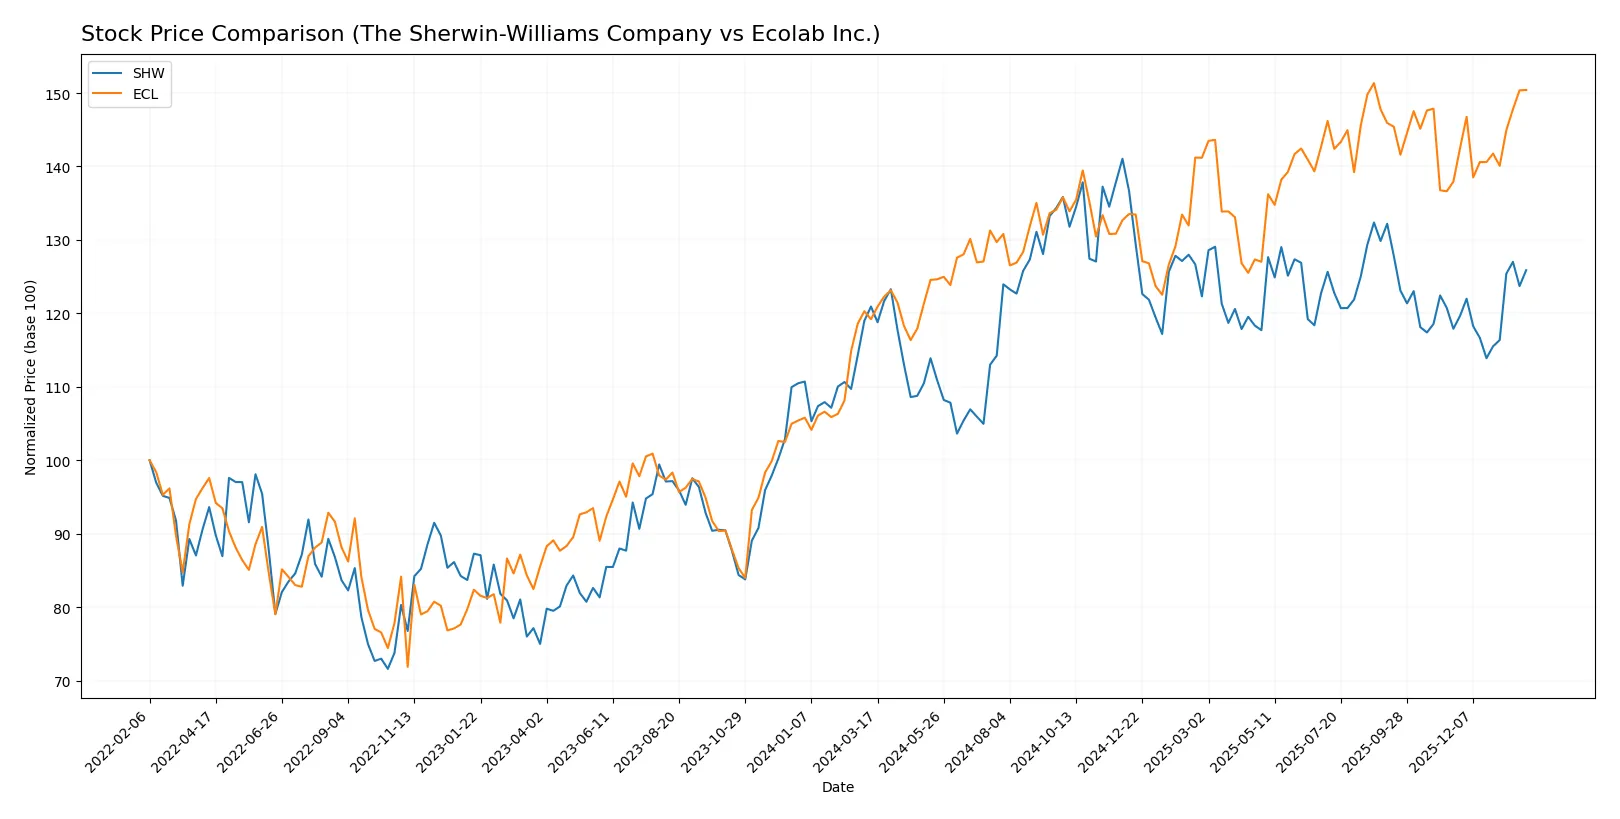
Trend Comparison
The Sherwin-Williams Company’s stock rose 4.09% over the past 12 months, reflecting a bullish trend with accelerating momentum and high volatility (std dev 22.46), peaking at 397.4.
Ecolab’s stock surged 26.19% in the same period, exhibiting a stronger bullish trend with acceleration, moderate volatility (std dev 16.28), and a high of 283.73.
Ecolab outperformed Sherwin-Williams, delivering the highest market returns and showing stronger buyer dominance and sustained acceleration.
Target Prices
Analysts show confident upside potential for Sherwin-Williams and Ecolab based on current consensus targets.
| Company | Target Low | Target High | Consensus |
|---|---|---|---|
| The Sherwin-Williams Company | 371 | 420 | 393.5 |
| Ecolab Inc. | 295 | 315 | 303.43 |
Sherwin-Williams trades at $354.64, below the $393.5 consensus, implying a bullish outlook. Ecolab’s $281.99 price also lags the $303.43 consensus, signaling potential gains ahead.

Don’t Let Luck Decide Your Entry Point
Optimize your entry points with our advanced ProRealTime indicators. You’ll get efficient buy signals with precise price targets for maximum performance. Start outperforming now!
How do institutions grade them?
The Sherwin-Williams Company Grades
Here are the latest institutional grades for Sherwin-Williams from top firms.
| Grading Company | Action | New Grade | Date |
|---|---|---|---|
| RBC Capital | Maintain | Outperform | 2026-01-30 |
| UBS | Maintain | Buy | 2026-01-12 |
| Mizuho | Maintain | Outperform | 2025-12-18 |
| Citigroup | Upgrade | Buy | 2025-12-18 |
| Citigroup | Maintain | Neutral | 2025-10-30 |
| RBC Capital | Maintain | Outperform | 2025-10-29 |
| Wells Fargo | Maintain | Overweight | 2025-10-29 |
| JP Morgan | Maintain | Overweight | 2025-10-29 |
| UBS | Maintain | Buy | 2025-10-29 |
| B of A Securities | Maintain | Neutral | 2025-10-14 |
Ecolab Inc. Grades
These are Ecolab’s most recent grades from reliable investment firms.
| Grading Company | Action | New Grade | Date |
|---|---|---|---|
| Citigroup | Maintain | Buy | 2026-01-21 |
| Wells Fargo | Maintain | Equal Weight | 2026-01-14 |
| UBS | Maintain | Neutral | 2026-01-07 |
| Citigroup | Maintain | Buy | 2025-12-18 |
| Evercore ISI Group | Upgrade | Outperform | 2025-11-03 |
| UBS | Maintain | Neutral | 2025-10-31 |
| Barclays | Maintain | Overweight | 2025-10-29 |
| Stifel | Maintain | Buy | 2025-10-29 |
| Citigroup | Maintain | Buy | 2025-10-29 |
| JP Morgan | Maintain | Neutral | 2025-10-29 |
Which company has the best grades?
Sherwin-Williams consistently earns Outperform and Buy ratings, showing stronger institutional confidence. Ecolab’s ratings are mixed, often Neutral or Equal Weight. Investors may perceive Sherwin-Williams as having a more favorable outlook.
Risks specific to each company
The following categories identify critical pressure points and systemic threats facing Sherwin-Williams and Ecolab in the 2026 market environment:
1. Market & Competition
The Sherwin-Williams Company
- Faces intense competition in specialty chemicals with pressure on margins despite strong brand presence.
Ecolab Inc.
- Operates in diverse segments with moderate competition but benefits from essential services in hygiene and water treatment.
2. Capital Structure & Debt
The Sherwin-Williams Company
- High debt-to-equity ratio of 2.81 signals elevated financial risk and leverage concerns.
Ecolab Inc.
- Moderate debt-to-equity ratio near 0.95 reflects balanced leverage and prudent capital structure.
3. Stock Volatility
The Sherwin-Williams Company
- Beta at 1.26 indicates above-market volatility, increasing risk in turbulent markets.
Ecolab Inc.
- Beta near 1.0 suggests market-level volatility, offering more stable price movements.
4. Regulatory & Legal
The Sherwin-Williams Company
- Subject to environmental regulations affecting chemical manufacturing and coatings products.
Ecolab Inc.
- Faces stringent regulations in hygiene, infection prevention, and chemical handling globally.
5. Supply Chain & Operations
The Sherwin-Williams Company
- Complex global supply chains vulnerable to raw material price swings and logistics disruptions.
Ecolab Inc.
- Supply chain complexity in diverse industries exposes it to operational risks but with strong management.
6. ESG & Climate Transition
The Sherwin-Williams Company
- Must address carbon footprint in coatings manufacturing amid rising regulatory and consumer demands.
Ecolab Inc.
- Positioned well with water and hygiene solutions, aligning with sustainable and climate-friendly trends.
7. Geopolitical Exposure
The Sherwin-Williams Company
- Exposure to North and South American markets with moderate risk from trade tensions.
Ecolab Inc.
- Global footprint, including emerging markets, increases exposure to geopolitical instability.
Which company shows a better risk-adjusted profile?
Ecolab’s moderate leverage and near-market volatility underpin a stronger risk-adjusted profile than Sherwin-Williams, whose high debt and stock volatility raise red flags. Sherwin-Williams’ most impactful risk is its heavy financial leverage. For Ecolab, geopolitical exposure and regulatory complexity present the biggest challenges. Ecolab’s recent Altman Z-score of 5.33 versus Sherwin-Williams’ 3.84 confirms superior financial stability.
Final Verdict: Which stock to choose?
The Sherwin-Williams Company’s superpower lies in its exceptional capital efficiency and robust profitability, creating consistent value above its cost of capital. Its point of vigilance is a stretched liquidity position, which could challenge short-term flexibility. It suits investors seeking aggressive growth fueled by operational excellence.
Ecolab Inc. commands a strategic moat through its durable competitive advantage and steady cash flow profile. Its stronger liquidity and lower leverage offer a safer harbor compared to Sherwin-Williams. Ecolab fits well in portfolios focused on GARP, balancing steady growth with financial stability.
If you prioritize high return on invested capital and aggressive expansion, Sherwin-Williams outshines with superior profitability and growth momentum. However, if you seek better stability and risk management, Ecolab offers a more resilient balance sheet and consistent earnings growth. Each presents a compelling scenario aligned with distinct investor profiles.
Disclaimer: Investment carries a risk of loss of initial capital. The past performance is not a reliable indicator of future results. Be sure to understand risks before making an investment decision.
Go Further
I encourage you to read the complete analyses of The Sherwin-Williams Company and Ecolab Inc. to enhance your investment decisions: