Home > Comparison > Basic Materials > ECL vs PPG
The strategic rivalry between Ecolab Inc. and PPG Industries, Inc. shapes the competitive landscape of the specialty chemicals sector. Ecolab operates as a global provider of water, hygiene, and infection prevention solutions, emphasizing service-driven industrial and healthcare segments. In contrast, PPG focuses on manufacturing and distributing paints, coatings, and specialty materials with a broad industrial and commercial footprint. This analysis will evaluate which company’s strategic model offers superior risk-adjusted returns for a diversified portfolio.
Table of contents
Companies Overview
Ecolab Inc. and PPG Industries, Inc. dominate the specialty chemicals sector with distinct market approaches and expansive product portfolios.
Ecolab Inc.: Leader in Water, Hygiene, and Infection Prevention
Ecolab Inc. excels in delivering water treatment and sanitation solutions globally. Its revenue stems from industrial, institutional, and healthcare segments providing cleaning, sanitizing, and pest elimination services. In 2026, the company sharpens its strategic focus on infection prevention and real-time data management to enhance operational efficiency and sustainability.
PPG Industries, Inc.: Specialist in Coatings and Specialty Materials
PPG Industries, Inc. specializes in paints, coatings, and specialty materials serving automotive, industrial, and consumer markets worldwide. Revenue derives from performance and industrial coatings, adhesives, and advanced materials. The company’s 2026 strategy centers on expanding protective coatings and innovative materials for aerospace and infrastructure applications.
Strategic Collision: Similarities & Divergences
Both firms thrive in specialty chemicals but diverge in business philosophy: Ecolab emphasizes integrated hygiene and water solutions, while PPG focuses on protective coatings and materials innovation. Their primary battleground lies in industrial and commercial applications. Ecolab offers a service-heavy model with recurring revenues; PPG leans on product innovation and diversified end-markets—each presents distinct investment dynamics.
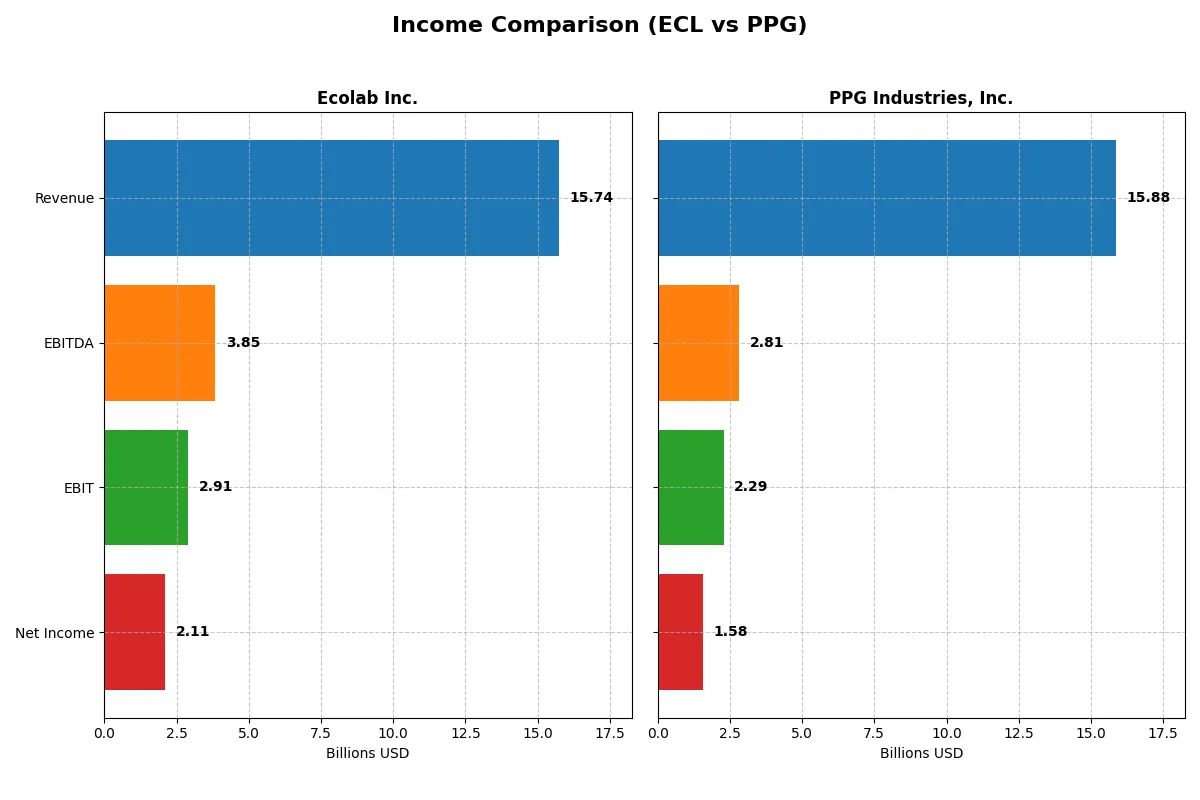
Income Statement Comparison
This data dissects the core profitability and scalability of both corporate engines to reveal who dominates the bottom line:
| Metric | Ecolab Inc. (ECL) | PPG Industries, Inc. (PPG) |
|---|---|---|
| Revenue | 15.7B | 15.9B |
| Cost of Revenue | 8.9B | 9.3B |
| Operating Expenses | 4.2B | 4.3B |
| Gross Profit | 6.8B | 6.6B |
| EBITDA | 3.8B | 2.6B |
| EBIT | 2.9B | 2.1B |
| Interest Expense | 338M | 241M |
| Net Income | 2.1B | 1.1B |
| EPS | 7.43 | 4.77 |
| Fiscal Year | 2024 | 2024 |
Income Statement Analysis: The Bottom-Line Duel
This income statement comparison reveals which company runs a more efficient and profitable business engine through recent financial performance.
Ecolab Inc. Analysis
Ecolab’s revenue grew steadily from 11.8B in 2020 to 15.7B in 2024, while net income surged from a loss of -1.2B in 2020 to 2.1B in 2024. Its gross margin improved to 43.5%, and net margin climbed to 13.4%, reflecting enhanced operational leverage. The 2024 year showed strong momentum with a 37.9% EBIT growth and a 53.9% EPS increase, underscoring growing efficiency and profitability.
PPG Industries, Inc. Analysis
PPG’s revenue hovered around 15.6B-16.8B from 2021 to 2025, ending at 15.9B in 2025 with net income rising modestly to 1.58B. Gross margin settled at 38.0%, and net margin reached 9.9%, signaling solid but lower profitability than Ecolab. Despite a slight revenue decline over the period, PPG posted a 9.2% EBIT growth and a 45.7% EPS jump in 2025, showing operational resilience amid revenue stagnation.
Margin Strength vs. Revenue Growth
Ecolab outpaces PPG in profitability expansion and margin improvement, with a sharper net income and EPS trajectory. PPG delivers steadier revenue but with slimmer margins and slower net income growth. For investors prioritizing margin power and accelerating earnings, Ecolab presents a more compelling fundamental profile. PPG suits those focused on stable top-line scale with moderate profit growth.
Financial Ratios Comparison
These vital ratios act as a diagnostic tool to expose the underlying fiscal health, valuation premiums, and capital efficiency of the companies compared below:
| Ratios | Ecolab Inc. (ECL) | PPG Industries, Inc. (PPG) |
|---|---|---|
| ROE | 24.12% | -44.48% |
| ROIC | 11.80% | 43.13% |
| P/E | 31.54 | 14.71 |
| P/B | 7.61 | -6.54 |
| Current Ratio | 1.26 | 1.62 |
| Quick Ratio | 0.95 | 1.22 |
| D/E | 0.95 | -2.10 |
| Debt-to-Assets | 37.00% | 93.55% |
| Interest Coverage | 7.72 | 9.00 |
| Asset Turnover | 0.70 | 1.99 |
| Fixed Asset Turnover | 3.52 | 0.00 |
| Payout ratio | 31.45% | 39.85% |
| Dividend yield | 1.00% | 2.71% |
| Fiscal Year | 2024 | 2025 |
Efficiency & Valuation Duel: The Vital Signs
Financial ratios act as the company’s DNA, uncovering hidden operational strengths and risks that shape investment decisions.
Ecolab Inc.
Ecolab exhibits strong profitability with a 24.12% ROE and a healthy 13.42% net margin, signaling operational efficiency. However, its valuation appears stretched, with a high P/E of 31.54 and P/B of 7.61. Shareholders receive a modest 1.0% dividend yield, reflecting limited cash returns amid reinvestment in growth and R&D.
PPG Industries, Inc.
PPG shows mixed signals, with a robust 43.13% ROIC but an unfavorable negative ROE of -44.48%, hinting at recent equity challenges. The stock trades at a reasonable P/E of 14.71 and favorable P/B. It delivers a higher 2.71% dividend yield, indicating a stronger focus on shareholder returns despite a concerning 93.55% debt-to-assets ratio.
Valuation Stretch vs. Operational Resilience
Ecolab’s superior profitability contrasts with its stretched valuation, while PPG offers better valuation metrics but carries financial leverage risks. Risk-tolerant investors may prefer Ecolab’s growth profile, whereas income-focused investors might lean toward PPG’s dividend and balance sheet stability.
Which one offers the Superior Shareholder Reward?
I see Ecolab and PPG both pay dividends but differ in yield and payout ratio. Ecolab yields ~1.0% with a 31% payout, reflecting strong free cash flow coverage (65%). PPG offers a higher 2.7% yield but with a similar 40% payout. Ecolab’s buybacks support shareholder value sustainably, unlike PPG’s negative free cash flow per share in 2025, signaling risks to buyback and dividend sustainability. PPG trades at a lower P/E and EV multiple, appealing for value, yet its heavy debt and lower free cash flow caution me. Overall, Ecolab’s balanced dividend, robust free cash flow, and prudent buybacks make it the superior total return choice in 2026.
Comparative Score Analysis: The Strategic Profile
The radar chart reveals the fundamental DNA and trade-offs of both firms, highlighting their operational strengths and valuation challenges:
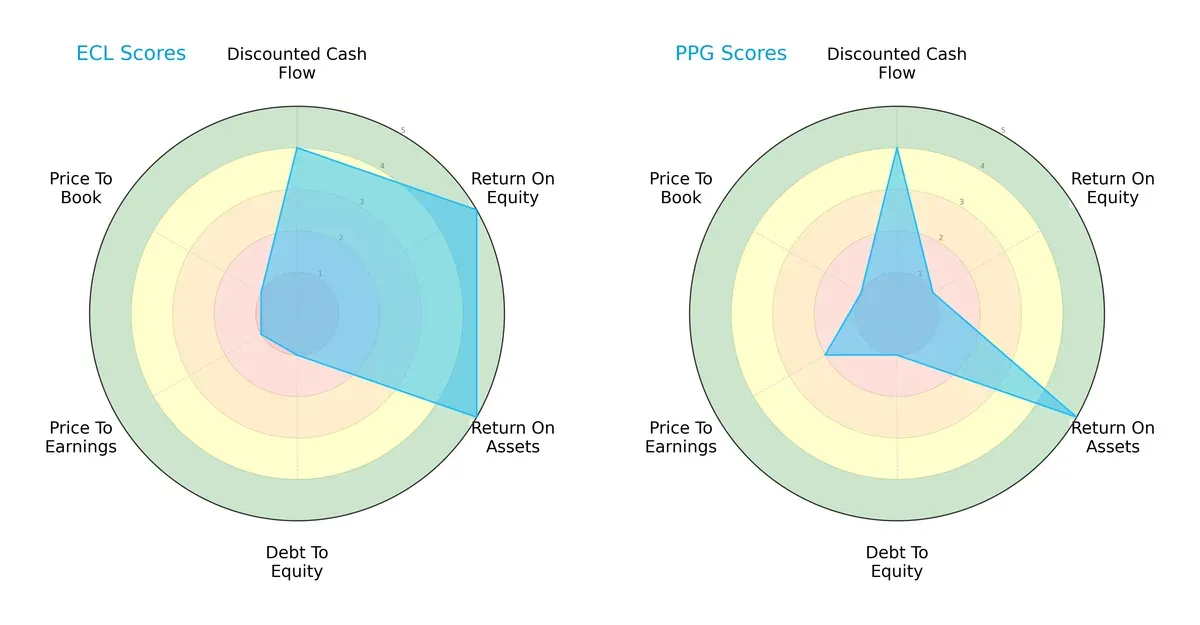
Ecolab excels in profitability with top ROE and ROA scores, showing operational efficiency. PPG matches Ecolab’s asset utilization but lags sharply in ROE. Both share weak debt management and valuation metrics, indicating balance sheet leverage and market pricing concerns. Ecolab presents a more balanced profile, while PPG relies heavily on asset efficiency.
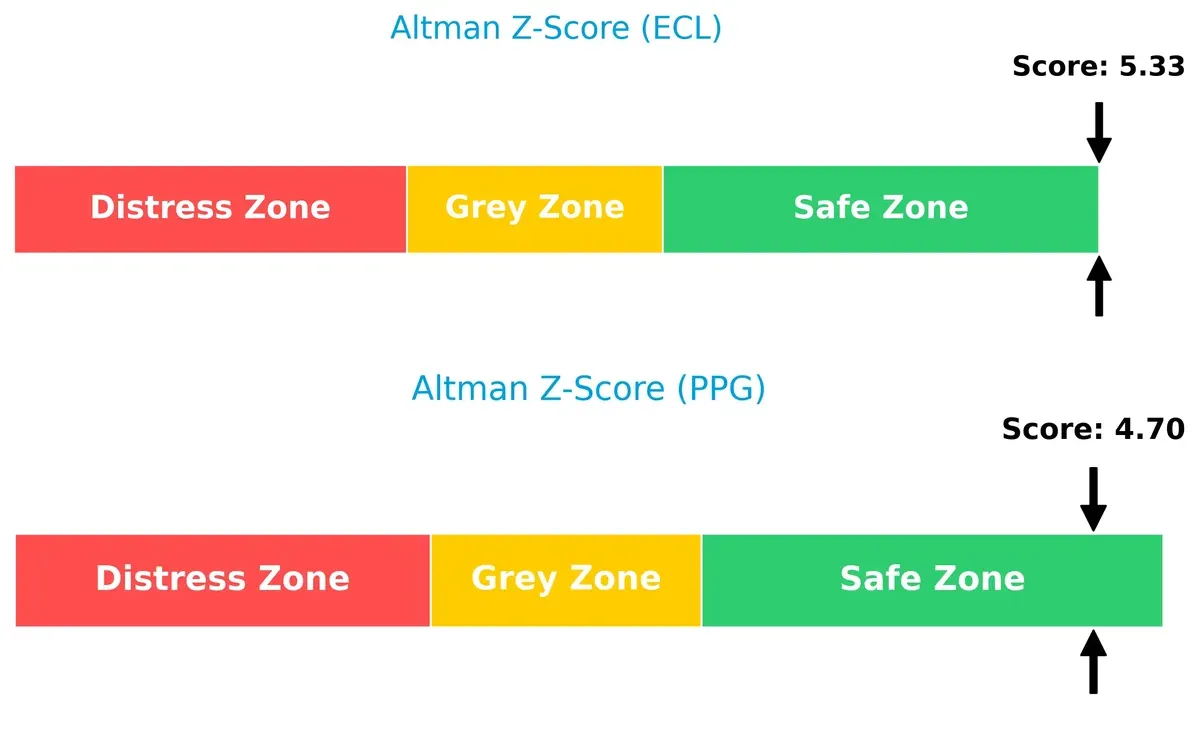
Bankruptcy Risk: Solvency Showdown
Ecolab’s Altman Z-Score of 5.33 edges out PPG’s 4.70, both firmly in the safe zone, signaling robust long-term solvency in this cycle:
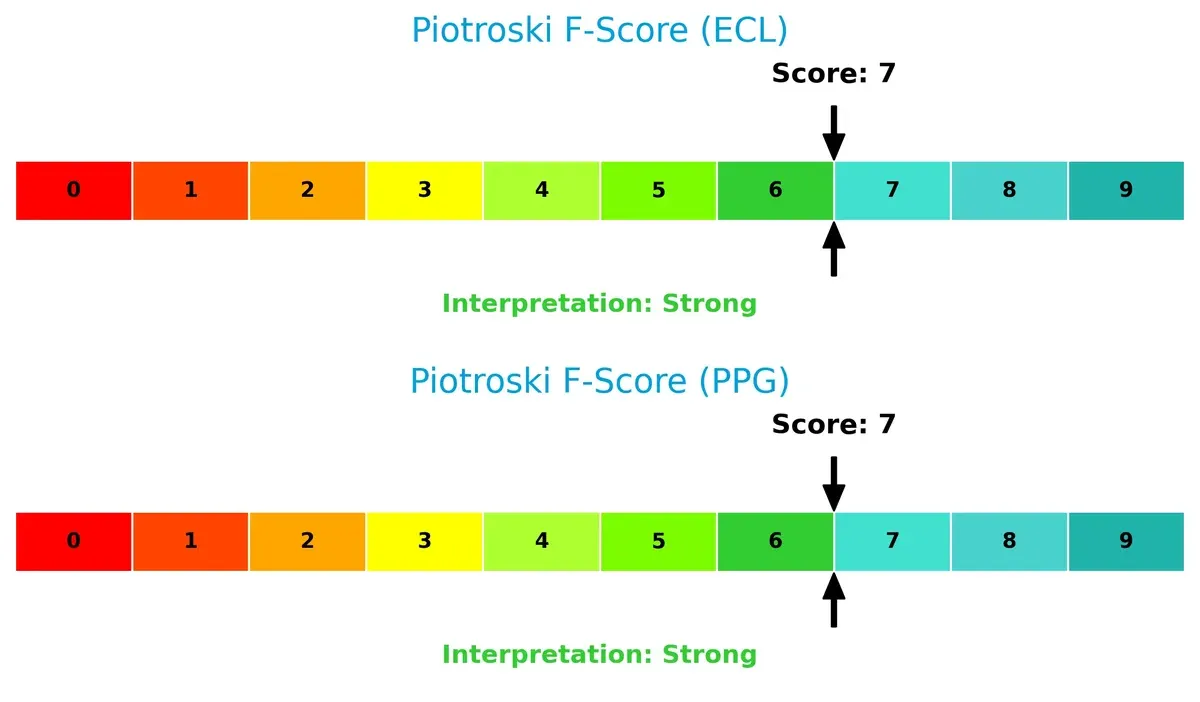
Financial Health: Quality of Operations
Both firms score 7 on the Piotroski F-Score, indicating strong financial health with no major red flags in internal metrics:
How are the two companies positioned?
This section dissects Ecolab and PPG’s operational DNA by comparing their revenue distribution and internal strengths and weaknesses. The goal is to confront their economic moats and identify which model delivers the most resilient competitive advantage today.
Revenue Segmentation: The Strategic Mix
This comparison dissects how Ecolab Inc. and PPG Industries, Inc. diversify their income streams and where their primary sector bets lie:
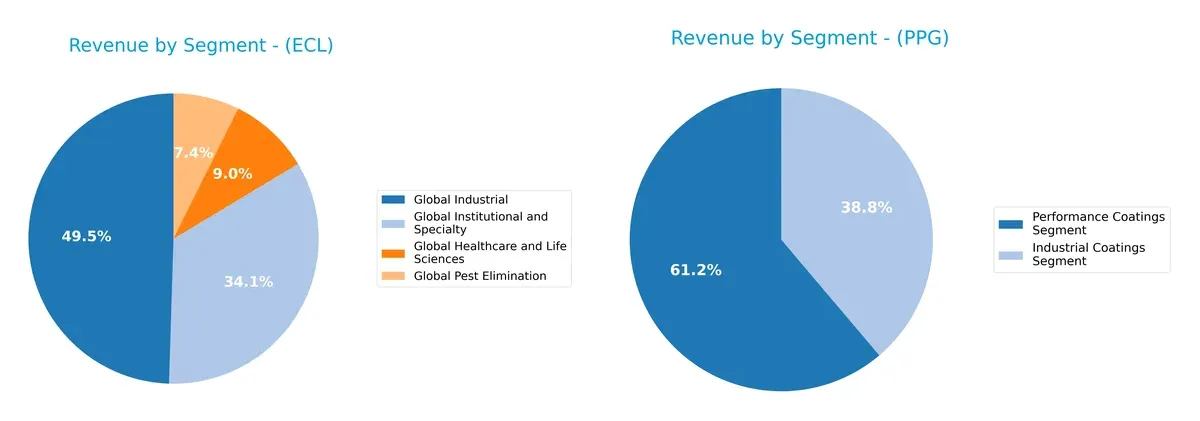
Ecolab leans on a diversified base with four key segments: Global Industrial ($7.9B), Institutional and Specialty ($5.4B), Healthcare and Life Sciences ($1.4B), and Pest Elimination ($1.2B). In contrast, PPG relies heavily on Performance Coatings ($11.2B) and Industrial Coatings ($7.1B), showing less diversification. Ecolab’s broad mix reduces concentration risk, while PPG’s focus suggests strong market dominance but higher exposure to coatings sector cycles.
Strengths and Weaknesses Comparison
This table compares the Strengths and Weaknesses of Ecolab Inc. and PPG Industries, Inc.:
Ecolab Inc. Strengths
- Diversified revenues across global industrial, healthcare, pest elimination, and institutional segments
- Favorable profitability metrics with 13.42% net margin and 24.12% ROE
- Positive capital efficiency with 11.8% ROIC above 7.96% WACC
- Strong global presence including US, Europe, Asia Pacific, and Latin America
- Robust fixed asset turnover at 3.52 indicates efficient asset use
PPG Industries, Inc. Strengths
- Favorable ROIC of 43.13% well above WACC of 7.85% signals strong capital returns
- High current and quick ratios show solid short-term liquidity
- Favorable P/E and P/B ratios indicate attractive valuation
- Broad geographic reach in Asia Pacific, EMEA, Latin America, and North America
- High asset turnover of 1.99 suggests efficient revenue generation from assets
- Dividend yield at 2.71% provides income potential
Ecolab Inc. Weaknesses
- High P/E of 31.54 and P/B of 7.61 imply expensive valuation relative to fundamentals
- Dividend yield low at 1.0%, less attractive for income investors
- Neutral current and quick ratios signal moderate liquidity risk
- Moderate debt to assets of 37% requires monitoring
PPG Industries, Inc. Weaknesses
- Negative ROE at -44.48% raises concerns over profitability and equity returns
- Debt to assets very high at 93.55%, indicating potential leverage risk
- Fixed asset turnover at zero signals inefficient asset utilization
- Negative debt/equity ratio needs further scrutiny for financial health
Overall, Ecolab’s strengths lie in steady profitability, diversified business lines, and efficient asset use, though valuation is stretched. PPG shows strong capital returns and liquidity but faces challenges with profitability and high leverage. Each company’s strategic focus must reflect these financial realities and risk factors.
The Moat Duel: Analyzing Competitive Defensibility
A structural moat is the only barrier protecting long-term profits from relentless competitive erosion. Let’s dissect the moats of two specialty chemical giants:
Ecolab Inc.: Intangible Assets & Service Integration
Ecolab’s moat centers on high switching costs and deep service integration. Its 43% gross margin and growing ROIC confirm pricing power and operational efficiency. Expansion in healthcare and industrial hygiene could further deepen its moat in 2026.
PPG Industries, Inc.: Cost Advantage & Scale Economies
PPG leverages cost advantages and global scale, reflected in robust margin stability and a soaring ROIC trend. Its diversified coatings portfolio supports resilience, while innovations in sustainable materials offer growth avenues amid rising competition.
Intangible Assets vs. Cost Leadership: The Specialty Chemicals Moat Clash
Both firms show very favorable moats with growing returns on invested capital. However, PPG’s explosive ROIC expansion signals a wider moat. I see PPG better equipped to defend market share through scale and innovation, while Ecolab’s service integration offers strong but narrower protection.
Which stock offers better returns?
Over the past year, Ecolab Inc. surged 26.2%, showing accelerating gains and hitting a high of 283.7. PPG Industries, Inc. fell 17.8%, despite recent recovery signs.
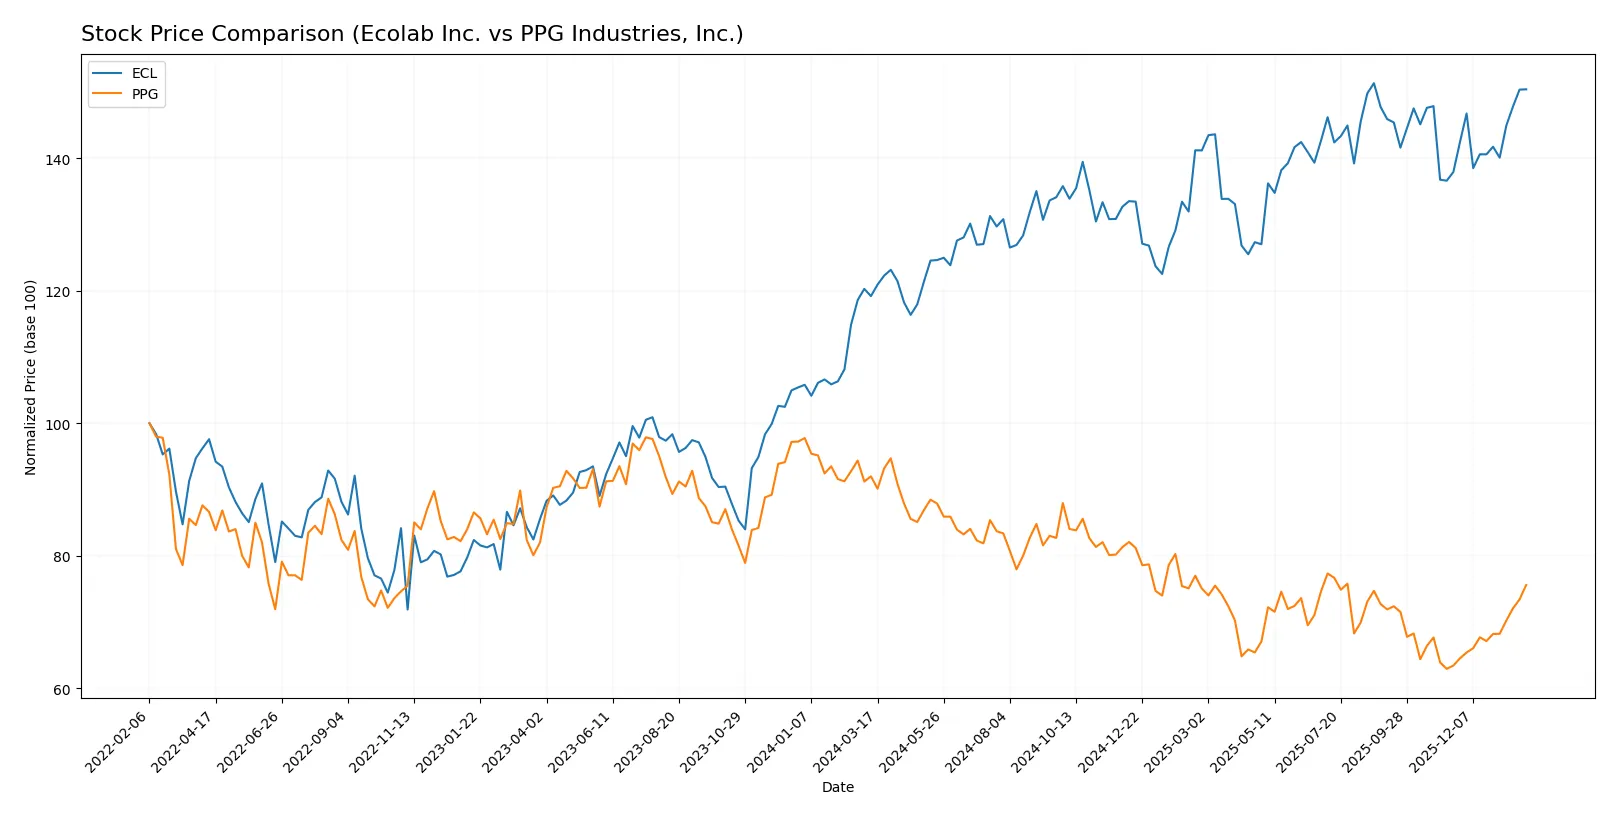
Trend Comparison
Ecolab Inc. recorded a 26.2% price increase over the past year, confirming a bullish trend with accelerating momentum and notable volatility (16.3% std deviation). The stock hit a low of 218.2 and peaked at 283.7.
PPG Industries, Inc. declined 17.8% over the same period, marking a bearish trend with accelerating downward pressure and lower volatility (11.8% std deviation). The price ranged from 96.3 to 144.9.
Ecolab outperformed PPG by a wide margin, delivering the highest market return and showing sustained bullish momentum versus PPG’s overall bearish trend.
Target Prices
Analysts present a cautiously optimistic target consensus for these specialty chemical companies.
| Company | Target Low | Target High | Consensus |
|---|---|---|---|
| Ecolab Inc. | 295 | 315 | 303.43 |
| PPG Industries, Inc. | 115 | 135 | 126 |
Ecolab’s consensus target stands about 7.5% above its current 282 price, signaling moderate upside. PPG’s target consensus exceeds its current 116 price by nearly 9%, reflecting analyst confidence despite recent volatility.

Don’t Let Luck Decide Your Entry Point
Optimize your entry points with our advanced ProRealTime indicators. You’ll get efficient buy signals with precise price targets for maximum performance. Start outperforming now!
How do institutions grade them?
Ecolab Inc. Grades
The table below summarizes recent institutional grades for Ecolab Inc.:
| Grading Company | Action | New Grade | Date |
|---|---|---|---|
| Citigroup | Maintain | Buy | 2026-01-21 |
| Wells Fargo | Maintain | Equal Weight | 2026-01-14 |
| UBS | Maintain | Neutral | 2026-01-07 |
| Citigroup | Maintain | Buy | 2025-12-18 |
| Evercore ISI Group | Upgrade | Outperform | 2025-11-03 |
| UBS | Maintain | Neutral | 2025-10-31 |
| Barclays | Maintain | Overweight | 2025-10-29 |
| Stifel | Maintain | Buy | 2025-10-29 |
| Citigroup | Maintain | Buy | 2025-10-29 |
| JP Morgan | Maintain | Neutral | 2025-10-29 |
PPG Industries, Inc. Grades
The table below summarizes recent institutional grades for PPG Industries, Inc.:
| Grading Company | Action | New Grade | Date |
|---|---|---|---|
| JP Morgan | Maintain | Overweight | 2026-01-29 |
| Goldman Sachs | Maintain | Buy | 2026-01-29 |
| Wells Fargo | Maintain | Overweight | 2026-01-29 |
| Citigroup | Maintain | Buy | 2026-01-29 |
| RBC Capital | Maintain | Sector Perform | 2026-01-29 |
| UBS | Maintain | Neutral | 2026-01-29 |
| Jefferies | Maintain | Hold | 2026-01-29 |
| Mizuho | Maintain | Outperform | 2026-01-28 |
| Citigroup | Maintain | Buy | 2025-12-18 |
| JP Morgan | Maintain | Overweight | 2025-11-21 |
Which company has the best grades?
Both companies have strong institutional support with consistent buy and outperform ratings. Ecolab’s grades skew slightly more conservative with several neutral ratings, while PPG holds more overweight and buy ratings. Investors may interpret PPG’s grades as indicating a marginally stronger market confidence.
Risks specific to each company
The following categories identify critical pressure points and systemic threats facing both firms in the 2026 market environment:
1. Market & Competition
Ecolab Inc.
- Strong global industrial and healthcare presence but faces pricing pressure and specialty chemical innovation risks.
PPG Industries, Inc.
- Diverse coatings portfolio with strong industrial client base, yet vulnerable to cyclicality and competitive pricing in automotive and construction sectors.
2. Capital Structure & Debt
Ecolab Inc.
- Moderate leverage with debt-to-assets at 37%, manageable interest coverage of 8.6x, signaling controlled financial risk.
PPG Industries, Inc.
- Extremely high debt-to-assets ratio of 93.55% raises red flags, despite strong interest coverage, indicating heavy reliance on leverage.
3. Stock Volatility
Ecolab Inc.
- Beta near 1.0 reflects market-level volatility, suggesting stock moves broadly with the S&P 500.
PPG Industries, Inc.
- Beta at 1.164 signals higher volatility than the market, increasing potential risk for shareholders.
4. Regulatory & Legal
Ecolab Inc.
- Exposure to evolving environmental and health regulations in water and hygiene services, requiring ongoing compliance investments.
PPG Industries, Inc.
- Faces stringent regulations on chemical emissions and coatings, with potential legal challenges in environmental compliance.
5. Supply Chain & Operations
Ecolab Inc.
- Global operations depend on raw material availability and logistics, with possible disruptions impacting service delivery.
PPG Industries, Inc.
- Complex supply chain for raw materials and specialty chemicals, susceptible to cost inflation and delivery delays.
6. ESG & Climate Transition
Ecolab Inc.
- Positioned well in water and energy management solutions, aligning with climate transition, though execution risk remains.
PPG Industries, Inc.
- Active in sustainable coatings development but faces pressure to accelerate transition and reduce carbon footprint.
7. Geopolitical Exposure
Ecolab Inc.
- Moderate international footprint exposes it to trade tensions and regional instability affecting supply and demand.
PPG Industries, Inc.
- Global operations increase vulnerability to geopolitical risks, including tariffs and sanctions impacting raw materials.
Which company shows a better risk-adjusted profile?
Ecolab’s moderate leverage and diversified end markets reduce systemic risk compared to PPG’s heavy debt burden and higher stock volatility. PPG’s capital structure is a clear risk factor despite favorable operational metrics. Ecolab’s stable financial ratios and safe-zone Altman Z-score suggest stronger resilience. The most impactful risk for Ecolab lies in regulatory compliance costs, while PPG’s debt levels threaten financial stability. Recent data confirm Ecolab’s prudent balance sheet management versus PPG’s elevated leverage, tipping the risk-adjusted edge to Ecolab.
Final Verdict: Which stock to choose?
Ecolab Inc. (ECL) shines as a powerhouse of operational efficiency and durable value creation. Its superpower lies in a consistently growing ROIC well above its WACC, signaling strong capital allocation and competitive advantage. A point of vigilance is its high valuation multiples, which could temper near-term upside. ECL suits portfolios seeking aggressive growth with a long-term horizon.
PPG Industries, Inc. (PPG) offers a robust strategic moat anchored in its impressive ROIC and asset utilization. Its recurring revenue streams and favorable debt metrics provide a relatively safer profile compared to Ecolab. Despite some concerns on equity returns, PPG fits well in GARP portfolios aiming for steady growth without overpaying for quality.
If you prioritize durable competitive moats and operational excellence, Ecolab outshines with its superior capital efficiency and growth momentum. However, if you seek better stability and a more balanced risk-return profile, PPG offers a compelling scenario with its solid fundamentals and reasonable valuation. Both present viable opportunities, but investor preference hinges on growth appetite versus stability focus.
Disclaimer: Investment carries a risk of loss of initial capital. The past performance is not a reliable indicator of future results. Be sure to understand risks before making an investment decision.
Go Further
I encourage you to read the complete analyses of Ecolab Inc. and PPG Industries, Inc. to enhance your investment decisions: