Home > Comparison > Basic Materials > ECL vs LYB
The strategic rivalry between Ecolab Inc. and LyondellBasell Industries defines the current trajectory of the specialty chemicals sector. Ecolab operates as a diversified service provider focused on water, hygiene, and infection prevention solutions, while LyondellBasell is a capital-intensive chemical manufacturer specializing in olefins, polyolefins, and refining. This analysis contrasts their operational models to identify which offers superior risk-adjusted returns for a diversified portfolio in 2026.
Table of contents
Companies Overview
Ecolab Inc. and LyondellBasell Industries dominate the specialty chemicals sector with distinct operational scopes.
Ecolab Inc.: Water and Hygiene Solutions Leader
Ecolab Inc. commands a global position in water, hygiene, and infection prevention services. Its revenue stems from industrial water treatment, cleaning products, and pest elimination across diverse industries. In 2026, the company sharpens its strategic focus on integrated contamination control and data-driven resource management to enhance customer operational efficiency.
LyondellBasell Industries N.V.: Polyolefins and Refining Powerhouse
LyondellBasell operates as a top-tier chemical producer specializing in olefins, polyolefins, and refining crude oil into fuels. It generates revenues through advanced polymers, catalysts, and chemical intermediates marketed worldwide. The firm prioritizes innovation in chemical process technologies and global supply chain resilience to maintain competitive edge.
Strategic Collision: Similarities & Divergences
Both companies lead in specialty chemicals but diverge sharply in focus: Ecolab pursues service-driven solutions while LyondellBasell emphasizes product innovation. Their primary battleground lies in serving industrial customers requiring chemical expertise, yet their business philosophies contrast—Ecolab’s integrated service model versus LyondellBasell’s manufacturing scale. This shapes distinct investment profiles: stable service growth versus cyclical chemical production exposure.
Income Statement Comparison
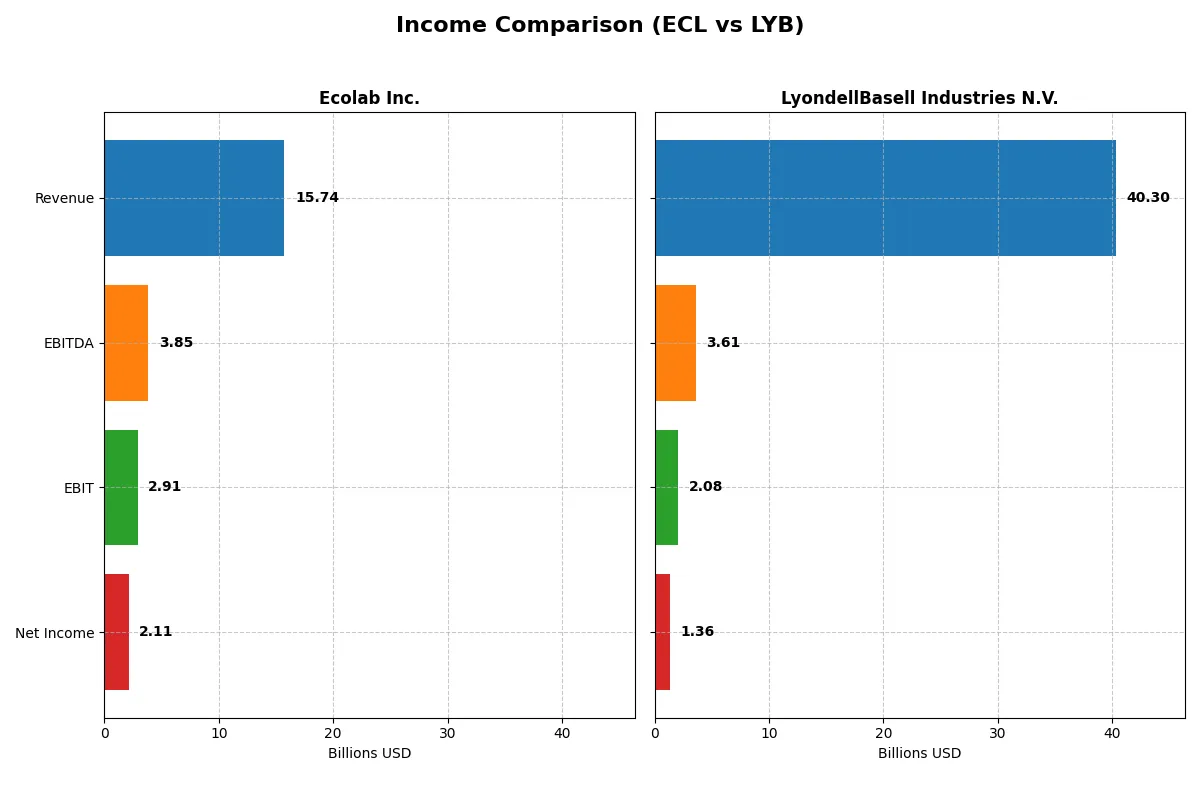
The data below dissects the core profitability and scalability of both corporate engines to reveal who dominates the bottom line:
| Metric | Ecolab Inc. (ECL) | LyondellBasell Industries N.V. (LYB) |
|---|---|---|
| Revenue | 15.7B | 40.3B |
| Cost of Revenue | 8.9B | 35.7B |
| Operating Expenses | 4.2B | 2.7B |
| Gross Profit | 6.8B | 4.6B |
| EBITDA | 3.8B | 3.6B |
| EBIT | 2.9B | 2.1B |
| Interest Expense | 338M | 481M |
| Net Income | 2.1B | 1.4B |
| EPS | 7.43 | 4.16 |
| Fiscal Year | 2024 | 2024 |
Income Statement Analysis: The Bottom-Line Duel
This income statement comparison reveals which company runs a more efficient and profitable business engine in the current market.
Ecolab Inc. Analysis
Ecolab’s revenue rose steadily to 15.7B in 2024, with net income surging to 2.1B, reflecting strong margin expansion. Gross margin improved to 43.5%, and net margin climbed to 13.4%, signaling robust profitability and operational efficiency. The 2024 results highlight accelerating momentum, with a notable 38% EBIT growth year-over-year.
LyondellBasell Industries N.V. Analysis
LyondellBasell’s revenue slipped slightly to 40.3B in 2024, with net income dropping to 1.36B, pressured by margin compression. Gross margin contracted to 11.3%, and net margin fell to 3.4%, indicating weaker profitability. The latest year shows declining efficiency, with EBIT down 33%, reflecting challenging cost dynamics and margin pressure.
Margin Leadership vs. Scale Challenges
Ecolab clearly outperforms on profitability and margin expansion, delivering strong net income growth and improving operational leverage. In contrast, LyondellBasell’s scale is larger, but margin erosion and profit declines dampen its fundamental appeal. For investors, Ecolab’s profile offers a more compelling earnings quality and growth trajectory.
Financial Ratios Comparison
These vital ratios act as a diagnostic tool to expose the underlying fiscal health, valuation premiums, and capital efficiency of the companies compared here:
| Ratios | Ecolab Inc. (ECL) | LyondellBasell Industries N.V. (LYB) |
|---|---|---|
| ROE | 24.12% | 10.91% |
| ROIC | 11.80% | 5.15% |
| P/E | 31.54 | 17.75 |
| P/B | 7.61 | 1.94 |
| Current Ratio | 1.26 | 1.83 |
| Quick Ratio | 0.95 | 1.13 |
| D/E | 0.95 | 1.04 |
| Debt-to-Assets | 37.00% | 36.15% |
| Interest Coverage | 7.72 | 3.78 |
| Asset Turnover | 0.70 | 1.13 |
| Fixed Asset Turnover | 3.52 | 2.44 |
| Payout ratio | 31.45% | 126.47% |
| Dividend yield | 1.00% | 7.13% |
| Fiscal Year | 2024 | 2024 |
Efficiency & Valuation Duel: The Vital Signs
Financial ratios act as the company’s DNA, unveiling underlying risks and operational strengths that raw numbers often conceal.
Ecolab Inc.
Ecolab demonstrates strong profitability with a 24.12% ROE and a 13.42% net margin, indicating efficient capital use. Its valuation appears stretched, with a P/E of 31.54 and a P/B of 7.61, above typical sector averages. The company returns value through a modest 1.0% dividend, favoring reinvestment in growth and R&D.
LyondellBasell Industries N.V.
LyondellBasell’s 2025 ratios show zero profitability metrics, reflecting operational challenges or data gaps. Valuation measures are favorable due to low multiples, but liquidity and asset efficiency ratios are weak or unavailable. The company pays no dividend, suggesting limited shareholder returns and possible reinvestment or restructuring focus.
Operational Strength vs. Valuation Stretch
Ecolab balances solid profitability with a premium valuation, reflecting market confidence but increased risk. LyondellBasell’s metrics reveal operational weakness and lack of clear returns, increasing uncertainty. Investors seeking stability may prefer Ecolab’s profile, while those tolerant of risk might consider LyondellBasell’s turnaround potential.
Which one offers the Superior Shareholder Reward?
I compare Ecolab Inc. (ECL) and LyondellBasell Industries N.V. (LYB) on dividends, payout ratios, and buybacks for 2026. ECL offers a modest dividend yield near 1%, with a sustainable payout ratio around 31%, supported by strong free cash flow coverage (1.7x). LYB delivers a much higher dividend yield exceeding 7%, but with an unsustainably high payout ratio above 126%, risking future cuts. LYB’s free cash flow coverage under 1x signals strain. Buybacks are notably active at ECL, balancing capital allocation between shareholders and growth. LYB’s distribution model leans heavily on dividends, possibly at the expense of reinvestment. I judge ECL’s disciplined payout and buyback strategy more sustainable and attractive for total shareholder returns in 2026.
Comparative Score Analysis: The Strategic Profile
The radar chart reveals the fundamental DNA and trade-offs of Ecolab Inc. and LyondellBasell Industries N.V., illustrating their distinct financial strengths:
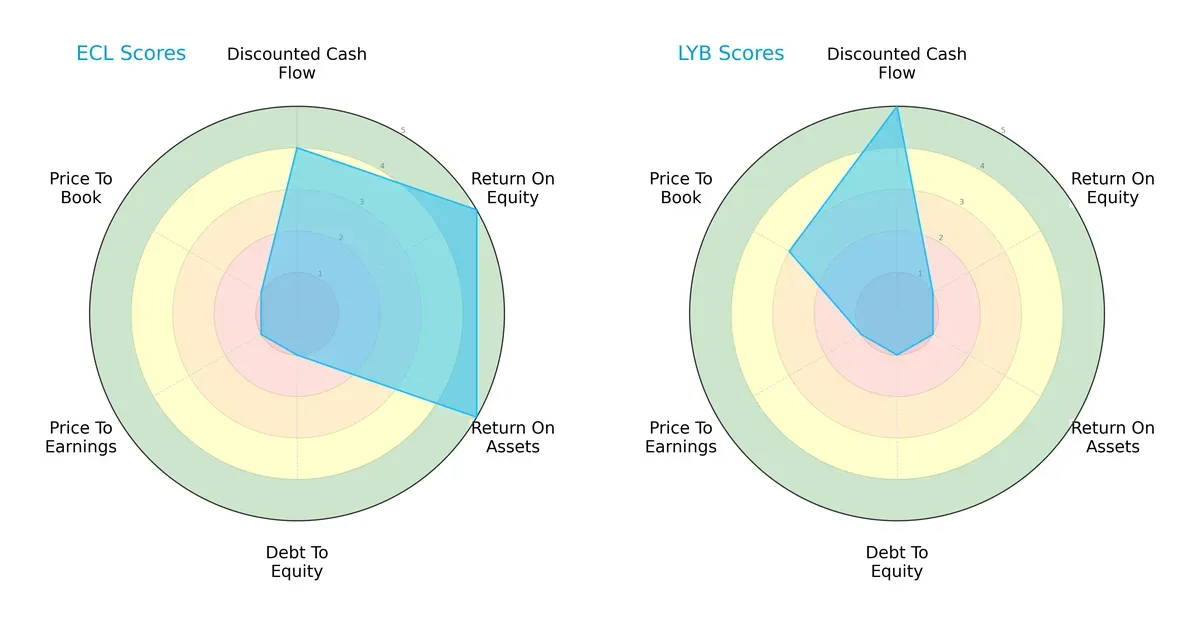
Ecolab shows a balanced profile with very favorable ROE and ROA scores (5 each), highlighting strong profitability and asset efficiency. However, its debt-to-equity and valuation metrics (PE and PB) score very low (1), signaling financial risk and potential overvaluation. LyondellBasell excels in discounted cash flow (5 vs. 4) and has a moderate price-to-book score (3), but suffers in profitability with very unfavorable ROE and ROA scores (1 each). Ecolab relies on operational efficiency, while LyondellBasell depends heavily on cash flow valuation advantages.
—
Bankruptcy Risk: Solvency Showdown
Ecolab’s Altman Z-Score of 5.33 places it firmly in the safe zone, suggesting strong solvency and low bankruptcy risk in this cycle. LyondellBasell’s score is unavailable, limiting direct comparison:

—
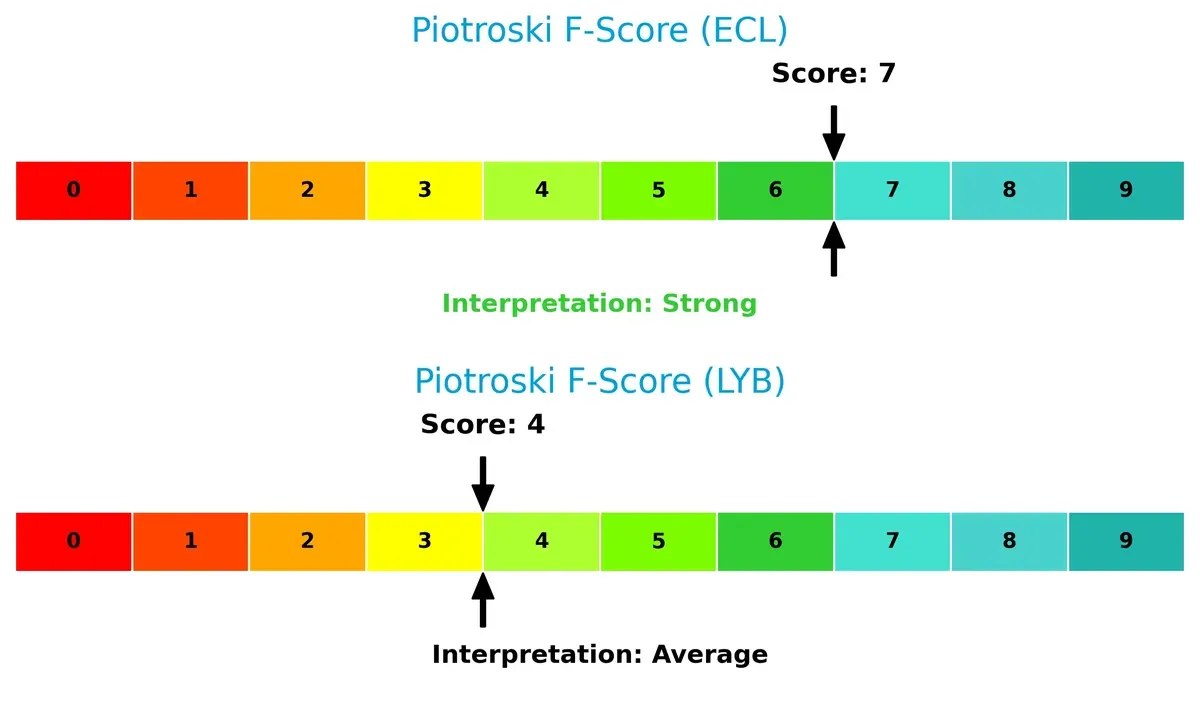
Financial Health: Quality of Operations
Ecolab’s Piotroski F-Score of 7 indicates strong financial health and solid operational fundamentals. LyondellBasell’s score of 4 is average, suggesting potential red flags in internal metrics compared to Ecolab:
How are the two companies positioned?
This section dissects the operational DNA of Ecolab and LyondellBasell by comparing their revenue distribution by segment and internal dynamics. The goal is to confront their economic moats and identify which model offers the most resilient, sustainable competitive advantage today.
Revenue Segmentation: The Strategic Mix
This visual comparison dissects how Ecolab Inc. and LyondellBasell Industries diversify their income streams and reveals their primary sector bets:
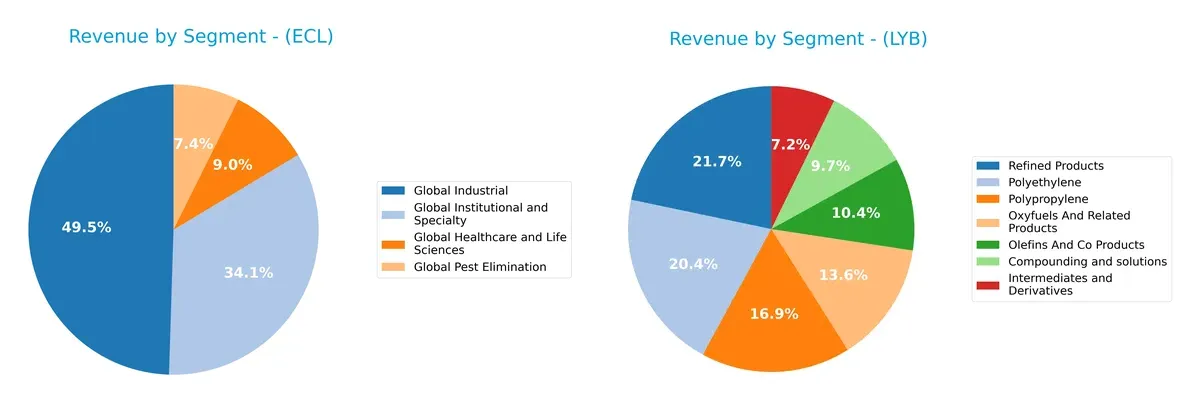
Ecolab anchors revenue in Global Industrial at $7.9B, complemented by Global Institutional and Specialty at $5.4B, showing a balanced but slightly concentrated portfolio. LyondellBasell dwarfs with a broader petrochemical mix, led by Refined Products at $8.1B and Polyethylene at $7.6B, highlighting strong infrastructure dominance. Ecolab’s diversification mitigates concentration risk, while LyondellBasell pivots heavily on commodity chemicals, exposing it to cyclicality.
Strengths and Weaknesses Comparison
This table compares the Strengths and Weaknesses of Ecolab Inc. and LyondellBasell Industries N.V.:
Ecolab Inc. Strengths
- Favorable profitability ratios with 13.4% net margin and 24.1% ROE
- Positive ROIC above WACC indicating value creation
- Diverse global revenue streams across multiple sectors
- Strong presence in the US and Europe
- Favorable interest coverage ratio of 8.6
LyondellBasell Industries N.V. Strengths
- Favorable debt metrics with low leverage and debt-to-assets ratio
- Large scale in refined products and polyethylene segments
- Extensive US market presence with $19.5B revenue
- Strong geographic diversification including China and Europe
- Favorable valuation metrics (PE and PB ratios)
Ecolab Inc. Weaknesses
- Unfavorable valuation multiples with high PE of 31.5 and PB of 7.6
- Low dividend yield of 1.0%
- Neutral liquidity ratios near 1.26 current ratio
- Moderate asset turnover at 0.7
LyondellBasell Industries N.V. Weaknesses
- Unfavorable profitability metrics with zero net margin, ROE, and ROIC
- Unavailable WACC data limits cost of capital assessment
- Poor liquidity with zero reported current and quick ratios
- Unfavorable asset turnover and fixed asset turnover ratios
- No dividend yield reported, indicating limited shareholder returns
Ecolab excels in profitability and global diversification but faces valuation and yield concerns. LyondellBasell struggles with profitability and liquidity despite strong scale and favorable leverage. These contrasts highlight differing strategic and financial challenges each company must manage.
The Moat Duel: Analyzing Competitive Defensibility
A structural moat is the sole shield protecting long-term profits from relentless competition erosion. Let’s dissect the competitive moats of these two chemicals giants:
Ecolab Inc.: Intangible Assets and Service Excellence
Ecolab’s moat stems from deep customer relationships and specialized infection prevention solutions. This manifests in a strong 18.5% EBIT margin and a steadily growing ROIC. Expansion into healthcare and sustainability markets in 2026 should fortify its moat further.
LyondellBasell Industries N.V.: Cost Advantage in Commodity Chemicals
LyondellBasell relies on scale and cost efficiency in polyolefins production, contrasting Ecolab’s service moat. However, declining EBIT margins near 5% and a worsening ROIC trend signal vulnerability. Market volatility and feedstock price shifts threaten its competitive edge in 2026.
Service Innovation vs. Cost Leadership: Who Defends Better?
Ecolab holds a wider and deeper moat, evidenced by durable ROIC growth and margin stability. LyondellBasell’s weakening financials expose cracks in its cost moat. I believe Ecolab is better equipped to defend its market share amid intensifying competition.
Which stock offers better returns?
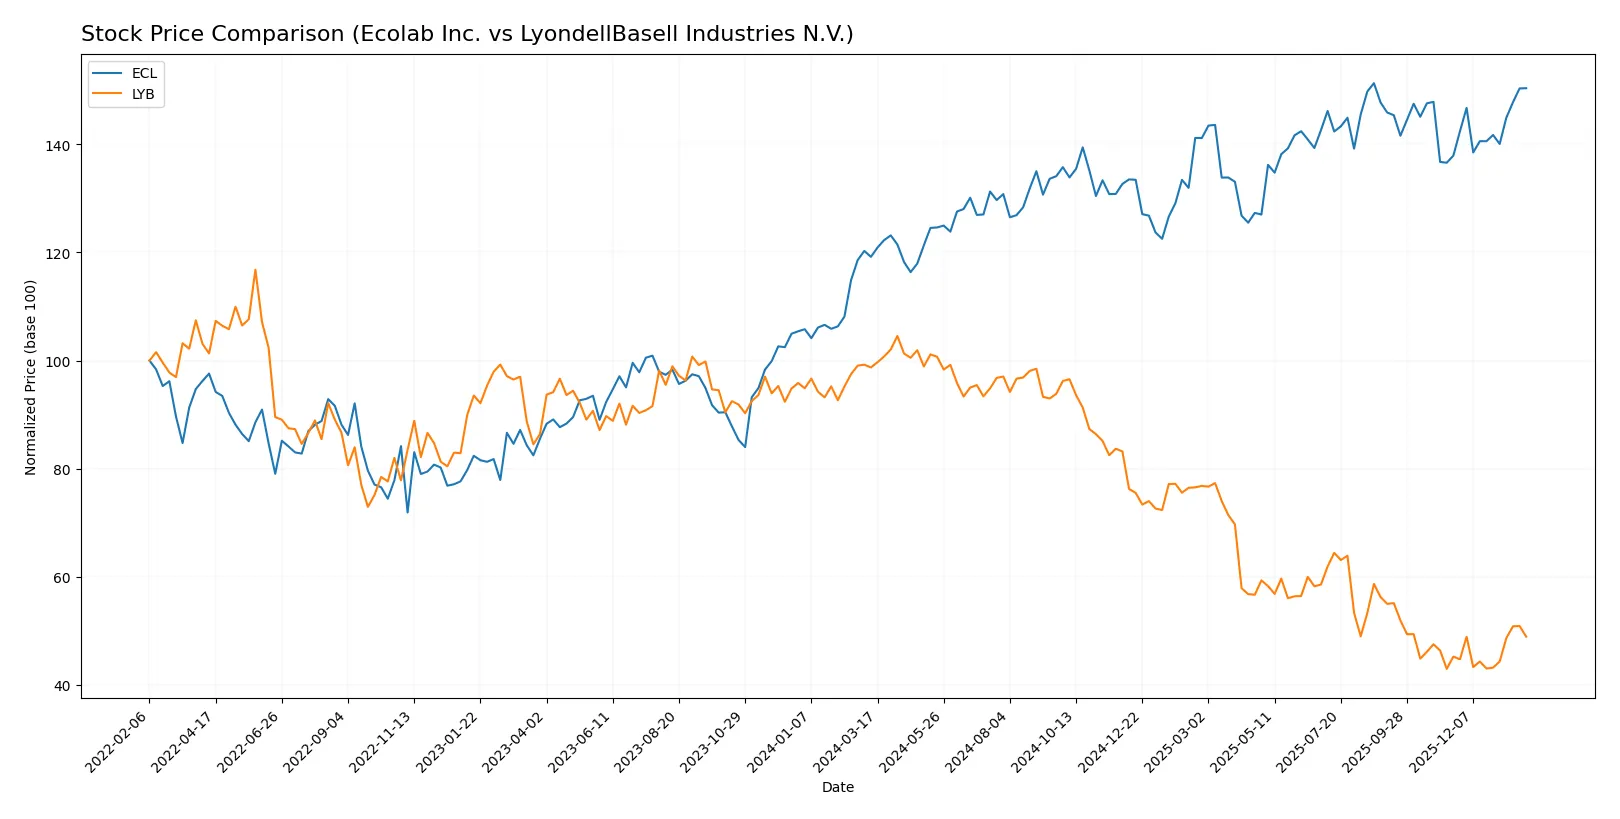
The past year shows sharply divergent price movements for Ecolab Inc. and LyondellBasell Industries N.V., with Ecolab gaining strongly while LyondellBasell faces steep declines despite recent modest recoveries.
Trend Comparison
Ecolab Inc. posts a 26.19% price increase over 12 months, confirming a bullish trend with accelerating momentum and notable volatility (16.28% std deviation). The stock peaked at 283.73 and held a low of 218.16.
LyondellBasell Industries N.V. suffers a 50.48% decline over the same period, signaling a bearish trend with acceleration. Volatility is higher at 20.23%, with a low near 43.02 and a recent modest gain of 8.17%.
Ecolab’s bullish trend contrasts sharply with LyondellBasell’s sustained bearish direction, making Ecolab the stronger market performer over the past year.
Target Prices
Analysts present a clear consensus on target prices for Ecolab Inc. and LyondellBasell Industries N.V.
| Company | Target Low | Target High | Consensus |
|---|---|---|---|
| Ecolab Inc. | 295 | 315 | 303.43 |
| LyondellBasell Industries N.V. | 36 | 51 | 45.75 |
The target consensus for Ecolab Inc. suggests upside potential from its current price of $282. LyondellBasell’s consensus indicates modest upside from its $49 trading level.

Don’t Let Luck Decide Your Entry Point
Optimize your entry points with our advanced ProRealTime indicators. You’ll get efficient buy signals with precise price targets for maximum performance. Start outperforming now!
How do institutions grade them?
Here are the most recent institutional grades for Ecolab Inc. and LyondellBasell Industries N.V.:
Ecolab Inc. Grades
The following table summarizes recent grades from major financial institutions for Ecolab Inc.:
| Grading Company | Action | New Grade | Date |
|---|---|---|---|
| Citigroup | Maintain | Buy | 2026-01-21 |
| Wells Fargo | Maintain | Equal Weight | 2026-01-14 |
| UBS | Maintain | Neutral | 2026-01-07 |
| Evercore ISI Group | Upgrade | Outperform | 2025-11-03 |
| Barclays | Maintain | Overweight | 2025-10-29 |
| Stifel | Maintain | Buy | 2025-10-29 |
| JP Morgan | Maintain | Neutral | 2025-10-29 |
LyondellBasell Industries N.V. Grades
The following table summarizes recent grades from major financial institutions for LyondellBasell Industries N.V.:
| Grading Company | Action | New Grade | Date |
|---|---|---|---|
| RBC Capital | Maintain | Sector Perform | 2026-01-16 |
| Citigroup | Maintain | Neutral | 2026-01-15 |
| UBS | Maintain | Sell | 2025-12-23 |
| Wells Fargo | Downgrade | Equal Weight | 2025-12-19 |
| BMO Capital | Downgrade | Underperform | 2025-12-15 |
| Mizuho | Maintain | Neutral | 2025-12-11 |
| Evercore ISI Group | Maintain | In Line | 2025-11-11 |
Which company has the best grades?
Ecolab Inc. consistently receives buy and outperform ratings, signaling stronger institutional confidence. LyondellBasell shows mixed to negative grades, reflecting caution. This divergence may influence investor sentiment and portfolio positioning.
Risks specific to each company
The following categories identify the critical pressure points and systemic threats facing both firms in the 2026 market environment:
1. Market & Competition
Ecolab Inc.
- Operates in specialty chemicals with diversified industrial and healthcare segments; faces competition from niche and global players.
LyondellBasell Industries N.V.
- Competes in commodity chemicals and refining with cyclicality; exposed to intense price competition and global capacity shifts.
2. Capital Structure & Debt
Ecolab Inc.
- Moderate leverage (D/E ~0.95); interest coverage strong at 8.6x, signaling manageable debt risk.
LyondellBasell Industries N.V.
- Debt metrics unavailable but interest coverage weaker at 4.33x; concerns over financial flexibility.
3. Stock Volatility
Ecolab Inc.
- Beta near 1 (0.999) indicates market-correlated volatility typical for stable specialty chemical firms.
LyondellBasell Industries N.V.
- Lower beta (0.739) suggests less volatility but significant trading volume spikes imply episodic swings.
4. Regulatory & Legal
Ecolab Inc.
- Global operations with exposure to evolving environmental and hygiene regulations; compliance likely costly but well-managed.
LyondellBasell Industries N.V.
- Operates in multiple jurisdictions with complex chemical regulations; refining segment adds regulatory risk.
5. Supply Chain & Operations
Ecolab Inc.
- Diverse supply base in industrial and healthcare sectors; operational resilience aided by service orientation.
LyondellBasell Industries N.V.
- Highly dependent on feedstock availability and refining capacity; vulnerable to commodity price swings and logistics disruptions.
6. ESG & Climate Transition
Ecolab Inc.
- Positioned in water and hygiene solutions supporting sustainability; ESG initiatives likely a competitive moat.
LyondellBasell Industries N.V.
- Faces pressure to decarbonize refining and chemical production; transition risks weigh heavily on long-term outlook.
7. Geopolitical Exposure
Ecolab Inc.
- Primarily US-based with global sales; moderate geopolitical risk from trade policies and emerging markets.
LyondellBasell Industries N.V.
- Broad international footprint including Europe and Asia; higher geopolitical risk from trade tensions and energy markets.
Which company shows a better risk-adjusted profile?
Ecolab’s strongest risk is its valuation premium, which may limit downside protection despite solid fundamentals. LyondellBasell struggles most with weak profitability and capital structure, amplifying financial risks. I see Ecolab as having a better risk-adjusted profile given its robust operational metrics and safer financial footing, despite industry pressures. The absence of key financial ratios for LyondellBasell heightens my caution on its stability.
Final Verdict: Which stock to choose?
Ecolab Inc. (ECL) excels as a cash-generating powerhouse with a durable competitive advantage. Its growing ROIC above WACC signals efficient capital use and value creation. The main point of vigilance is its relatively high valuation multiples, which could weigh on returns. ECL suits investors targeting aggressive growth with a margin of safety.
LyondellBasell Industries N.V. (LYB) offers a strategic moat rooted in solid asset backing and moderate leverage, providing some defensive qualities versus Ecolab’s premium positioning. However, its earnings and profitability metrics appear weak, reflecting operational challenges. LYB fits better in a GARP portfolio seeking value with a cautious growth tilt.
If you prioritize durable value creation and can tolerate a premium price, Ecolab outshines with superior profitability and growth momentum. However, if you seek a more conservative entry with tangible asset support and potential turnaround, LyondellBasell offers better stability despite current headwinds. Both present distinct scenarios aligned with different investor risk appetites.
Disclaimer: Investment carries a risk of loss of initial capital. The past performance is not a reliable indicator of future results. Be sure to understand risks before making an investment decision.
Go Further
I encourage you to read the complete analyses of Ecolab Inc. and LyondellBasell Industries N.V. to enhance your investment decisions: