Home > Comparison > Basic Materials > LIN vs ECL
The strategic rivalry between Linde plc and Ecolab Inc. defines the current trajectory of the specialty chemicals sector. Linde operates as a capital-intensive industrial gas and engineering powerhouse, while Ecolab excels as a high-margin provider of water, hygiene, and infection prevention solutions. This analysis contrasts their distinct operational models and growth strategies to identify which offers superior risk-adjusted returns for a diversified portfolio.
Table of contents
Companies Overview
Linde plc and Ecolab Inc. stand as titans in the specialty chemicals sector, each shaping critical industrial and environmental solutions worldwide.
Linde plc: Industrial Gas Innovator
Linde plc dominates the industrial gas market with a diverse portfolio including oxygen, nitrogen, and specialty gases. Its core revenue derives from selling atmospheric and process gases. In 2026, Linde sharpens its focus on expanding turnkey process plants, reinforcing its engineering edge across multiple continents.
Ecolab Inc.: Hygiene and Water Solutions Leader
Ecolab Inc. excels in water treatment, hygiene, and infection prevention, generating revenue from industrial, institutional, and healthcare segments. The company’s 2026 strategy emphasizes integrated solutions combining cleaning, sanitizing, and pest control services, targeting sustainability and operational efficiency.
Strategic Collision: Similarities & Divergences
Both firms operate in specialty chemicals but diverge in approach: Linde pursues a capital-intensive industrial gas model, while Ecolab focuses on service-driven hygiene and water management. Their primary battleground lies in industrial client sectors needing reliable, scalable solutions. Linde offers a stable, asset-heavy profile; Ecolab presents a growth-oriented, service-centric investment case.
Income Statement Comparison
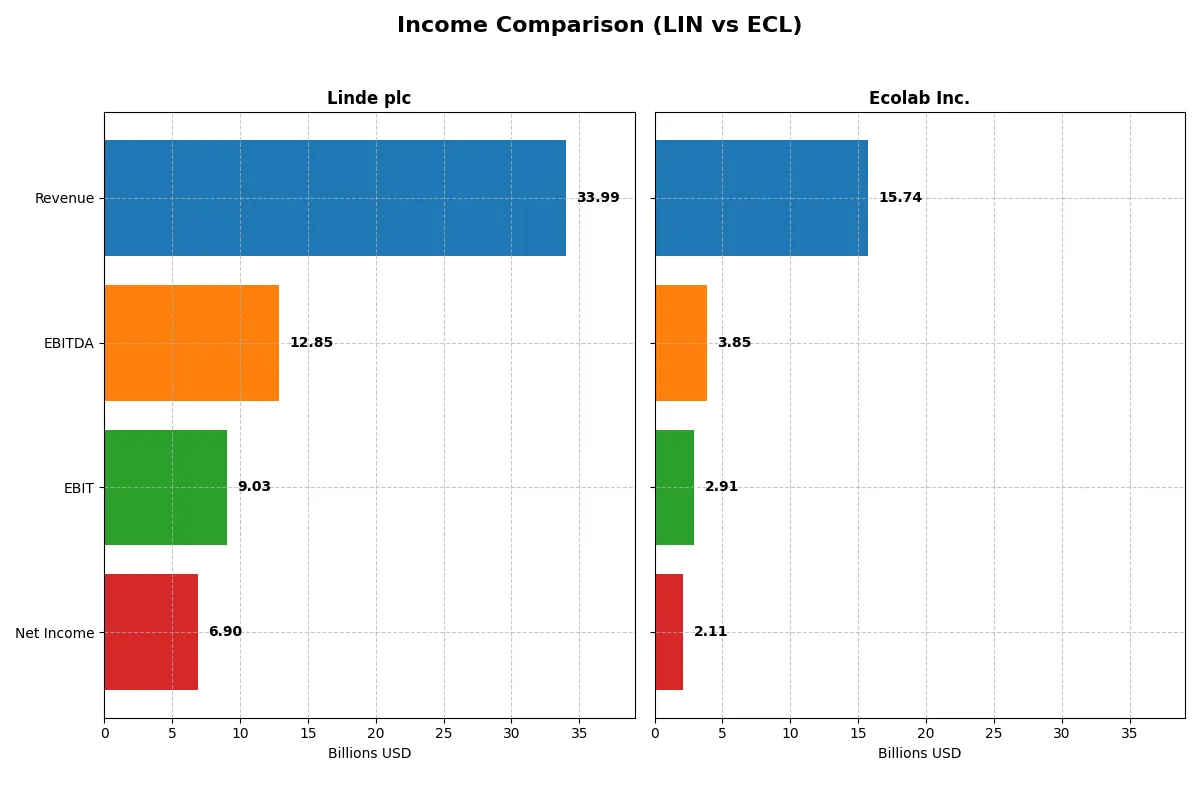
This table dissects the core profitability and scalability of both corporate engines to reveal who dominates the bottom line:
| Metric | Linde plc (LIN) | Ecolab Inc. (ECL) |
|---|---|---|
| Revenue | 33.99B | 15.74B |
| Cost of Revenue | 19.26B | 8.90B |
| Operating Expenses | 5.79B | 4.23B |
| Gross Profit | 14.73B | 6.84B |
| EBITDA | 12.85B | 3.85B |
| EBIT | 9.03B | 2.91B |
| Interest Expense | 212M | 338M |
| Net Income | 6.90B | 2.11B |
| EPS | 14.67 | 7.43 |
| Fiscal Year | 2025 | 2024 |
Income Statement Analysis: The Bottom-Line Duel
This income statement comparison reveals which company executes its business model with superior efficiency and profitability.
Linde plc Analysis
Linde’s revenue rose steadily from $30.8B in 2021 to $34B in 2025, reflecting a 10.4% growth over five years. Net income surged 80% to $6.9B, demonstrating robust bottom-line expansion. Gross margin improved to 43.3%, and net margin to 20.3%, signaling strong cost control and operational efficiency. Despite a slight dip in EBIT growth last year, Linde maintains excellent profitability momentum.
Ecolab Inc. Analysis
Ecolab grew revenue from $11.8B in 2020 to $15.7B in 2024, a 33.5% increase. Net income exploded 275% to $2.1B in 2024, highlighting significant profit acceleration. Gross margin stands at 43.5%, with a lower net margin of 13.4%, indicating higher operating costs relative to sales. The 38% EBIT growth last year and 54% EPS rise reflect strong recent operational improvements.
Margin Strength vs. Earnings Momentum
Linde leads in absolute profit and margin quality, delivering higher net income and margins than Ecolab. Meanwhile, Ecolab impresses with faster revenue and earnings growth rates, showcasing a powerful earnings momentum. For investors seeking stable, high-margin cash flow, Linde’s profile is more attractive. Ecolab suits those prioritizing rapid profit scaling.
Financial Ratios Comparison
These vital ratios act as a diagnostic tool to expose the underlying fiscal health, valuation premiums, and capital efficiency of the companies compared below:
| Ratios | Linde plc (LIN) | Ecolab Inc. (ECL) |
|---|---|---|
| ROE | 17.2% | 24.1% |
| ROIC | 9.2% | 11.8% |
| P/E | 30.5 | 31.5 |
| P/B | 5.26 | 7.61 |
| Current Ratio | 0.89 | 1.26 |
| Quick Ratio | 0.76 | 0.95 |
| D/E | 0.59 | 0.95 |
| Debt-to-Assets | 28.2% | 37.0% |
| Interest Coverage | 15.0 | 7.7 |
| Asset Turnover | 0.41 | 0.70 |
| Fixed Asset Turnover | 1.28 | 3.52 |
| Payout Ratio | 40.4% | 31.4% |
| Dividend Yield | 1.32% | 1.00% |
| Fiscal Year | 2024 | 2024 |
Efficiency & Valuation Duel: The Vital Signs
Financial ratios serve as a company’s DNA, exposing hidden risks and operational strengths that shape investor trust and valuation accuracy.
Linde plc
Linde posts a robust ROE of 17.23% and a strong net margin near 20%, signaling solid profitability. However, its P/E of 30.53 and P/B of 5.26 indicate the stock trades at a premium, reflecting stretched valuation. Shareholders benefit from a modest 1.32% dividend yield, balancing returns with reinvestment in core operations.
Ecolab Inc.
Ecolab delivers an impressive 24.12% ROE and a 13.42% net margin, showing operational efficiency. Its P/E ratio of 31.54 and P/B of 7.61 mark the stock as expensive. The company yields 1.0% in dividends, slightly lower than Linde, but compensates with a favorable ROIC of 11.8%, indicating effective capital deployment.
Valuation Pressure Meets Operational Strength
Ecolab shows stronger profitability and capital efficiency but at a higher valuation multiple. Linde offers a steadier dividend and a more balanced risk profile despite stretched pricing. Investors seeking growth lean toward Ecolab, while those favoring income and moderate risk may prefer Linde’s steadier metrics.
Which one offers the Superior Shareholder Reward?
I see Linde plc (LIN) and Ecolab Inc. (ECL) both pay dividends and execute buybacks, but their approaches differ sharply. LIN yields 1.32% with a 40% payout ratio, balancing dividends and robust buybacks fueled by free cash flow of $10.3/share. ECL offers a lower 1.0% yield and a 31% payout ratio, conserving more cash for growth. LIN’s dividend plus buyback coverage ratio above 1.3 signals sustainability, while ECL’s higher leverage and lower margins raise caution. I judge LIN’s more balanced distribution strategy delivers stronger total shareholder returns and sustainable value in 2026.
Comparative Score Analysis: The Strategic Profile
The radar chart reveals the fundamental DNA and trade-offs of Linde plc and Ecolab Inc., highlighting their core financial strengths and vulnerabilities:
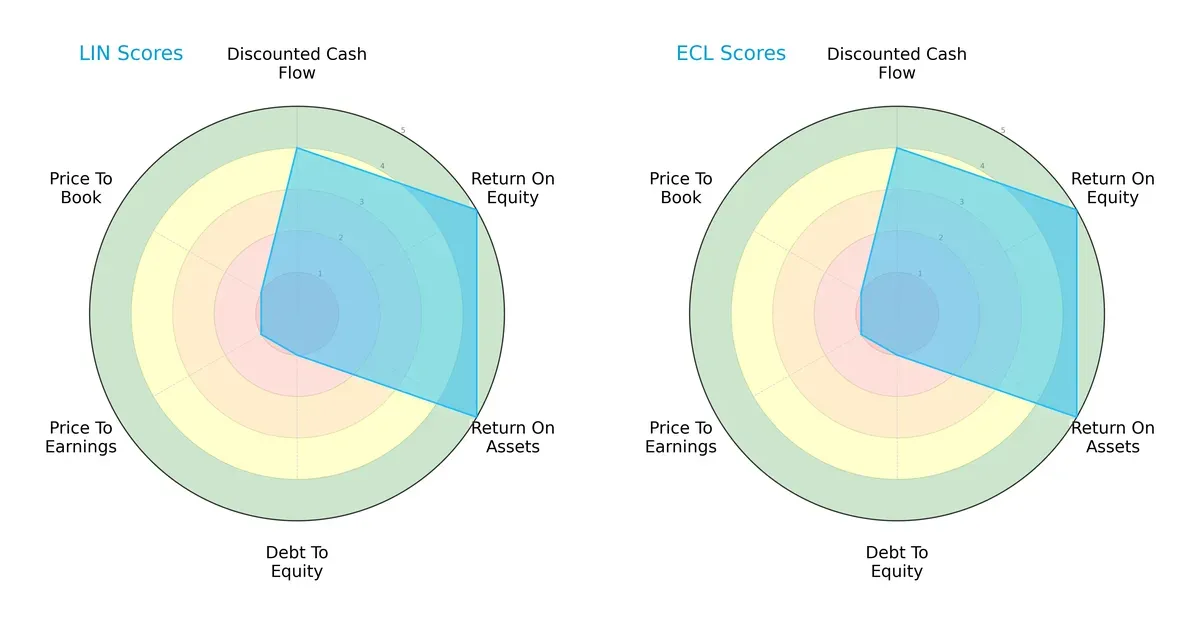
Both companies exhibit strong operational efficiency with top scores in ROE and ROA (5 each), reflecting superior capital utilization. Their discounted cash flow (DCF) scores are equally favorable at 4, suggesting solid future cash flow prospects. However, both struggle significantly on leverage and valuation metrics, scoring a very unfavorable 1 in debt-to-equity, price-to-earnings, and price-to-book ratios. Neither shows a balanced financial profile; instead, they rely heavily on operational excellence, while their elevated debt and stretched valuations pose notable risks.
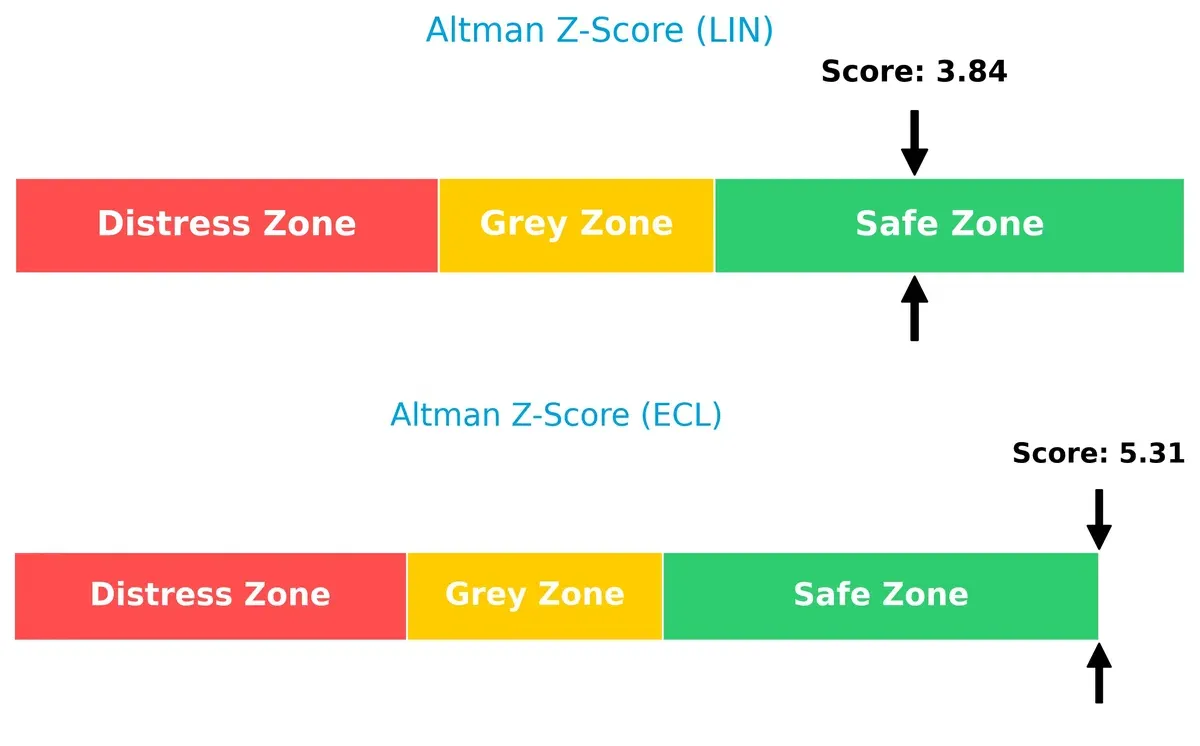
Bankruptcy Risk: Solvency Showdown
Linde’s Altman Z-Score stands at 3.84 versus Ecolab’s stronger 5.31, placing both comfortably in the safe zone for bankruptcy risk. This gap indicates Ecolab maintains a more resilient balance sheet and lower default risk in today’s tightening cycle:
Financial Health: Quality of Operations
Ecolab’s Piotroski F-Score of 7 surpasses Linde’s 6, signaling stronger internal financial health and operational quality. Linde’s lower score hints at some red flags in profitability or liquidity metrics compared to Ecolab’s more robust fundamentals:

How are the two companies positioned?
This section dissects LIN and ECL’s operational DNA by comparing their revenue distribution and internal strengths and weaknesses. The goal is to confront their economic moats and identify which model delivers the most resilient competitive advantage today.
Revenue Segmentation: The Strategic Mix
This visual comparison dissects how Linde plc and Ecolab Inc. diversify their income streams and where their primary sector bets lie:
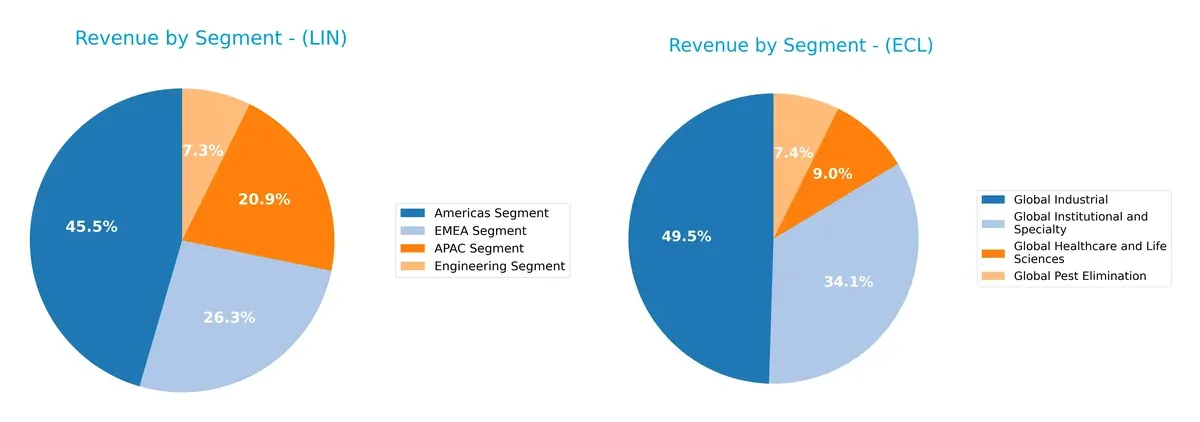
Linde’s revenue pivots heavily on the Americas segment at $14.4B, anchoring its geographic dominance, while APAC and EMEA contribute $6.6B and $8.4B respectively, reflecting a balanced regional spread. In contrast, Ecolab’s revenue distributes more evenly across Global Industrial ($7.9B) and Global Institutional and Specialty ($5.4B), showing a diversified portfolio. Linde’s geographic concentration risks contrast with Ecolab’s sectoral diversification, underpinning distinct strategic moats.
Strengths and Weaknesses Comparison
This table compares the strengths and weaknesses of Linde plc and Ecolab Inc.:
Linde plc Strengths
- Diverse revenue across Americas, EMEA, APAC, and Engineering segments
- Strong net margin at 19.89%
- Favorable debt-to-assets at 28.21%
- High interest coverage of 42.6
- Global presence including US, Germany, China, UK
Ecolab Inc. Strengths
- High ROE at 24.12% and ROIC at 11.8%
- Favorable fixed asset turnover at 3.52
- Diverse revenue streams in Industrial, Institutional, Healthcare
- Global footprint including US, Europe, Asia Pacific
- Favorable interest coverage and WACC
Linde plc Weaknesses
- Low current ratio at 0.89 and quick ratio at 0.76 indicate liquidity concerns
- Unfavorable P/E of 30.53 and P/B of 5.26
- Asset turnover weak at 0.41
- Neutral ROIC vs WACC spread
- Dividend yield modest at 1.32%
Ecolab Inc. Weaknesses
- Unfavorable P/E at 31.54 and P/B at 7.61
- Neutral current and quick ratios near 1.0 may limit liquidity flexibility
- Higher debt-to-assets at 37%
- Dividend yield low at 1.0%
- Interest coverage lower than peer at 8.6
Both companies show diversified global operations with solid profitability metrics. Linde’s liquidity ratios and asset turnover lag, while Ecolab carries higher valuation multiples and heavier debt. These factors shape each firm’s capital allocation and risk profile going forward.
The Moat Duel: Analyzing Competitive Defensibility
A structural moat is the only defense preserving long-term profits against relentless competitive erosion. Here’s how Linde plc and Ecolab Inc. stack up:
Linde plc: Engineering Scale and Cost Advantage
Linde’s moat stems from its vast industrial gas infrastructure and scale, delivering stable margins and a slightly favorable ROIC trend. Expansion in hydrogen and specialty gases could deepen its moat by 2026, though margin pressure looms.
Ecolab Inc.: Service Integration and Intangible Assets
Ecolab’s moat centers on deep customer relationships and specialized hygiene solutions, outperforming Linde with a very favorable ROIC spread above WACC. Its innovation in water treatment and infection prevention supports durable growth and market disruption potential.
Verdict: Infrastructure Scale vs. Service Intangibles
Ecolab’s wider moat outpaces Linde’s slightly favorable cost advantage, supported by stronger ROIC and margin expansion. I see Ecolab better positioned to defend and grow market share amid evolving industry demands.
Which stock offers better returns?
The past year shows contrasting dynamics: Linde plc’s shares declined overall with recent strong gains, while Ecolab Inc. surged consistently, reflecting divergent investor sentiment.
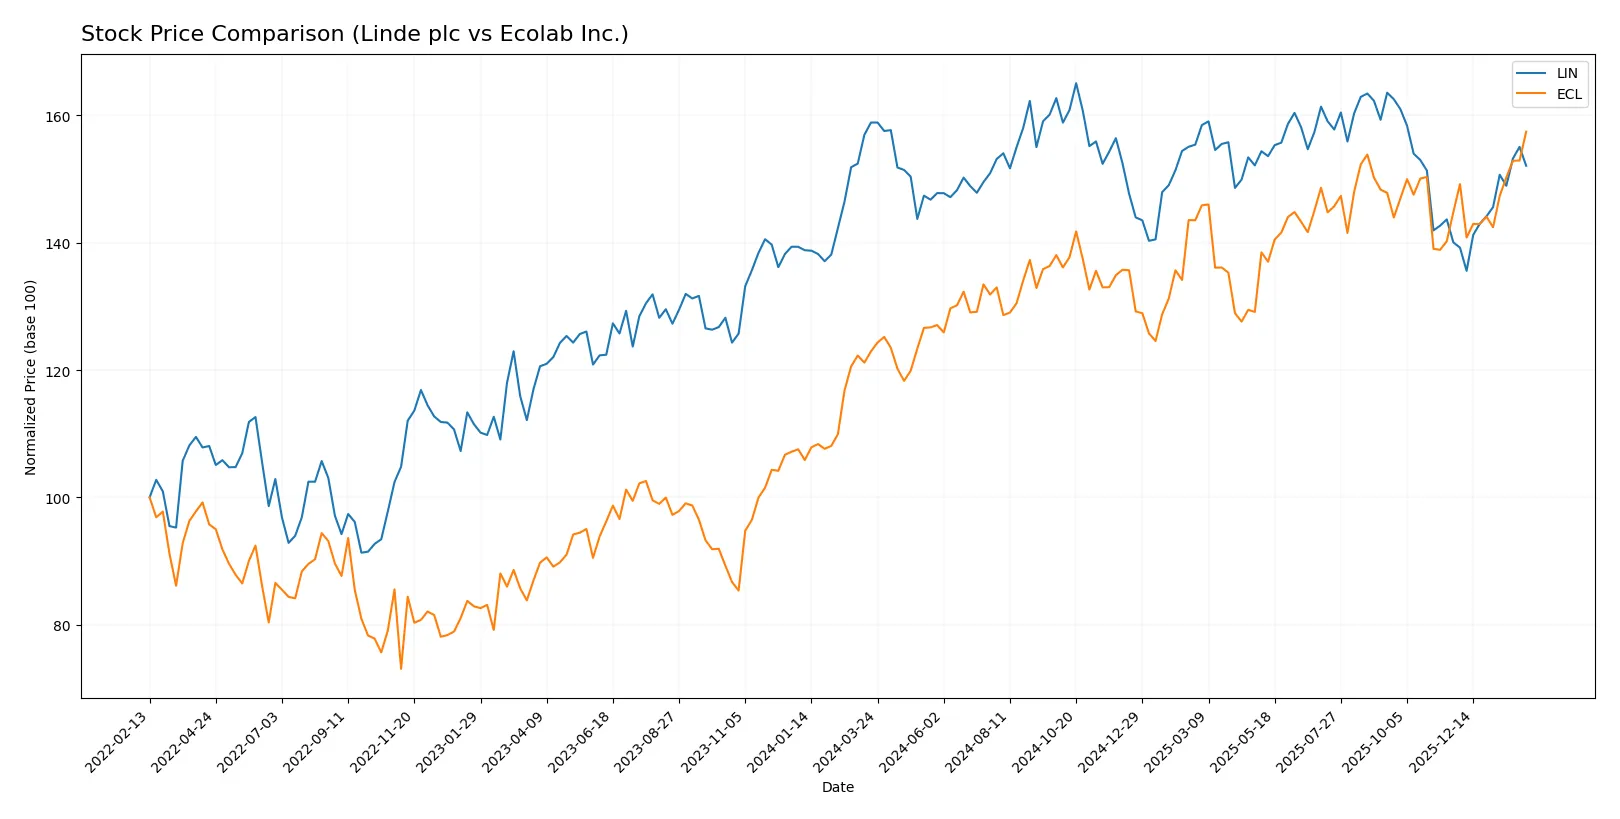
Trend Comparison
Linde plc’s stock fell 4.27% over the past 12 months, marking a bearish trend with accelerating decline and a high volatility of 19.05. The recent three-month period reversed with an 8.6% gain.
Ecolab Inc. gained 28.07% over the past year, showing a bullish trend with accelerating upward momentum and lower volatility at 16.43. Recent gains of 8.71% continue this positive trajectory.
Ecolab’s stock outperformed Linde over the last year, delivering the highest total return with sustained bullish momentum and stronger buyer dominance.
Target Prices
Analysts present a confident consensus on target prices for Linde plc and Ecolab Inc.
| Company | Target Low | Target High | Consensus |
|---|---|---|---|
| Linde plc | 490 | 550 | 516 |
| Ecolab Inc. | 295 | 315 | 303.43 |
Linde’s consensus target sits about 15% above its current 448 price, signaling upside potential. Ecolab’s target consensus also suggests modest gains from the current 290 level.

Don’t Let Luck Decide Your Entry Point
Optimize your entry points with our advanced ProRealTime indicators. You’ll get efficient buy signals with precise price targets for maximum performance. Start outperforming now!
How do institutions grade them?
Linde plc Grades
The following table summarizes recent grades from major financial institutions for Linde plc:
| Grading Company | Action | New Grade | Date |
|---|---|---|---|
| Citigroup | Maintain | Buy | 2026-02-06 |
| UBS | Maintain | Buy | 2026-02-06 |
| JP Morgan | Downgrade | Neutral | 2026-02-06 |
| Citigroup | Maintain | Buy | 2026-01-21 |
| RBC Capital | Maintain | Outperform | 2025-12-12 |
| UBS | Upgrade | Buy | 2025-11-11 |
| RBC Capital | Maintain | Outperform | 2025-11-06 |
| JP Morgan | Maintain | Overweight | 2025-11-03 |
| Seaport Global | Upgrade | Buy | 2025-11-03 |
| Citigroup | Maintain | Buy | 2025-11-03 |
Ecolab Inc. Grades
Below are recent institutional grades for Ecolab Inc. from reputable sources:
| Grading Company | Action | New Grade | Date |
|---|---|---|---|
| Citigroup | Maintain | Buy | 2026-01-21 |
| Wells Fargo | Maintain | Equal Weight | 2026-01-14 |
| UBS | Maintain | Neutral | 2026-01-07 |
| Citigroup | Maintain | Buy | 2025-12-18 |
| Evercore ISI Group | Upgrade | Outperform | 2025-11-03 |
| UBS | Maintain | Neutral | 2025-10-31 |
| Citigroup | Maintain | Buy | 2025-10-29 |
| Stifel | Maintain | Buy | 2025-10-29 |
| JP Morgan | Maintain | Neutral | 2025-10-29 |
| Barclays | Maintain | Overweight | 2025-10-29 |
Which company has the best grades?
Linde plc generally holds stronger buy and outperform ratings, though JP Morgan recently downgraded it to neutral. Ecolab’s grades cluster around buy and neutral, with a notable outperform upgrade from Evercore. Investors may view Linde as slightly more favored by analysts.
Risks specific to each company
The following categories identify critical pressure points and systemic threats facing Linde plc and Ecolab Inc. in the 2026 market environment:
1. Market & Competition
Linde plc
- Faces intense competition in industrial gases with pressure to innovate hydrogen and specialty gases.
Ecolab Inc.
- Competes in diverse water, hygiene, and infection prevention markets with strong brand presence but varied customer demands.
2. Capital Structure & Debt
Linde plc
- Moderate leverage with debt-to-assets at 28%, but weak liquidity ratios (current 0.89) raise short-term risk.
Ecolab Inc.
- Higher leverage at 37% debt-to-assets; better liquidity (current ratio 1.26) reduces immediate solvency concerns.
3. Stock Volatility
Linde plc
- Beta at 0.85 suggests below-market volatility, potentially more stable in turbulent cycles.
Ecolab Inc.
- Beta near 1.0 indicates stock moves roughly in line with market, implying moderate volatility risk.
4. Regulatory & Legal
Linde plc
- Exposure to environmental regulations tied to specialty gases and plant construction globally.
Ecolab Inc.
- Faces strict regulations in healthcare and sanitation sectors, with liability risks in infection control products.
5. Supply Chain & Operations
Linde plc
- Complex global supply chains for gases and engineering projects vulnerable to disruption and cost inflation.
Ecolab Inc.
- Diverse supply chain for chemicals and services; operational continuity critical amid raw material price swings.
6. ESG & Climate Transition
Linde plc
- Transition to green hydrogen and carbon management is capital intensive but essential for long-term competitiveness.
Ecolab Inc.
- Focus on water conservation and hygiene aligns with ESG trends, though execution risks remain.
7. Geopolitical Exposure
Linde plc
- Operates in multiple regions including EMEA and APAC, exposing it to geopolitical tensions and trade policy shifts.
Ecolab Inc.
- Primarily US-based with international operations, somewhat less exposed but still sensitive to global trade issues.
Which company shows a better risk-adjusted profile?
Linde’s biggest risk lies in its weak liquidity ratios amid moderate debt, which could strain short-term financial flexibility. Ecolab faces elevated leverage but compensates with stronger liquidity and a more favorable Altman Z-score. I find Ecolab’s risk-adjusted profile slightly better; its recent Piotroski score improvement to 7 signals rising financial strength, mitigating debt concerns.
Final Verdict: Which stock to choose?
Linde plc’s superpower lies in its operational efficiency and strong profitability metrics, signaling a well-oiled cash machine in industrial gases. Its point of vigilance is the suboptimal liquidity position, which could pressure short-term flexibility. This stock fits well within an aggressive growth portfolio focused on stable cash flow generation amid cyclical challenges.
Ecolab Inc. boasts a strategic moat through its sustainable competitive advantage and superior return on invested capital, reflecting solid value creation. Compared to Linde, it offers a more balanced safety profile with a healthier liquidity position. Ecolab suits a GARP (Growth at a Reasonable Price) portfolio, blending growth potential with relative stability.
If you prioritize operational efficiency and cash generation in capital-intensive industries, Linde outshines with its improving profitability. However, if you seek a blend of durable competitive advantage and financial stability, Ecolab offers better risk-adjusted prospects despite commanding a premium valuation. Each presents a nuanced scenario tailored to distinct investor strategies.
Disclaimer: Investment carries a risk of loss of initial capital. The past performance is not a reliable indicator of future results. Be sure to understand risks before making an investment decision.
Go Further
I encourage you to read the complete analyses of Linde plc and Ecolab Inc. to enhance your investment decisions: