Home > Comparison > Industrials > ETN vs XYL
The strategic rivalry between Eaton Corporation plc and Xylem Inc. defines the current trajectory of the Industrials sector. Eaton operates as a diversified power management powerhouse, blending electrical, aerospace, and vehicle segments. In contrast, Xylem specializes in engineered water solutions, emphasizing innovation in water infrastructure and smart technologies. This analysis will assess which company’s distinct operational model offers superior risk-adjusted returns for a diversified portfolio navigating industrial market dynamics.
Table of contents
Companies Overview
Eaton Corporation and Xylem Inc. are key industrial machinery players shaping global infrastructure markets.
Eaton Corporation plc: Power Management Leader
Eaton dominates as a power management company, generating revenue from electrical components, aerospace systems, and vehicle powertrains. Its broad portfolio spans industrial power distribution, hydraulic systems, and eMobility solutions. In 2026, Eaton’s strategic focus centers on expanding its electrical and aerospace segments, enhancing energy efficiency and advanced vehicle technologies worldwide.
Xylem Inc.: Water Technology Innovator
Xylem specializes in engineered solutions for water and wastewater applications across global markets. Its revenue stems from pumps, filtration, and smart measurement systems. In 2026, Xylem prioritizes innovation in water infrastructure and digital monitoring, leveraging cloud analytics and remote asset management to address critical water challenges and improve operational efficiency.
Strategic Collision: Similarities & Divergences
Both operate within industrial machinery but pursue distinct ecosystem approaches: Eaton offers integrated power management, while Xylem emphasizes specialized water technologies with digital services. Their core battleground is infrastructure modernization, targeting energy and water sectors respectively. Investors must weigh Eaton’s diversified industrial scale against Xylem’s niche tech-driven growth profile.
Income Statement Comparison
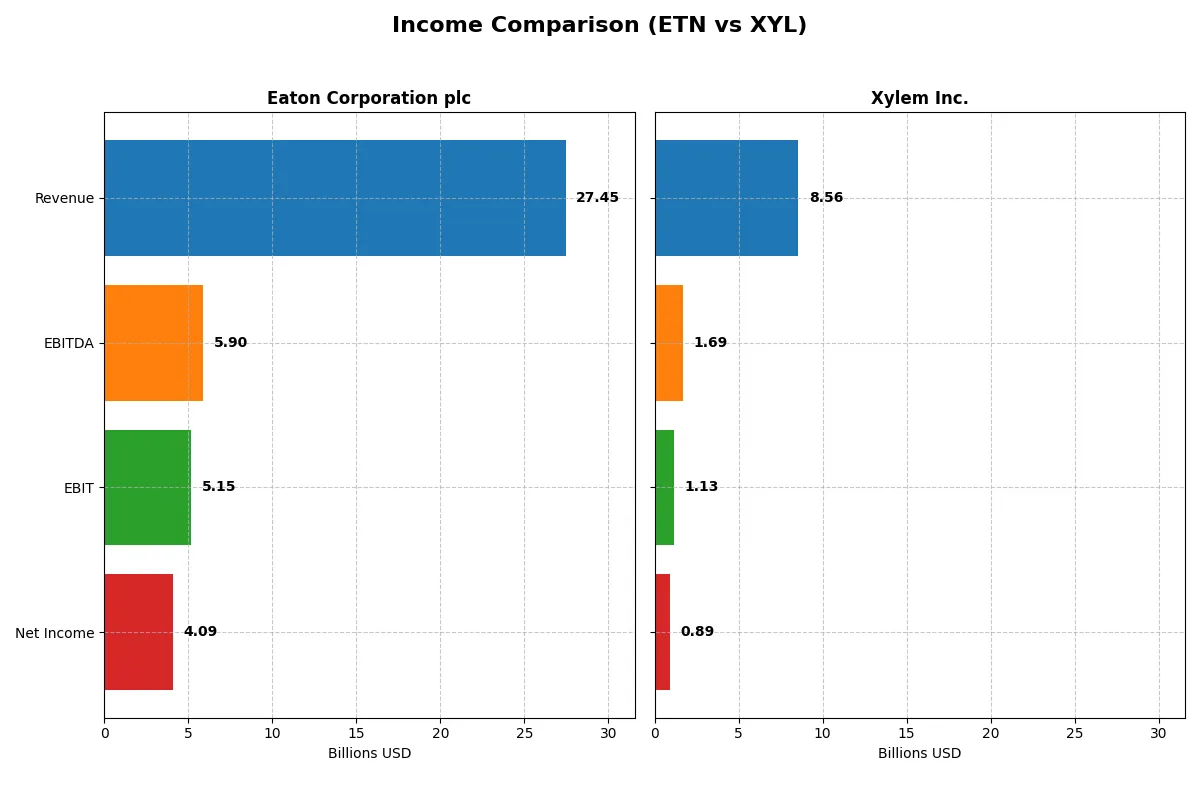
The data below dissects the core profitability and scalability of both corporate engines to reveal who dominates the bottom line:
| Metric | Eaton Corporation plc (ETN) | Xylem Inc. (XYL) |
|---|---|---|
| Revenue | 27.4B | 8.56B |
| Cost of Revenue | 17.1B | 5.35B |
| Operating Expenses | 5.08B | 2.20B |
| Gross Profit | 10.3B | 3.21B |
| EBITDA | 5.90B | 1.69B |
| EBIT | 5.15B | 1.13B |
| Interest Expense | 264M | 44M |
| Net Income | 4.09B | 890M |
| EPS | 10.49 | 3.67 |
| Fiscal Year | 2025 | 2024 |
Income Statement Analysis: The Bottom-Line Duel
This income statement comparison reveals the true operational efficiency and profitability of Eaton Corporation plc and Xylem Inc.
Eaton Corporation plc Analysis
Eaton’s revenue climbed steadily from $19.6B in 2021 to $27.4B in 2025, while net income nearly doubled from $2.1B to $4.1B. The company sustains healthy margins, with a strong gross margin of 37.6% and a net margin near 15% in 2025. Operating efficiency improved, evidenced by EBIT growth of 9.3% in the last year, though net margin dipped slightly.
Xylem Inc. Analysis
Xylem accelerated revenue growth from $4.9B in 2020 to $8.6B in 2024, with net income surging from $254M to $890M. Margins remain solid, featuring a gross margin of 37.5% and a net margin above 10% in 2024. EBIT expanded impressively by over 65% last year, reflecting strong momentum and improved operational leverage.
Steady Scale vs. Rapid Momentum
Eaton offers a larger scale with consistent margin strength and nearly 91% net income growth over five years. Xylem delivers faster growth rates, with net income increasing over 250% and EBIT surging 65% in the latest year. Eaton appeals for stability and margin durability, while Xylem’s profile suits investors prioritizing rapid earnings acceleration.
Financial Ratios Comparison
These vital ratios act as a diagnostic tool to expose the underlying fiscal health, valuation premiums, and capital efficiency of each company:
| Ratios | Eaton Corporation plc (ETN) | Xylem Inc. (XYL) |
|---|---|---|
| ROE | 21.1% | 8.36% |
| ROIC | 13.1% | 5.78% |
| P/E | 30.2 | 31.6 |
| P/B | 6.37 | 2.64 |
| Current Ratio | 1.32 | 1.75 |
| Quick Ratio | 0.81 | 1.33 |
| D/E | 0.54 | 0.20 |
| Debt-to-Assets | 25.5% | 12.9% |
| Interest Coverage | 19.8 | 22.9 |
| Asset Turnover | 0.67 | 0.52 |
| Fixed Asset Turnover | 5.40 | 7.43 |
| Payout ratio | 39.5% | 39.3% |
| Dividend yield | 1.31% | 1.24% |
| Fiscal Year | 2025 | 2024 |
Efficiency & Valuation Duel: The Vital Signs
Financial ratios act as a company’s DNA, exposing hidden risks and revealing operational excellence to refine investment decisions.
Eaton Corporation plc
Eaton boasts a strong ROE of 21.05% and a healthy net margin of 14.9%, signaling robust profitability. Its P/E of 30.24 suggests a stretched valuation relative to earnings. Eaton returns value through a 1.31% dividend yield, balancing shareholder rewards with reinvestment in R&D at nearly 3% of revenue.
Xylem Inc.
Xylem shows moderate profitability with an 8.36% ROE and a net margin of 10.39%. Its P/E of 31.63 also indicates an expensive stock. The firm supports shareholders with a 1.24% dividend yield, while maintaining favorable liquidity and debt metrics, emphasizing operational stability over aggressive growth.
Premium Valuation vs. Operational Safety
Eaton offers superior profitability but at the cost of a higher valuation multiple. Xylem delivers more conservative returns with stronger liquidity and lower leverage. Investors seeking growth and yield may lean toward Eaton, while those prioritizing financial safety may prefer Xylem’s stable profile.
Which one offers the Superior Shareholder Reward?
I find Eaton Corporation (ETN) delivers a more compelling shareholder reward than Xylem Inc. (XYL) in 2026. ETN offers a 1.3% dividend yield with a sustainable 39% payout ratio, backed by strong free cash flow coverage. Its share buybacks complement dividends, enhancing total returns. Conversely, XYL yields about 1.2% with a similar payout ratio but invests more heavily in growth and R&D, reflecting a less immediate but longer-term value approach. ETN’s balanced distribution model and robust cash flow make it the superior choice for investors seeking consistent returns and capital efficiency today.
Comparative Score Analysis: The Strategic Profile
The radar chart reveals the fundamental DNA and trade-offs of Eaton Corporation plc and Xylem Inc., highlighting their core financial strengths and valuation challenges:
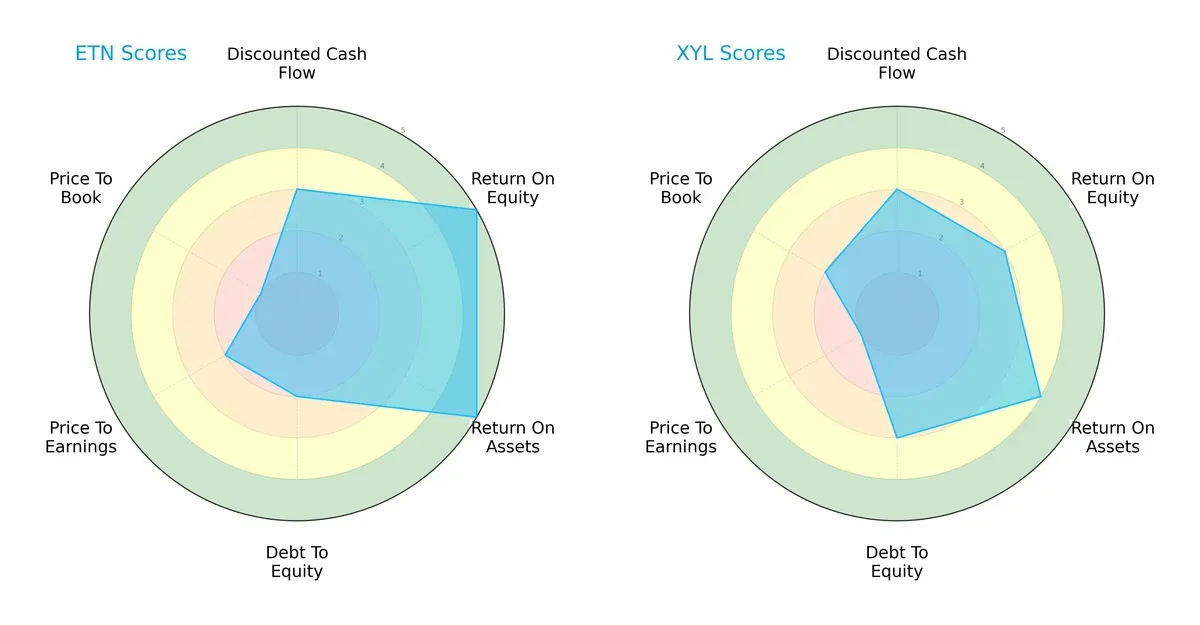
Eaton shows superior operational efficiency with top ROE and ROA scores (5 each), but it carries heavier leverage and valuation risks, reflected in weaker Debt/Equity (2) and Price-to-Book (1) scores. Xylem posts a more balanced financial risk profile with moderate leverage (3) and a slightly better Price-to-Book score (2), though it lags in profitability metrics like ROE (3). Eaton relies on operational excellence, while Xylem offers steadier financial stability.
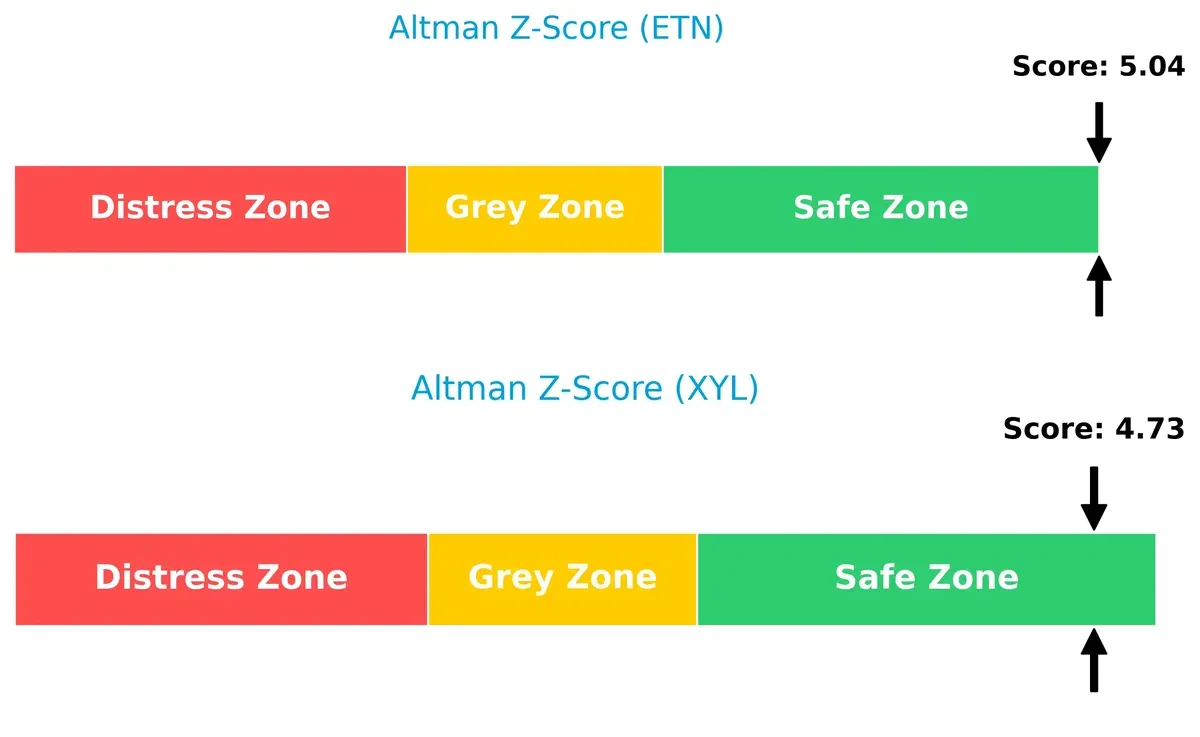
Bankruptcy Risk: Solvency Showdown
The Altman Z-Score gap favors Eaton (5.04) over Xylem (4.73), both safely above the distress threshold, indicating strong solvency and low bankruptcy risk in this cycle:
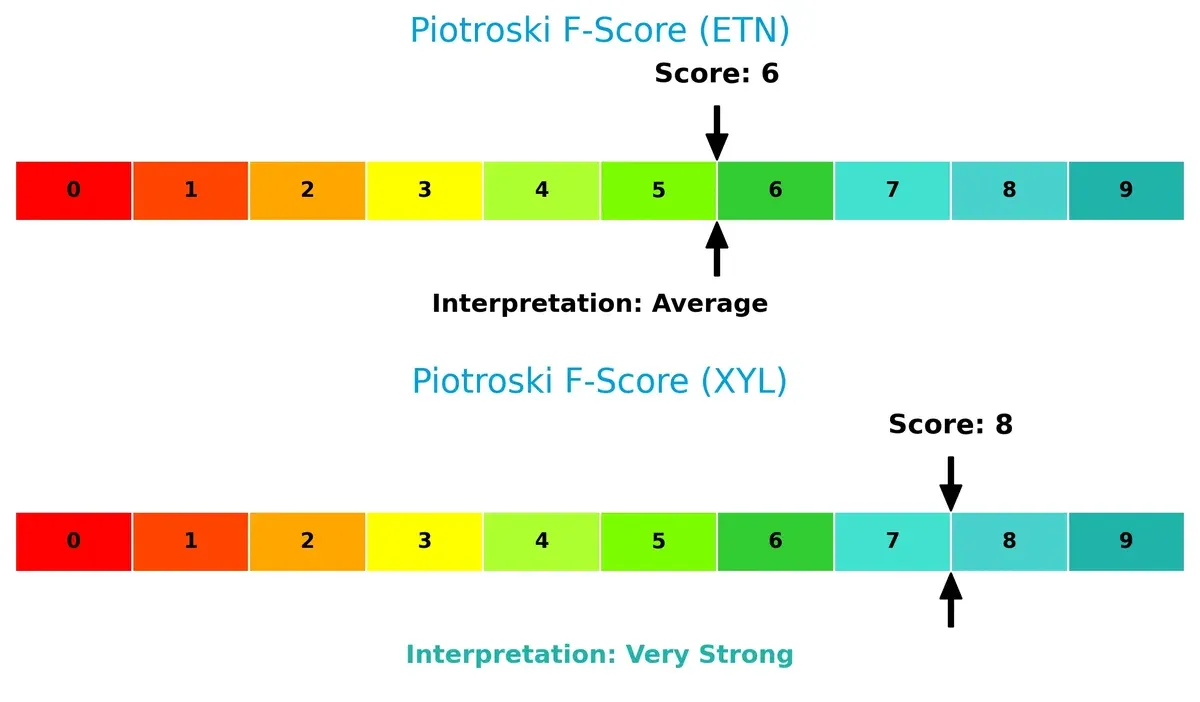
Financial Health: Quality of Operations
Xylem’s Piotroski score of 8 signals very strong internal financial health, surpassing Eaton’s average score of 6. This suggests Eaton may face red flags in operational efficiency or liquidity compared to Xylem’s robust fundamentals:
How are the two companies positioned?
This section dissects Eaton and Xylem’s operational DNA by comparing their revenue distribution and internal dynamics. Our goal is to confront their economic moats, revealing which model offers the most resilient competitive advantage today.
Revenue Segmentation: The Strategic Mix
This visual comparison dissects how Eaton Corporation plc and Xylem Inc. diversify their income streams and where their primary sector bets lie:
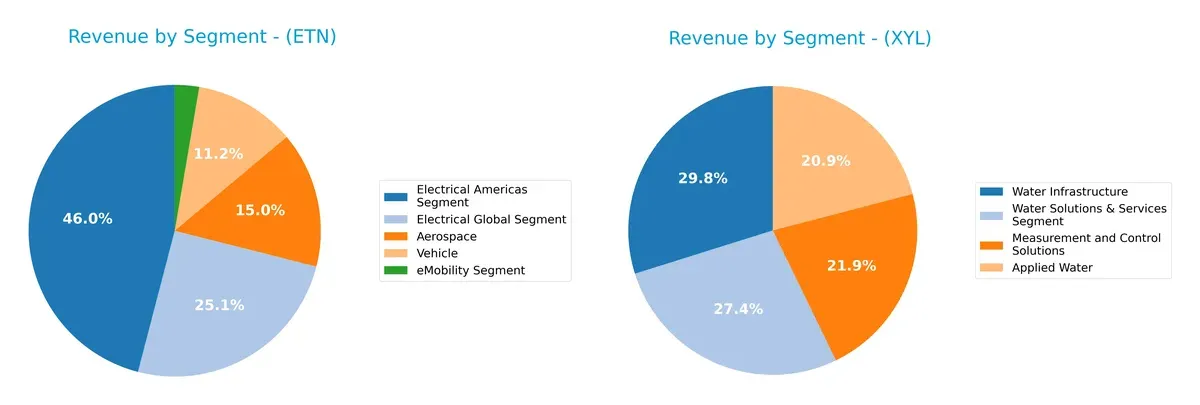
Eaton anchors its revenue in Electrical Americas ($11.4B) and Electrical Global ($6.2B), dwarfing other segments like Aerospace ($3.7B) and Vehicle ($2.8B). This mix shows a strong infrastructure and industrial lock-in. Xylem, by contrast, balances revenue across Water Infrastructure ($2.6B), Water Solutions & Services ($2.3B), and Measurement and Control ($1.9B), revealing a more diversified water-tech portfolio. Eaton faces concentration risk; Xylem pivots on a broader service ecosystem.
Strengths and Weaknesses Comparison
This table compares the Strengths and Weaknesses of Eaton Corporation plc and Xylem Inc.:
Eaton Corporation plc Strengths
- Highly diversified segments including Aerospace, Electrical Americas, Electrical Global, Vehicle, and eMobility
- Strong profitability with net margin 14.9% and ROE 21.05%
- Favorable debt-to-assets ratio at 25.53% and strong interest coverage at 19.5x
- Global presence with significant revenues in the United States, Europe, and Asia Pacific
- Favorable fixed asset turnover at 5.4 indicating efficient use of fixed assets
Xylem Inc. Strengths
- Favorable liquidity ratios with current ratio 1.75 and quick ratio 1.33
- Low leverage with debt-to-equity 0.2 and debt-to-assets 12.88%
- Solid interest coverage at 25.7x and favorable fixed asset turnover at 7.43
- Global footprint including strong U.S. and European revenues
- Favorable net margin at 10.39% and balanced segment revenues in Applied Water and Water Infrastructure
Eaton Corporation plc Weaknesses
- Unfavorable valuation multiples with PE 30.24 and PB 6.37 indicating premium pricing
- Neutral liquidity ratios with current ratio 1.32 and quick ratio 0.81
- Moderate asset turnover at 0.67 limiting turnover efficiency
- Slightly higher debt-to-equity at 0.54 compared to Xylem
- Heavy revenue concentration in Electrical Americas and U.S. markets
Xylem Inc. Weaknesses
- Lower profitability with ROE 8.36% below sector average
- Unfavorable PE ratio at 31.63 signaling expensive valuation
- Moderate ROIC at 5.78% near cost of capital
- Less diversified segment base focused on water solutions
- Smaller revenue scale and geographic concentration in U.S. and Europe
Eaton exhibits stronger profitability and diversification but carries premium valuation and moderate liquidity. Xylem benefits from better liquidity and lower leverage yet faces pressures on profitability and segment concentration. These contrasts influence each company’s strategic flexibility and risk profile.
The Moat Duel: Analyzing Competitive Defensibility
A structural moat is the only reliable shield protecting long-term profits from relentless competitive erosion. Let’s dissect how two industrial giants guard their turf:
Eaton Corporation plc: Diversified Industrial Powerhouse with Operational Excellence
Eaton’s moat stems from its broad product portfolio and scale, creating strong switching costs. It delivers a very favorable ROIC-WACC spread of 4.26%, reflecting efficient capital use and margin stability. New eMobility and aerospace segments may deepen this advantage in 2026.
Xylem Inc.: Specialized Water Solutions with Innovation-Driven Growth
Xylem’s moat relies on specialized water technology and service integration, contrasting Eaton’s scale. Despite a negative ROIC-WACC spread, its improving profitability and 31.7% ROIC growth signal expanding operational efficiency. Innovations in smart water tech could disrupt markets further.
Moat Strength: Scale Dominance vs. Innovation Momentum
Eaton commands the deeper moat with its sustainable value creation and scale economies. Xylem’s rising profitability is promising but remains slightly unfavorable on capital returns. Eaton is better positioned to defend market share amid industrial cyclicality.
Which stock offers better returns?
The past year shows Eaton Corporation plc with a strong upward price movement and accelerating bullish momentum. Xylem Inc. also trends upward but with more moderate gains and less recent acceleration.
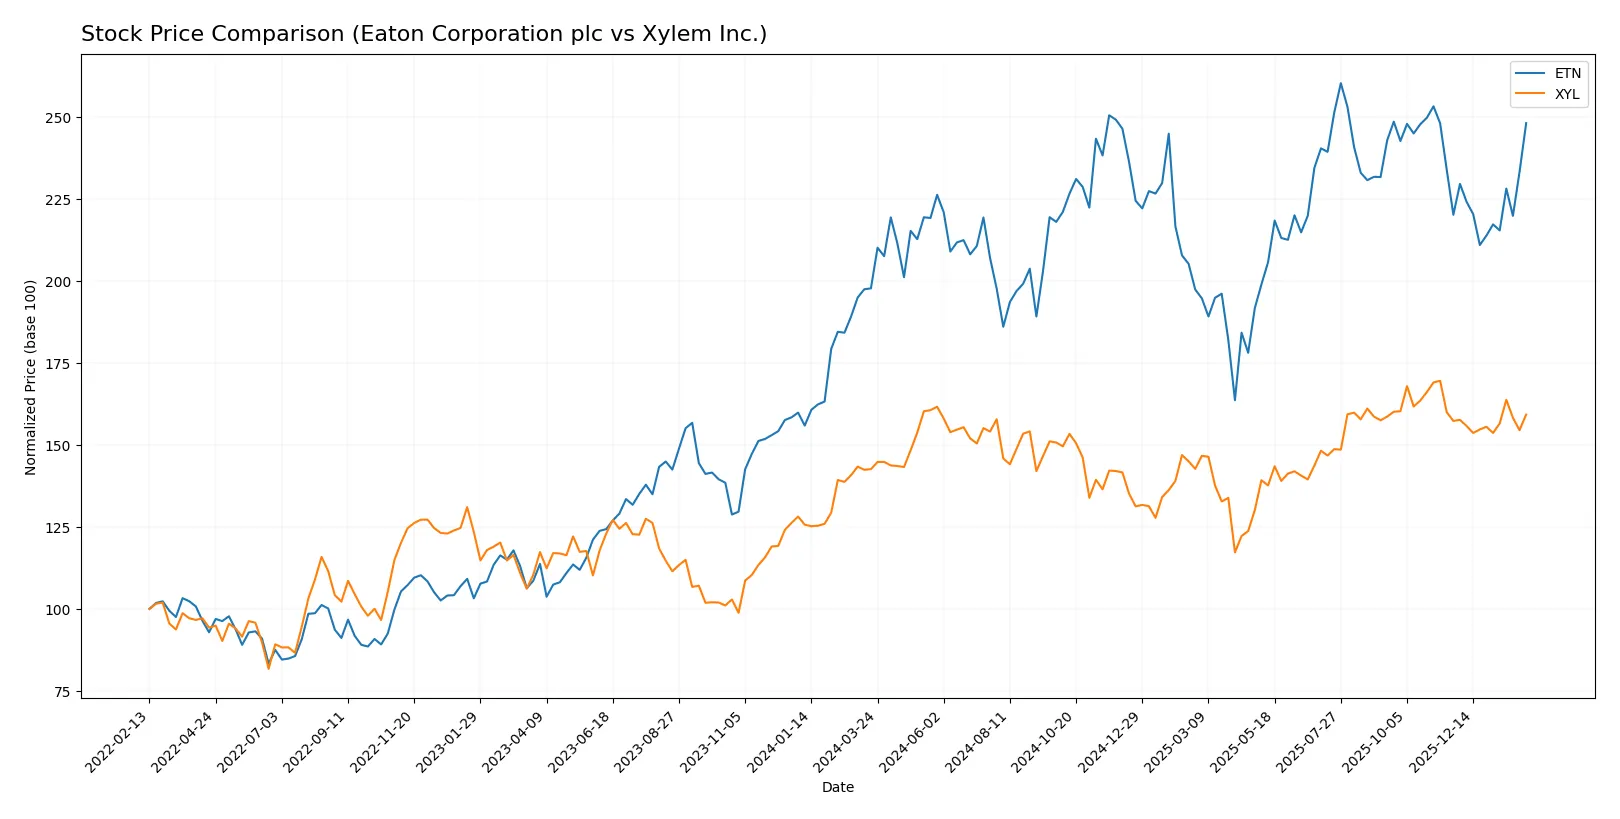
Trend Comparison
Eaton Corporation plc’s stock price rose 25.49% over the past 12 months, signaling a clear bullish trend with accelerating momentum and a high of 392.17. Volatility is elevated, indicated by a 29.52 standard deviation.
Xylem Inc.’s stock increased 11.67% over the same period, confirming a bullish trend but with less acceleration and lower volatility (9.59 std deviation). Recent price changes flattened near 1.23%.
Eaton’s stock delivered superior market performance versus Xylem, with stronger gains and momentum throughout the year.
Target Prices
Analysts present a moderate bullish consensus for Eaton Corporation plc and Xylem Inc. through 2026.
| Company | Target Low | Target High | Consensus |
|---|---|---|---|
| Eaton Corporation plc | 295 | 495 | 393.64 |
| Xylem Inc. | 150 | 178 | 169.67 |
Eaton’s consensus target sits about 5% above the current price of 374, indicating modest upside. Xylem’s consensus target exceeds its 142 price by nearly 19%, suggesting stronger growth expectations.

Don’t Let Luck Decide Your Entry Point
Optimize your entry points with our advanced ProRealTime indicators. You’ll get efficient buy signals with precise price targets for maximum performance. Start outperforming now!
How do institutions grade them?
Eaton Corporation plc Grades
The following table summarizes recent institutional grades for Eaton Corporation plc:
| Grading Company | Action | New Grade | Date |
|---|---|---|---|
| Wells Fargo | Maintain | Equal Weight | 2026-02-04 |
| JP Morgan | Maintain | Overweight | 2026-01-16 |
| HSBC | Upgrade | Buy | 2026-01-16 |
| Morgan Stanley | Maintain | Overweight | 2026-01-12 |
| Citigroup | Maintain | Buy | 2026-01-12 |
| Barclays | Maintain | Equal Weight | 2026-01-07 |
| UBS | Downgrade | Neutral | 2026-01-05 |
| Wells Fargo | Maintain | Equal Weight | 2025-12-18 |
| Wolfe Research | Upgrade | Outperform | 2025-12-09 |
| JP Morgan | Maintain | Overweight | 2025-11-06 |
Xylem Inc. Grades
The following table summarizes recent institutional grades for Xylem Inc.:
| Grading Company | Action | New Grade | Date |
|---|---|---|---|
| Barclays | Maintain | Overweight | 2026-01-07 |
| Mizuho | Maintain | Neutral | 2026-01-05 |
| TD Cowen | Maintain | Hold | 2025-12-05 |
| UBS | Maintain | Buy | 2025-11-06 |
| Stifel | Maintain | Buy | 2025-10-29 |
| Barclays | Maintain | Overweight | 2025-10-29 |
| RBC Capital | Maintain | Outperform | 2025-10-29 |
| Citigroup | Maintain | Buy | 2025-10-29 |
| Citigroup | Maintain | Buy | 2025-10-09 |
| Mizuho | Maintain | Neutral | 2025-09-12 |
Which company has the best grades?
Eaton Corporation has a mix of Buy and Overweight grades, including recent upgrades, but also a downgrade to Neutral. Xylem consistently receives Buy and Overweight ratings with no recent downgrades. Xylem’s steadier positive ratings may appeal to investors seeking stability in analyst sentiment.
Risks specific to each company
The following categories identify the critical pressure points and systemic threats facing both firms in the 2026 market environment:
1. Market & Competition
Eaton Corporation plc (ETN)
- Faces intense competition in diversified industrial sectors, requiring constant innovation to maintain market share.
Xylem Inc. (XYL)
- Operates in a niche water technology market but faces growing competition from emerging sustainable tech firms.
2. Capital Structure & Debt
Eaton Corporation plc (ETN)
- Moderate leverage with debt-to-assets at 25.5%, interest coverage strong at 19.5x, but debt-to-equity score is unfavorable.
Xylem Inc. (XYL)
- Lower leverage with debt-to-assets at 12.9%, strong interest coverage at 25.7x, and more conservative debt-to-equity profile.
3. Stock Volatility
Eaton Corporation plc (ETN)
- Beta of 1.18 indicates slightly higher volatility than market average, with range volatility from $232 to $400.
Xylem Inc. (XYL)
- Beta of 1.16 shows similar stock sensitivity to market swings, with a narrower price range from $100 to $154.
4. Regulatory & Legal
Eaton Corporation plc (ETN)
- Subject to global electrical and aerospace regulations, increasing compliance costs and legal exposure.
Xylem Inc. (XYL)
- Faces stringent environmental and water quality regulations, with potential risks from evolving water treatment standards.
5. Supply Chain & Operations
Eaton Corporation plc (ETN)
- Large global footprint with complex supply chains vulnerable to geopolitical disruptions and raw material price volatility.
Xylem Inc. (XYL)
- More focused supply chain but exposed to risks in manufacturing specialized water infrastructure components.
6. ESG & Climate Transition
Eaton Corporation plc (ETN)
- Faces pressure to improve energy efficiency and reduce carbon footprint across multiple industrial segments.
Xylem Inc. (XYL)
- Positioned as a water sustainability leader but must navigate evolving ESG standards and climate-related water scarcity risks.
7. Geopolitical Exposure
Eaton Corporation plc (ETN)
- High exposure to international markets including Europe and Asia, vulnerable to trade tensions and tariffs.
Xylem Inc. (XYL)
- Primarily US-based but with international operations, faces moderate geopolitical risks linked to global water policies.
Which company shows a better risk-adjusted profile?
Xylem’s lower leverage, stronger liquidity ratios, and focused market niche offer a more stable risk profile. Eaton’s broader industrial exposure and higher debt reflect greater cyclical and financial risks. Xylem’s robust Piotroski score (8) versus Eaton’s average (6) further supports its stronger financial resilience. However, Eaton’s favorable returns on equity and assets show operational strength but come with valuation and leverage concerns. The key risk for Eaton is its capital structure, while Xylem’s main challenge lies in regulatory and market competition pressures.
Final Verdict: Which stock to choose?
Eaton Corporation plc’s superpower lies in its robust value creation, consistently generating returns well above its cost of capital. Its growing profitability and strong operating metrics position it as a resilient cash machine. A point of vigilance remains its premium valuation multiples, which could challenge near-term entry points. Eaton suits portfolios chasing steady, aggressive growth grounded in operational excellence.
Xylem Inc. boasts a strategic moat built on solid balance sheet strength and improving profitability. Its lower leverage and superior liquidity offer a safer profile compared to Eaton. While its return metrics trail, Xylem’s recurring revenue and disciplined capital allocation appeal to investors seeking growth with reasonable margin of safety. It fits well within GARP (Growth at a Reasonable Price) portfolios.
If you prioritize durable value creation and high operational efficiency, Eaton outshines with superior returns on invested capital and accelerating momentum. However, if you seek a more stable balance sheet and moderate growth with less valuation risk, Xylem offers better stability and a compelling risk-adjusted profile. Both names present analytical scenarios suited for distinct investor archetypes.
Disclaimer: Investment carries a risk of loss of initial capital. The past performance is not a reliable indicator of future results. Be sure to understand risks before making an investment decision.
Go Further
I encourage you to read the complete analyses of Eaton Corporation plc and Xylem Inc. to enhance your investment decisions: