Home > Comparison > Industrials > ETN vs SYM
The strategic rivalry between Eaton Corporation plc and Symbotic Inc. shapes the industrial machinery sector’s evolution. Eaton, a diversified industrial giant, excels in power management and aerospace components, while Symbotic innovates with high-tech warehouse automation. This analysis contrasts Eaton’s capital-intensive breadth against Symbotic’s high-growth technology focus. I will identify which company’s trajectory offers superior risk-adjusted returns for diversified portfolios navigating industrial transformation.
Table of contents
Companies Overview
Eaton Corporation plc and Symbotic Inc. shape the future of industrial machinery through diverse innovation and market reach.
Eaton Corporation plc: Global Power Management Leader
Eaton dominates as a power management company with a broad product range from electrical components to aerospace systems. It generates revenue primarily through its Electrical, Aerospace, Vehicle, and eMobility segments. In 2026, Eaton strategically focuses on expanding power distribution and hybrid vehicle systems, leveraging its diversified industrial footprint.
Symbotic Inc.: Warehouse Automation Innovator
Symbotic stands out with its robotics-driven warehouse automation system tailored for U.S. retailers and wholesalers. Its core revenue engine is the Symbotic System, which enhances efficiency and reduces logistics costs. The company’s 2026 strategy centers on scaling its automation technology to capture more market share in supply chain optimization.
Strategic Collision: Similarities & Divergences
Eaton and Symbotic share a foundation in industrial machinery but differ sharply in approach. Eaton pursues a diversified product portfolio emphasizing power and mobility, while Symbotic bets on a focused, tech-driven warehouse automation niche. Their competition converges on operational efficiency, with Eaton leveraging scale and Symbotic banking on innovation. These distinct profiles cater to different investor appetites—stability versus growth potential.
Income Statement Comparison
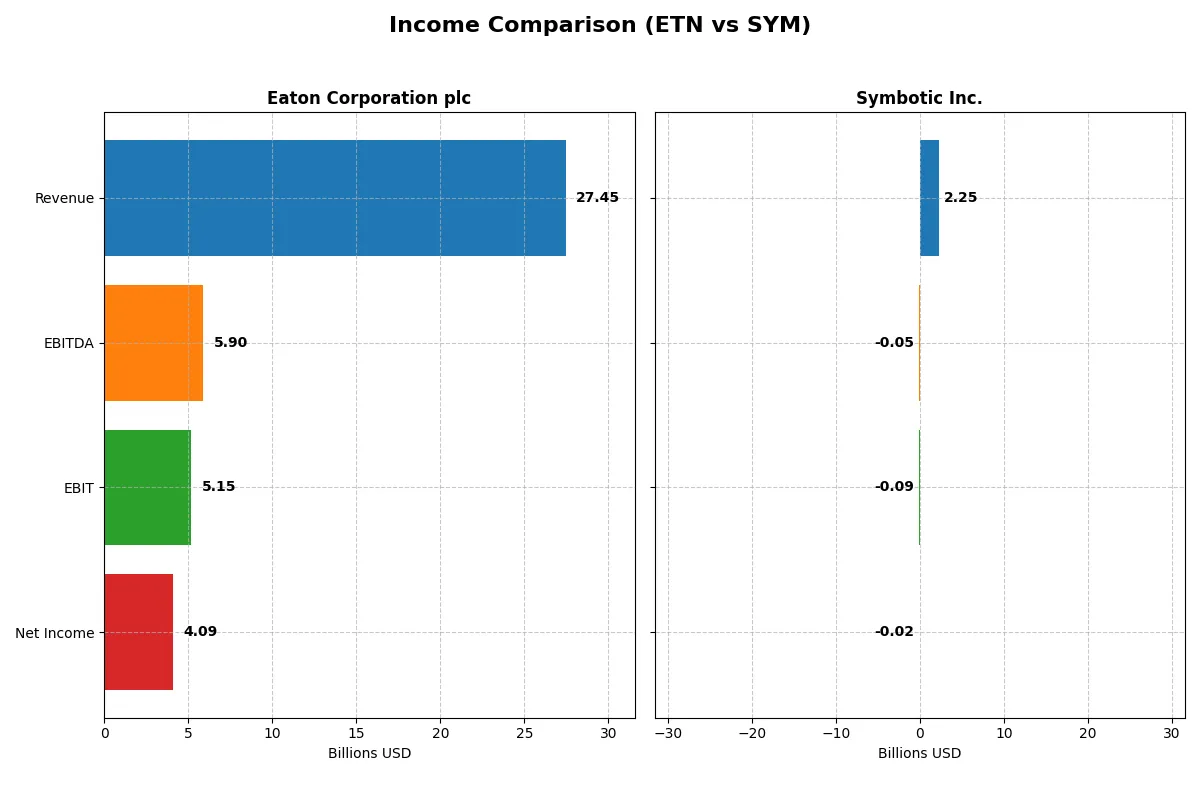
This data dissects the core profitability and scalability of both corporate engines to reveal who dominates the bottom line:
| Metric | Eaton Corporation plc (ETN) | Symbotic Inc. (SYM) |
|---|---|---|
| Revenue | 27.4B | 2.25B |
| Cost of Revenue | 17.1B | 1.82B |
| Operating Expenses | 5.08B | 538M |
| Gross Profit | 10.3B | 423M |
| EBITDA | 5.9B | -48M |
| EBIT | 5.15B | -92M |
| Interest Expense | 264M | 0 |
| Net Income | 4.09B | -17M |
| EPS | 10.49 | -0.16 |
| Fiscal Year | 2025 | 2025 |
Income Statement Analysis: The Bottom-Line Duel
This comparison reveals which company runs a more efficient and profitable operation through their latest income statement performance.
Eaton Corporation plc Analysis
Eaton’s revenue climbed steadily from 19.6B in 2021 to 27.4B in 2025, showing robust growth. Net income nearly doubled over five years, reaching 4.1B in 2025. Margins remain healthy with a gross margin of 37.6% and net margin near 15%. The company delivers strong EBITDA and EBIT growth, reflecting operational efficiency and consistent momentum.
Symbotic Inc. Analysis
Symbotic’s revenue surged from 251M in 2021 to 2.25B in 2025, a striking growth trajectory. However, it remains unprofitable with a net loss of 17M in 2025 despite improving gross margin to 18.8%. Operating losses persist, with a negative EBIT margin of -4.1%. The firm shows rapid top-line expansion but struggles to convert scale into profitability.
Margin Strength vs. Growth Ambition
Eaton dominates with solid profitability, delivering consistent margin expansion and strong net income growth. Symbotic impresses with explosive revenue growth but lags in profitability and margin health. Investors seeking stable, profitable cash flow may favor Eaton, while those pursuing aggressive growth might watch Symbotic’s path to sustainable earnings.
Financial Ratios Comparison
These vital ratios act as a diagnostic tool to expose the underlying fiscal health, valuation premiums, and capital efficiency of the companies compared below:
| Ratios | Eaton Corporation plc (ETN) | Symbotic Inc. (SYM) |
|---|---|---|
| ROE | 21.1% | -7.7% |
| ROIC | 13.1% | -16.6% |
| P/E | 30.2 | -334.5 |
| P/B | 6.37 | 25.60 |
| Current Ratio | 1.32 | 1.08 |
| Quick Ratio | 0.81 | 0.99 |
| D/E | 0.54 | 0.25 |
| Debt-to-Assets | 25.5% | 2.3% |
| Interest Coverage | 19.8 | 0 |
| Asset Turnover | 0.67 | 0.94 |
| Fixed Asset Turnover | 5.40 | 15.9 |
| Payout ratio | 39.5% | -6.9% |
| Dividend yield | 1.31% | 0.02% |
| Fiscal Year | 2025 | 2025 |
Efficiency & Valuation Duel: The Vital Signs
Financial ratios act as a company’s DNA, uncovering hidden risks and revealing operational excellence essential for investment decisions.
Eaton Corporation plc
Eaton posts a robust 21.05% ROE and a strong 14.9% net margin, signaling efficient profitability. Its P/E ratio at 30.24 appears stretched versus sector norms, reflecting premium valuation. Eaton balances growth and shareholder returns with a 1.31% dividend yield, supporting stable income alongside steady reinvestment in R&D.
Symbotic Inc.
Symbotic reports negative profitability metrics: -7.65% ROE and -0.75% net margin, highlighting operational struggles. Its P/E is negative, distorting valuation, and the P/B ratio at 25.6 signals overvaluation risk. Symbotic lacks meaningful dividends, focusing heavily on R&D and growth investments to build future capacity.
Premium Profitability Meets Growth Challenges
Eaton offers a more balanced profile with favorable profitability and moderate dividend income despite a high valuation. Symbotic’s metrics indicate elevated risk and a growth focus without current profitability. Investors seeking operational safety may prefer Eaton, while those targeting growth at the cost of near-term losses might consider Symbotic’s profile.
Which one offers the Superior Shareholder Reward?
I observe Eaton (ETN) balances dividends and buybacks, yielding ~1.3% with a sustainable ~39% payout ratio backed by steady FCF. Symbotic (SYM) barely pays dividends, focusing on aggressive reinvestment and modest buybacks, but posts negative margins. Eaton’s model offers more stable, attractive total returns in 2026.
Comparative Score Analysis: The Strategic Profile
The radar chart reveals the fundamental DNA and trade-offs of Eaton Corporation plc and Symbotic Inc., highlighting their distinct financial strengths and vulnerabilities:
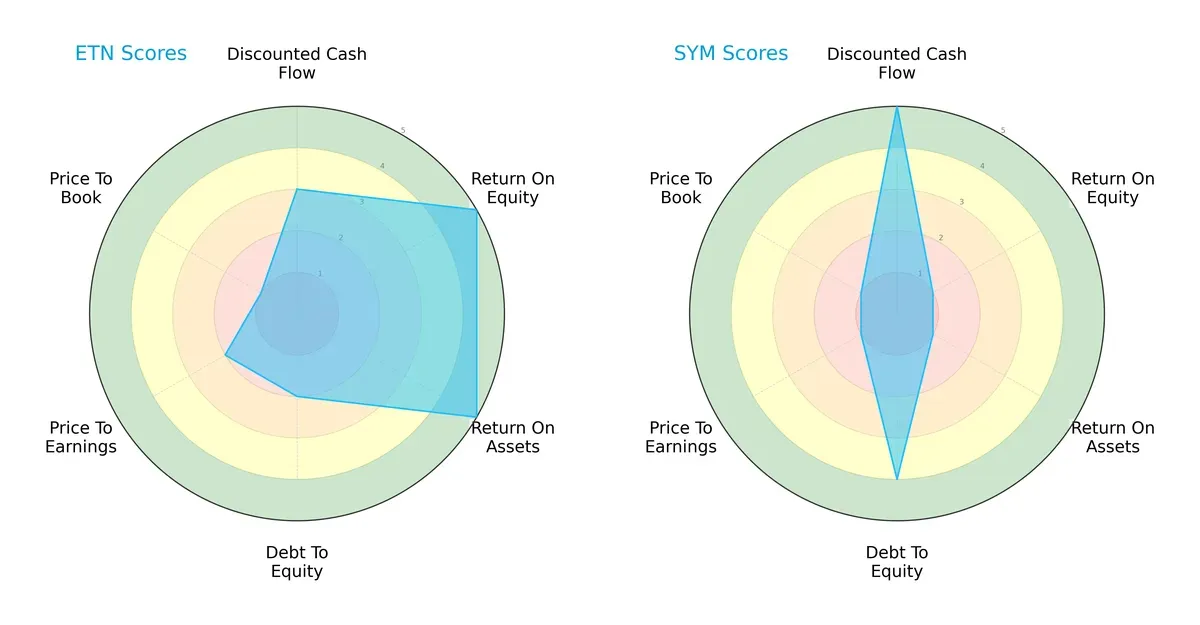
Eaton shows balanced strength in ROE and ROA, scoring very favorably at 5 each, while Symbotic lags at 1 in these areas. Symbotic excels in discounted cash flow with a top score of 5, signaling strong future cash flow potential. Eaton’s debt-to-equity and valuation metrics, however, are weak, indicating financial leverage and market pricing concerns, whereas Symbotic maintains better leverage but poor valuation scores. Eaton presents a more balanced profile; Symbotic relies heavily on cash flow optimism.
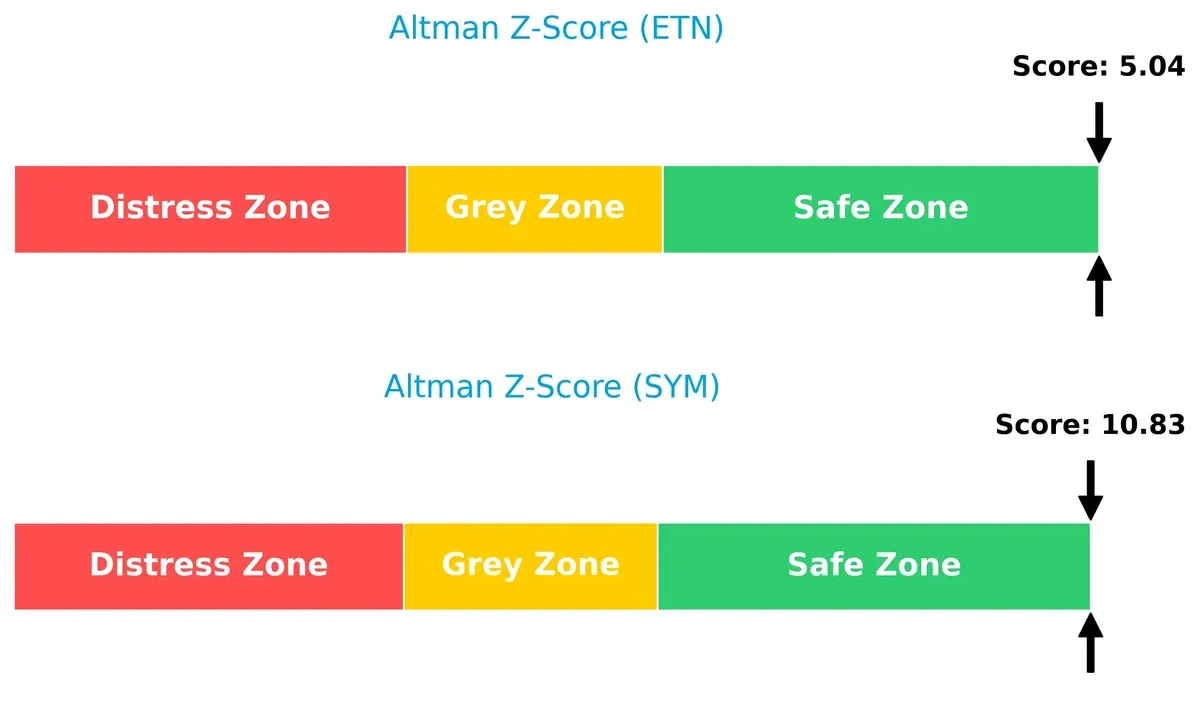
Bankruptcy Risk: Solvency Showdown
Eaton’s Altman Z-Score of 5.04 versus Symbotic’s 10.83 confirms both firms reside comfortably in the safe zone, but Symbotic’s superior score implies a stronger buffer against bankruptcy risk in this economic cycle:
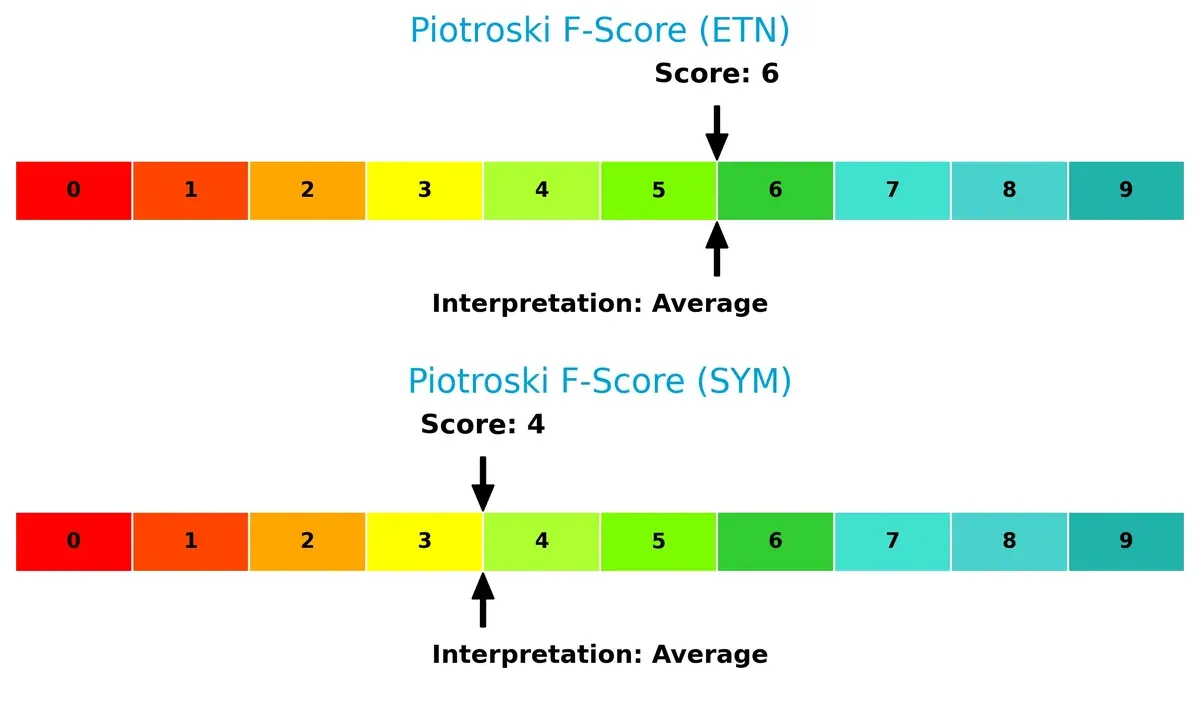
Financial Health: Quality of Operations
Eaton’s Piotroski F-Score of 6 outperforms Symbotic’s 4, indicating better overall financial health and operational quality. Symbotic’s lower score raises red flags about internal financial metrics compared to Eaton’s more stable footing:
How are the two companies positioned?
This section dissects the operational DNA of Eaton and Symbotic by comparing their revenue distribution and internal dynamics. The goal is to confront their economic moats to identify which model offers the most resilient, sustainable competitive advantage today.
Revenue Segmentation: The Strategic Mix
This visual comparison dissects how Eaton Corporation plc and Symbotic Inc. diversify their income streams and where their primary sector bets lie:
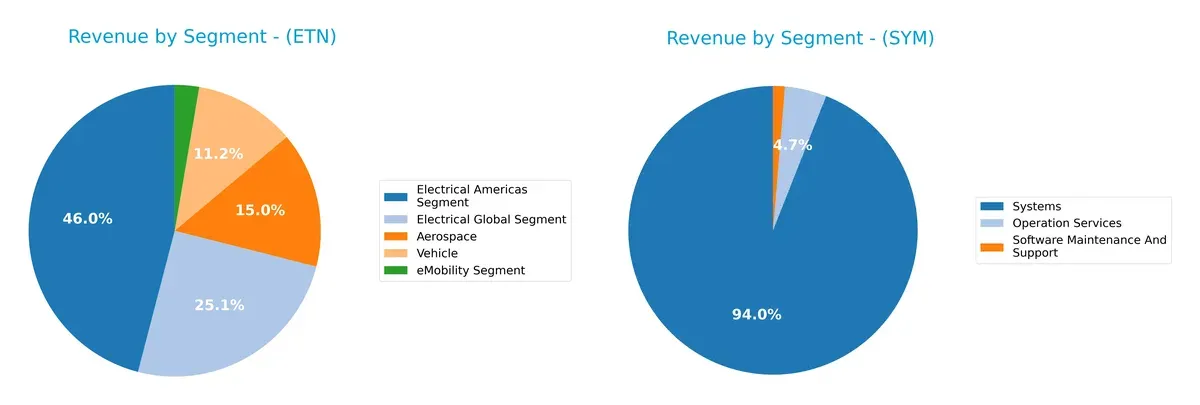
Eaton’s revenue spans multiple robust segments, with Electrical Americas anchoring at $11.4B and Electrical Global at $6.2B in 2024, showing a well-balanced industrial portfolio. Conversely, Symbotic pivots heavily on its Systems segment, generating $2.1B in 2025, dwarfing its smaller Operation Services and Software Maintenance lines. Eaton’s diversified mix reduces concentration risk, while Symbotic’s dominance in Systems signals strong ecosystem lock-in but higher exposure to segment-specific downturns.
Strengths and Weaknesses Comparison
This table compares the Strengths and Weaknesses of Eaton Corporation plc (ETN) and Symbotic Inc. (SYM):
ETN Strengths
- Diverse revenue across Aerospace, Electrical Americas/Global, Vehicle, eMobility segments
- Strong profitability with 14.9% net margin and 21.05% ROE
- Favorable debt-to-assets ratio at 25.53% and high interest coverage
- Significant global presence including US, Europe, Asia Pacific, Latin America
SYM Strengths
- Lean balance sheet with low debt-to-assets at 2.32%
- High fixed asset turnover at 15.92 indicating efficient asset use
- Neutral liquidity ratios close to 1
- Concentrated US market presence supporting focused operations
ETN Weaknesses
- Elevated price-to-earnings (30.24) and price-to-book (6.37) ratios may indicate overvaluation
- Moderate liquidity with quick ratio below 1
- Asset turnover at 0.67 is only neutral
- Dividend yield relatively low at 1.31%
SYM Weaknesses
- Negative profitability with -0.75% net margin and -7.65% ROE
- Unfavorable WACC at 13.75% and zero interest coverage signal financial stress
- High price-to-book at 25.6 suggests valuation risk
- Minimal dividend yield at 0.02%
ETN shows clear strengths in diversification, profitability, and global scale, supporting a balanced growth strategy. SYM’s strengths lie in asset efficiency and low leverage but face challenges with profitability and valuation, indicating potential operational risks.
The Moat Duel: Analyzing Competitive Defensibility
A structural moat is the only reliable defense against competitive erosion that protects long-term profits and shareholder value. Consider these two industrial firms:
Eaton Corporation plc: Diversified Industrial Powerhouse with Durable Operational Moat
Eaton’s moat stems from its vast portfolio of electrical and vehicle components, creating high switching costs and stable margins. Its ROIC exceeds WACC by 4.26%, showing efficient capital use and growing profitability through 2025. New eMobility products could further deepen Eaton’s moat in 2026.
Symbotic Inc.: Innovative Robotics with Emerging Efficiency Moat
Symbotic relies on robotics and automation technology, a cost advantage moat focused on operational efficiency. However, its negative ROIC trend signals value destruction. Despite rapid revenue growth, profitability lags, and 2026’s outlook depends on scaling automation adoption while managing rising opex.
Capital Efficiency vs. Innovation Scale: Who Holds the Moat Edge?
Eaton’s wide moat is proven by sustained ROIC above WACC and diversified global presence. Symbotic’s moat is narrow and fragile, hindered by declining profitability despite innovation. Eaton is clearly better positioned to defend market share amid intensifying competition.
Which stock offers better returns?
Over the past year, Eaton Corporation plc and Symbotic Inc. both showed strong price appreciation with distinct trading dynamics and acceleration patterns.
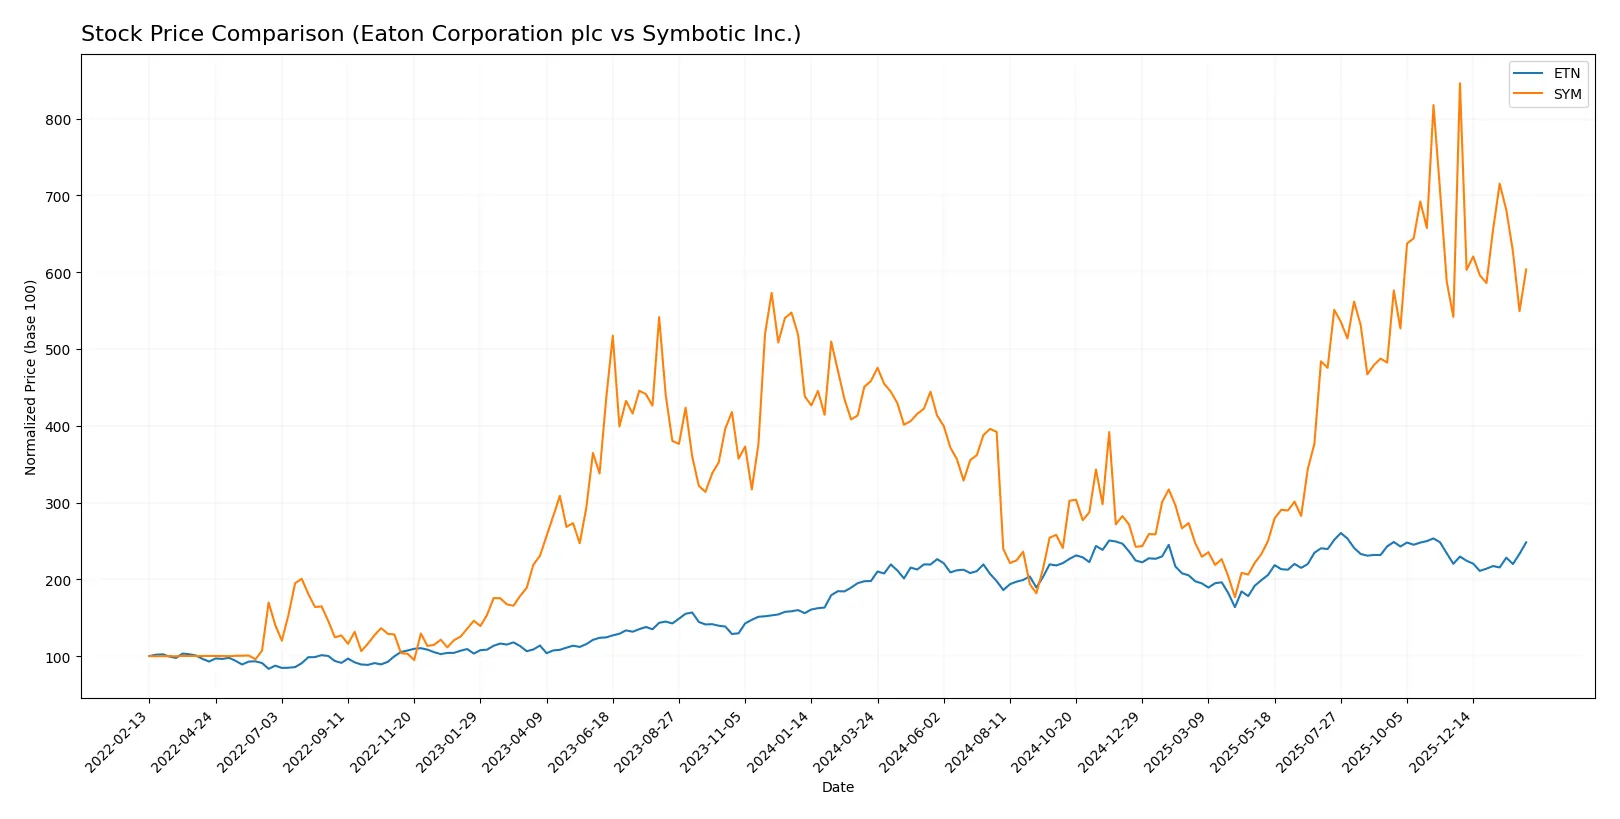
Trend Comparison
Eaton Corporation plc’s stock gained 25.49% over the past year, reflecting a bullish trend with price acceleration and a high volatility of 29.52%. The stock peaked at 392.17 and bottomed at 246.52.
Symbotic Inc. recorded a 31.7% price increase over the same period, also bullish but with decelerating momentum. Volatility was lower at 15.78%, with highs near 83.77 and lows around 17.5.
Symbotic outperformed Eaton in total percentage gain despite slower recent momentum, delivering the highest market performance over the past 12 months.
Target Prices
Analysts present a broadly optimistic outlook on Eaton Corporation plc and Symbotic Inc., reflecting confidence in their growth potential.
| Company | Target Low | Target High | Consensus |
|---|---|---|---|
| Eaton Corporation plc | 295 | 495 | 393.64 |
| Symbotic Inc. | 42 | 83 | 66.44 |
Eaton’s target consensus at $394 exceeds its current price of $374, implying upside potential. Symbotic’s $66 consensus also suggests room for gains from its $59 price, despite higher volatility.

Don’t Let Luck Decide Your Entry Point
Optimize your entry points with our advanced ProRealTime indicators. You’ll get efficient buy signals with precise price targets for maximum performance. Start outperforming now!
How do institutions grade them?
The following tables summarize recent institutional grades for Eaton Corporation plc and Symbotic Inc.:
Eaton Corporation plc Grades
This table presents the latest grades and actions from reputable financial institutions.
| Grading Company | Action | New Grade | Date |
|---|---|---|---|
| Wells Fargo | maintain | Equal Weight | 2026-02-04 |
| JP Morgan | maintain | Overweight | 2026-01-16 |
| HSBC | upgrade | Buy | 2026-01-16 |
| Morgan Stanley | maintain | Overweight | 2026-01-12 |
| Citigroup | maintain | Buy | 2026-01-12 |
| Barclays | maintain | Equal Weight | 2026-01-07 |
| UBS | downgrade | Neutral | 2026-01-05 |
| Wells Fargo | maintain | Equal Weight | 2025-12-18 |
| Wolfe Research | upgrade | Outperform | 2025-12-09 |
| JP Morgan | maintain | Overweight | 2025-11-06 |
Symbotic Inc. Grades
This table summarizes recent grades and rating changes from established financial firms.
| Grading Company | Action | New Grade | Date |
|---|---|---|---|
| Needham | maintain | Buy | 2026-02-05 |
| Barclays | maintain | Underweight | 2026-01-12 |
| Goldman Sachs | downgrade | Sell | 2025-12-02 |
| Barclays | maintain | Underweight | 2025-11-26 |
| Baird | maintain | Neutral | 2025-11-26 |
| Cantor Fitzgerald | maintain | Overweight | 2025-11-25 |
| Craig-Hallum | upgrade | Buy | 2025-11-25 |
| DA Davidson | maintain | Neutral | 2025-11-25 |
| Needham | maintain | Buy | 2025-11-25 |
| Northland Capital Markets | maintain | Outperform | 2025-11-25 |
Which company has the best grades?
Eaton Corporation plc holds generally stronger grades, including multiple Overweight and Buy ratings, with some upgrades to Outperform. Symbotic Inc. shows mixed ratings, including downgrades to Sell and Underweight. This divergence may affect investor confidence and portfolio positioning differently for each.
Risks specific to each company
The following categories identify the critical pressure points and systemic threats facing both firms in the 2026 market environment:
1. Market & Competition
Eaton Corporation plc (ETN)
- Established global industrial player with diversified segments faces moderate competition pressure.
Symbotic Inc. (SYM)
- Emerging robotics firm contends with high-tech rivals; market share still developing and volatile.
2. Capital Structure & Debt
Eaton Corporation plc (ETN)
- Moderate debt with favorable debt-to-assets (25.5%) and strong interest coverage (19.5x).
Symbotic Inc. (SYM)
- Low debt and debt-to-assets (2.3%) but zero interest coverage signals liquidity risk.
3. Stock Volatility
Eaton Corporation plc (ETN)
- Beta 1.18 suggests moderate sensitivity to market swings, typical for industrials.
Symbotic Inc. (SYM)
- High beta 2.14 indicates elevated stock volatility, increasing investment risk.
4. Regulatory & Legal
Eaton Corporation plc (ETN)
- Operates globally with exposure to industrial and aerospace regulations; risks manageable.
Symbotic Inc. (SYM)
- Focus on U.S. market with fewer regulatory layers but potential tech compliance challenges.
5. Supply Chain & Operations
Eaton Corporation plc (ETN)
- Complex global supply chains subject to geopolitical and raw material risks.
Symbotic Inc. (SYM)
- Automation focus reduces traditional supply chain risks but depends on tech component availability.
6. ESG & Climate Transition
Eaton Corporation plc (ETN)
- Long-standing sustainability initiatives but industrial footprint requires ongoing investment.
Symbotic Inc. (SYM)
- Innovative tech positioning offers ESG appeal, yet scale and impact remain to be proven.
7. Geopolitical Exposure
Eaton Corporation plc (ETN)
- Global operations expose ETN to currency and trade tensions, especially EU-US dynamics.
Symbotic Inc. (SYM)
- Primarily U.S.-based, less exposed but vulnerable to domestic policy shifts and trade barriers.
Which company shows a better risk-adjusted profile?
Eaton Corporation’s strongest risk lies in global supply chain complexity, while Symbotic’s critical risk is its financial instability and high stock volatility. ETN offers a more balanced risk-adjusted profile supported by solid financial metrics and operational scale. Symbotic’s elevated beta and negative profitability metrics highlight caution. Notably, ETN’s robust interest coverage contrasts sharply with SYM’s zero coverage, underscoring the liquidity concerns that justify my prudence.
Final Verdict: Which stock to choose?
Eaton Corporation plc’s superpower lies in its robust value creation and operational efficiency. It consistently generates returns well above its cost of capital, demonstrating a durable competitive moat. A point of vigilance is its relatively high valuation multiples, which could temper near-term upside. Eaton suits portfolios aiming for steady, long-term industrial growth.
Symbotic Inc. offers a strategic moat rooted in innovative automation and recurring revenue potential. However, it currently struggles with profitability and value destruction, reflecting a risky turnaround profile. Compared to Eaton, Symbotic provides a higher-risk, high-reward opportunity, fitting growth-oriented portfolios willing to tolerate volatility.
If you prioritize stable value creation and proven operational strength, Eaton outshines as the compelling choice due to its sustainable competitive advantage. However, if you seek aggressive growth and can stomach elevated financial risks, Symbotic offers superior upside potential through disruptive innovation. Both scenarios require careful risk management aligned with your investment horizon.
Disclaimer: Investment carries a risk of loss of initial capital. The past performance is not a reliable indicator of future results. Be sure to understand risks before making an investment decision.
Go Further
I encourage you to read the complete analyses of Eaton Corporation plc and Symbotic Inc. to enhance your investment decisions: