Home > Comparison > Industrials > ETN vs ROK
The strategic rivalry between Eaton Corporation plc and Rockwell Automation, Inc. shapes the future of the industrial machinery sector. Eaton operates as a diversified power management giant with broad global reach, while Rockwell specializes in high-margin industrial automation and digital transformation solutions. This analysis pits Eaton’s capital-intensive industrial model against Rockwell’s tech-driven approach to determine which offers superior risk-adjusted returns for a diversified portfolio.
Table of contents
Companies Overview
Eaton Corporation plc and Rockwell Automation, Inc. stand as pillars in the industrial machinery sector, shaping global power and automation markets.
Eaton Corporation plc: Power Management Leader
Eaton dominates the power management industry with diversified segments including Electrical, Aerospace, Vehicle, and eMobility. Its core revenue comes from electrical components, industrial parts, and vehicle systems. In 2026, Eaton sharpened its focus on expanding eMobility solutions and power distribution reliability worldwide.
Rockwell Automation, Inc.: Automation and Digital Transformation Pioneer
Rockwell Automation excels in industrial automation and digital solutions, generating revenue through Intelligent Devices, Software & Control, and Lifecycle Services. Its 2026 strategy emphasizes advancing digital twin technology, network security, and integrated automation to bolster operational efficiency across diverse industrial markets.
Strategic Collision: Similarities & Divergences
Both companies serve the industrial machinery sector but differ in approach. Eaton prioritizes hardware-driven power management with a broad product portfolio, while Rockwell leads in software-enabled automation and services. Their battleground lies in industrial digitalization and efficiency. Eaton offers a diversified physical asset base, whereas Rockwell presents a software-rich investment profile, appealing to distinct investor appetites.
Income Statement Comparison
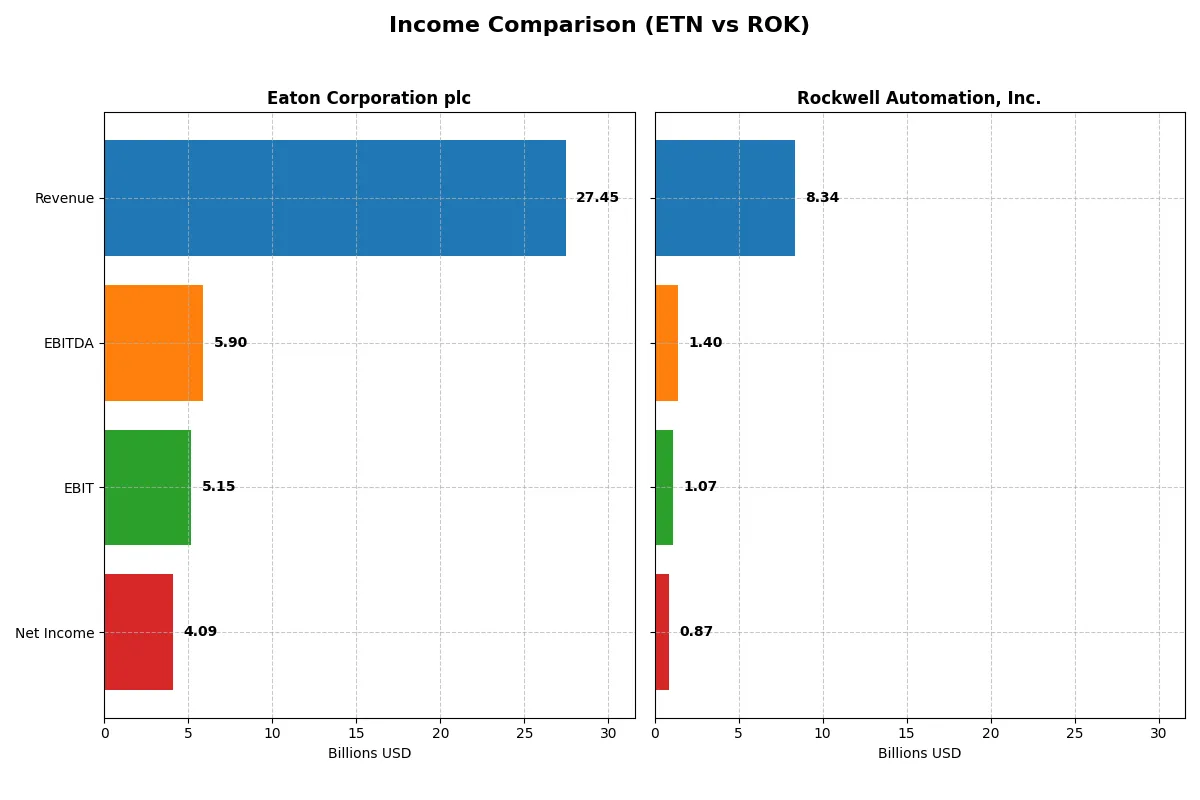
This table dissects the core profitability and scalability of Eaton Corporation plc and Rockwell Automation, Inc. to reveal who dominates the bottom line:
| Metric | Eaton Corporation plc (ETN) | Rockwell Automation, Inc. (ROK) |
|---|---|---|
| Revenue | 27.4B | 8.34B |
| Cost of Revenue | 17.1B | 4.33B |
| Operating Expenses | 5.08B | 2.59B |
| Gross Profit | 10.3B | 4.02B |
| EBITDA | 5.90B | 1.40B |
| EBIT | 5.15B | 1.07B |
| Interest Expense | 264M | 156M |
| Net Income | 4.09B | 869M |
| EPS | 10.49 | 7.69 |
| Fiscal Year | 2025 | 2025 |
Income Statement Analysis: The Bottom-Line Duel
The income statement comparison reveals which company drives higher efficiency and profitability through its core business operations.
Eaton Corporation plc Analysis
Eaton’s revenue rose steadily from 19.6B in 2021 to 27.4B in 2025, nearly doubling net income from 2.1B to 4.1B. Its gross margin hovers around a robust 37.6%, while net margin remains healthy near 14.9%. In 2025, Eaton showed strong momentum with a 10.3% revenue growth and expanding EBIT, signaling operational efficiency gains.
Rockwell Automation, Inc. Analysis
Rockwell’s revenue increased modestly from 7.0B in 2021 to 8.3B in 2025, but net income declined from 1.4B to 0.87B over the same period. The company maintains a higher gross margin at 48.1% but has a weaker net margin of 10.4%. Recent results show a stagnating top line and declining EBIT, reflecting pressure on profitability and operational challenges.
Verdict: Margin Power vs. Revenue Scale
Eaton dominates with stronger revenue growth, expanding net income, and solid margin improvement. Rockwell excels in gross margin but struggles with bottom-line contraction and slower growth. For investors prioritizing consistent profit growth and operational momentum, Eaton’s profile offers greater appeal in 2026.
Financial Ratios Comparison
These vital ratios act as a diagnostic tool to expose the underlying fiscal health, valuation premiums, and capital efficiency of the companies compared below:
| Ratios | Eaton Corporation plc (ETN) | Rockwell Automation, Inc. (ROK) |
|---|---|---|
| ROE | 21.1% | 23.8% |
| ROIC | 13.1% | 13.7% |
| P/E | 30.2 | 45.3 |
| P/B | 6.37 | 10.78 |
| Current Ratio | 1.32 | 1.14 |
| Quick Ratio | 0.81 | 0.77 |
| D/E | 0.54 | 1.00 |
| Debt-to-Assets | 25.5% | 32.5% |
| Interest Coverage | 19.8 | 9.1 |
| Asset Turnover | 0.67 | 0.74 |
| Fixed Asset Turnover | 5.40 | 6.95 |
| Payout ratio | 39.5% | 68.0% |
| Dividend yield | 1.31% | 1.50% |
| Fiscal Year | 2025 | 2025 |
Efficiency & Valuation Duel: The Vital Signs
Financial ratios act as a company’s DNA, revealing hidden risks and operational excellence that guide investors beyond surface-level metrics.
Eaton Corporation plc
Eaton delivers strong profitability with a 21.05% ROE and healthy 14.9% net margin, signaling efficient operations. Yet, its valuation appears stretched, marked by a 30.24 P/E and 6.37 P/B ratio. Eaton balances this by returning value through a modest 1.31% dividend yield, reflecting steady income for shareholders.
Rockwell Automation, Inc.
Rockwell posts a higher 23.78% ROE but a slimmer 10.42% net margin, indicating solid profitability with tighter cost control. Its valuation stretches further, with a lofty 45.33 P/E and 10.78 P/B, questioning price sustainability. Rockwell offers a slightly higher 1.5% dividend yield, maintaining shareholder returns amid growth investment.
Premium Valuation vs. Operational Safety
Eaton offers a better risk-reward balance with robust margins and reasonable leverage, despite a high multiple. Rockwell’s higher ROE comes with a more expensive valuation and weaker liquidity signals. Investors prioritizing operational stability may find Eaton’s profile more fitting, while those chasing growth might lean toward Rockwell’s premium stance.
Which one offers the Superior Shareholder Reward?
I compare Eaton Corporation plc (ETN) and Rockwell Automation, Inc. (ROK) on dividends and buybacks. ETN yields 1.3% with a 39.5% payout ratio, showing moderate dividend sustainability and steady free cash flow coverage. Its buyback program is less intense but consistent. ROK offers a slightly higher yield of 1.5% but a riskier 68% payout ratio, indicating less dividend safety. However, ROK’s aggressive buybacks, supported by strong free cash flow, amplify total returns. ETN’s balanced distribution is safer long term. I judge ROK’s higher buyback intensity and yield more rewarding but with elevated payout risk. For 2026, ROK offers superior total shareholder return potential, albeit with higher risk.
Comparative Score Analysis: The Strategic Profile
The radar chart reveals the fundamental DNA and trade-offs of Eaton Corporation plc and Rockwell Automation, Inc.:
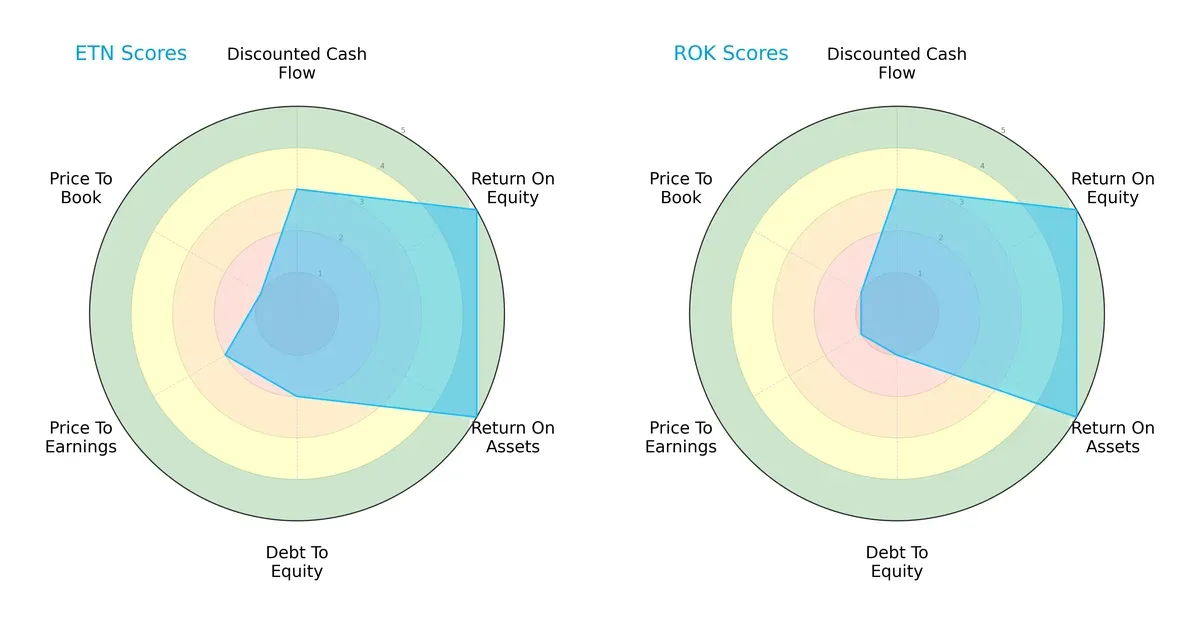
Both companies score equally high on ROE and ROA, demonstrating efficient profit generation and asset use. Eaton shows moderate DCF and overall scores but lags on debt-to-equity and valuation metrics. Rockwell matches Eaton on DCF and overall scores but fares worse on debt-to-equity and valuation, indicating higher financial risk. Eaton presents a more balanced profile, while Rockwell relies heavily on operational efficiency despite weaker leverage and valuation scores.
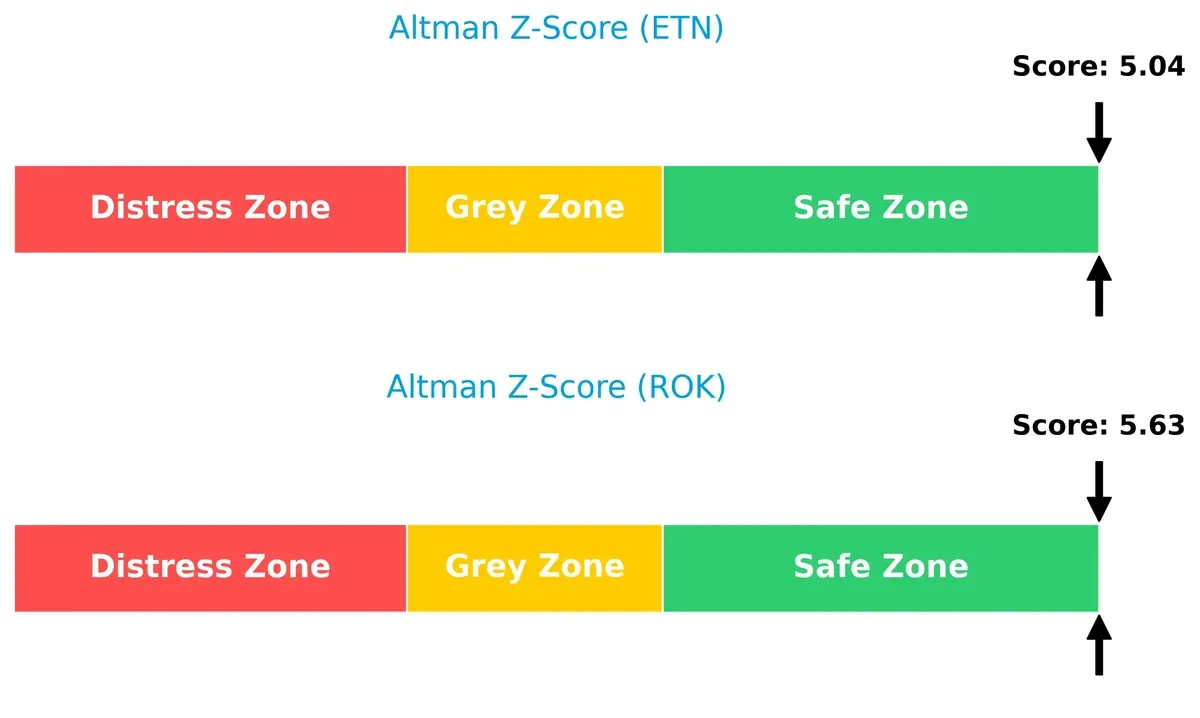
Bankruptcy Risk: Solvency Showdown
Rockwell Automation’s Altman Z-Score of 5.63 slightly surpasses Eaton’s 5.04, both safely above the distress threshold, signaling strong long-term survival prospects in this cycle:
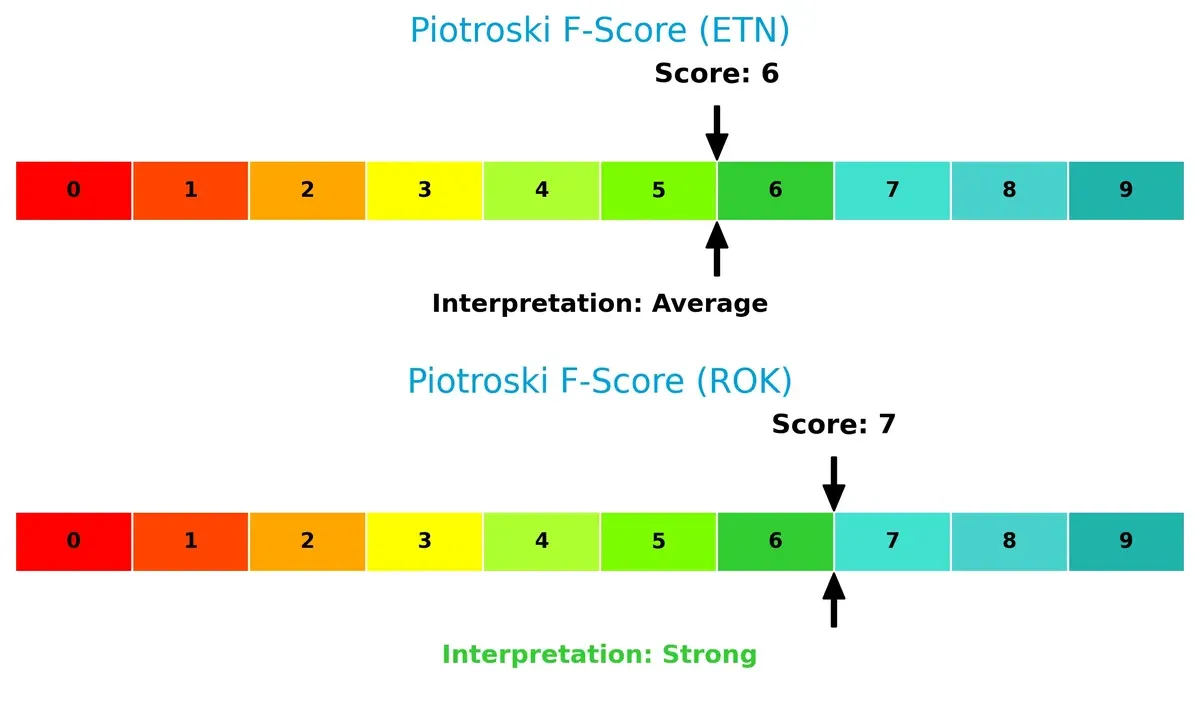
Financial Health: Quality of Operations
Rockwell Automation’s Piotroski F-Score of 7 outperforms Eaton’s 6, suggesting stronger internal financial health and operational quality. Eaton’s score, while decent, raises mild red flags compared to Rockwell’s more robust metrics:
How are the two companies positioned?
This section dissects the operational DNA of Eaton and Rockwell by comparing their revenue distribution and internal strengths and weaknesses. The goal is to confront their economic moats to identify which model offers the most resilient competitive advantage today.
Revenue Segmentation: The Strategic Mix
The following comparison dissects how Eaton Corporation plc and Rockwell Automation, Inc. diversify income streams and reveal where each places its primary sector bets:
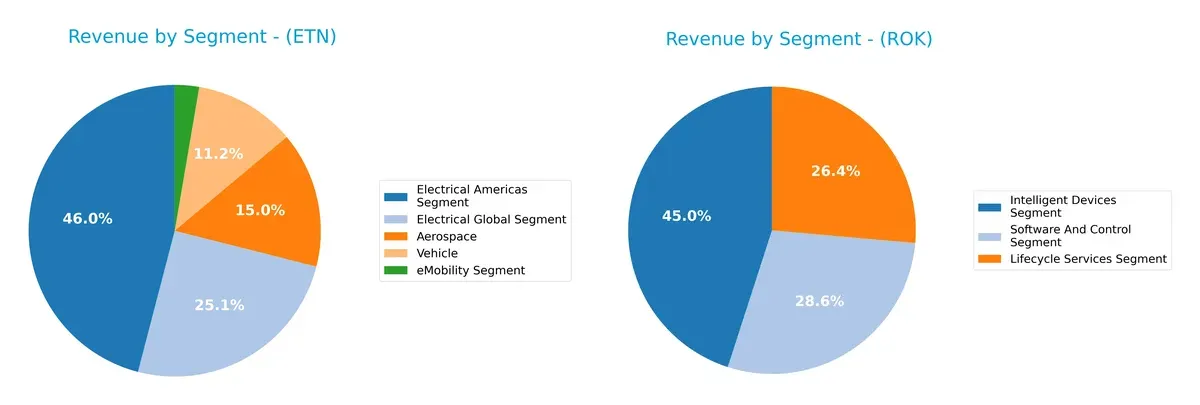
Eaton’s revenue anchors on Electrical Americas ($11.4B) and Electrical Global ($6.2B), with Aerospace ($3.7B) and Vehicle ($2.8B) segments adding balance. Rockwell leans on Intelligent Devices ($3.8B), Lifecycle Services ($2.3B), and Software and Control ($2.2B), forming a more balanced trio. Eaton’s concentration in electrical infrastructure signals deep ecosystem lock-in but raises reliance risks, while Rockwell’s diversified tech-service mix suggests adaptive resilience against sector shifts.
Strengths and Weaknesses Comparison
This table compares the Strengths and Weaknesses of Eaton Corporation plc and Rockwell Automation, Inc.:
Eaton Corporation plc Strengths
- Highly diversified with multiple segments including Aerospace and eMobility
- Strong profitability with 14.9% net margin and 21.05% ROE
- Favorable leverage with 25.53% debt-to-assets and high interest coverage
- Global presence spanning US, Europe, Asia Pacific, and Latin America
- Efficient fixed asset turnover at 5.4
Rockwell Automation, Inc. Strengths
- Solid profitability with 23.78% ROE and 13.71% ROIC
- Strong fixed asset turnover of 6.95
- Global footprint with significant North America and EMEA revenue
- Balanced segment revenues including Intelligent Devices and Software
- Maintains favorable interest coverage ratio of 6.88
Eaton Corporation plc Weaknesses
- Elevated valuation multiples: PE 30.24 and PB 6.37 are unfavorable
- Neutral liquidity ratios with quick ratio at 0.81 and current ratio 1.32
- Moderate asset turnover of 0.67 indicates room for efficiency gains
Rockwell Automation, Inc. Weaknesses
- Higher cost of capital: WACC at 10.45% unfavorable versus Eaton
- Elevated valuation multiples: PE 45.33 and PB 10.78 unfavorable
- Weak quick ratio at 0.77 signals liquidity risk
- Higher debt-to-assets at 32.51% compared to Eaton’s 25.53%
Eaton shows a broader diversification and more conservative financial structure, supporting operational stability. Rockwell excels in profitability metrics but faces challenges from higher leverage and valuation. Both companies’ strengths align with their strategic market positions, while weaknesses highlight areas for financial and operational vigilance.
The Moat Duel: Analyzing Competitive Defensibility
A structural moat is the only reliable shield protecting long-term profits from relentless competitive pressures. Let’s dissect Eaton versus Rockwell Automation:
Eaton Corporation plc: Diversified Operational Scale Moat
Eaton’s moat stems from a broad product portfolio and scale advantages. Its 4.26% ROIC premium over WACC signals efficient capital use and margin stability. Expanding eMobility solutions could deepen this moat in 2026.
Rockwell Automation, Inc.: Software-Driven Automation Moat
Rockwell’s moat relies on software integration and lifecycle services, contrasting Eaton’s hardware breadth. Despite a solid 3.26% ROIC premium, recent margin pressure warns of competitive challenges. Digital transformation efforts may unlock growth if executed well.
Scale and Software Integration: Who Holds the Competitive Edge?
Both companies sustain very favorable moats with growing ROIC trends. Eaton’s wider operational footprint and stronger recent income growth suggest a deeper moat. Eaton appears better positioned to defend and expand its market share amid evolving industrial demands.
Which stock offers better returns?
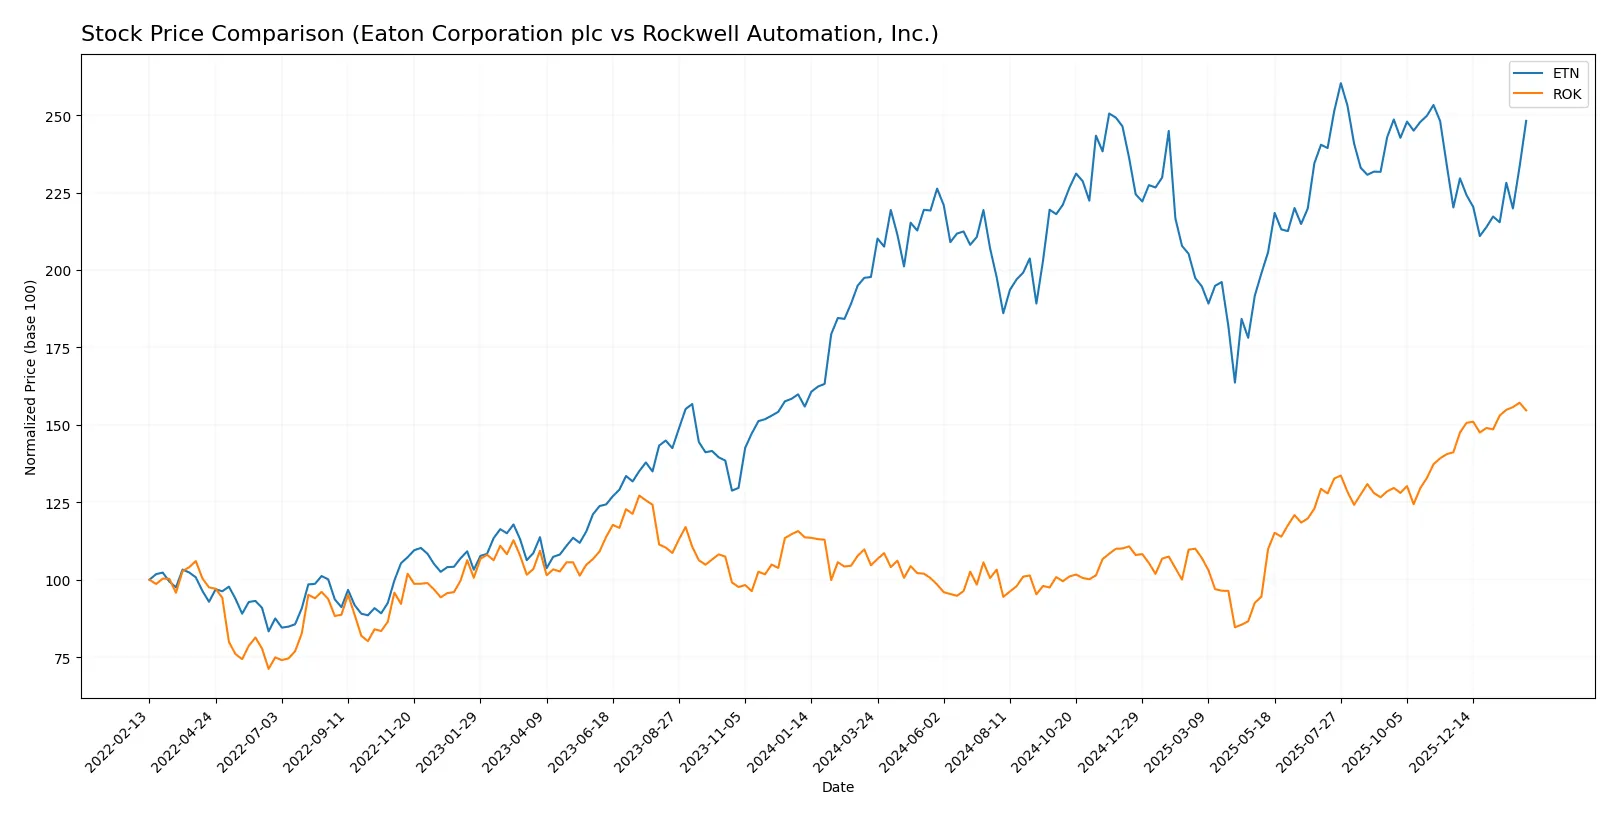
Over the past 12 months, Eaton Corporation and Rockwell Automation showed strong price appreciation, with distinct acceleration patterns and notable highs in their stock price movements.
Trend Comparison
Eaton Corporation’s stock price rose 25.49% over the past year, reflecting a bullish trend with accelerating momentum and a high volatility marked by a 29.52 standard deviation.
Rockwell Automation’s stock advanced 47.76% in the same period, also bullish with acceleration and higher volatility at 49.88 standard deviation, reaching a peak price above Eaton’s.
Rockwell Automation outperformed Eaton Corporation with stronger price gains and a higher acceleration rate, delivering the superior market performance over the past 12 months.
Target Prices
Analysts present a confident target price consensus for Eaton Corporation plc and Rockwell Automation, Inc.
| Company | Target Low | Target High | Consensus |
|---|---|---|---|
| Eaton Corporation plc | 295 | 495 | 393.64 |
| Rockwell Automation, Inc. | 391 | 470 | 433.63 |
The consensus targets for both companies exceed their current prices, reflecting analyst optimism. Eaton’s consensus target sits about 5% above its $373.82 price, while Rockwell’s target is roughly 4.5% above $415.02.

Don’t Let Luck Decide Your Entry Point
Optimize your entry points with our advanced ProRealTime indicators. You’ll get efficient buy signals with precise price targets for maximum performance. Start outperforming now!
How do institutions grade them?
The following tables summarize recent institutional grades for Eaton Corporation plc and Rockwell Automation, Inc.:
Eaton Corporation plc Grades
Here are the latest grades issued by leading financial institutions for Eaton:
| Grading Company | Action | New Grade | Date |
|---|---|---|---|
| Wells Fargo | Maintain | Equal Weight | 2026-02-04 |
| JP Morgan | Maintain | Overweight | 2026-01-16 |
| HSBC | Upgrade | Buy | 2026-01-16 |
| Morgan Stanley | Maintain | Overweight | 2026-01-12 |
| Citigroup | Maintain | Buy | 2026-01-12 |
| Barclays | Maintain | Equal Weight | 2026-01-07 |
| UBS | Downgrade | Neutral | 2026-01-05 |
| Wells Fargo | Maintain | Equal Weight | 2025-12-18 |
| Wolfe Research | Upgrade | Outperform | 2025-12-09 |
| JP Morgan | Maintain | Overweight | 2025-11-06 |
Rockwell Automation, Inc. Grades
Below are recent institutional grades for Rockwell Automation:
| Grading Company | Action | New Grade | Date |
|---|---|---|---|
| Mizuho | Maintain | Neutral | 2026-02-06 |
| Oppenheimer | Downgrade | Perform | 2026-01-20 |
| JP Morgan | Maintain | Neutral | 2026-01-16 |
| Morgan Stanley | Maintain | Overweight | 2026-01-13 |
| Barclays | Maintain | Overweight | 2026-01-07 |
| Wells Fargo | Maintain | Equal Weight | 2026-01-07 |
| Goldman Sachs | Upgrade | Neutral | 2025-12-16 |
| Jefferies | Maintain | Buy | 2025-12-10 |
| Citigroup | Maintain | Buy | 2025-12-08 |
| Barclays | Maintain | Overweight | 2025-12-04 |
Which company has the best grades?
Eaton generally earns stronger grades, including upgrades to Buy and Outperform, compared to Rockwell’s more neutral to overweight ratings. Investors may perceive Eaton as having more positive momentum.
Risks specific to each company
The following categories identify critical pressure points and systemic threats facing Eaton Corporation plc and Rockwell Automation, Inc. in the 2026 market environment:
1. Market & Competition
Eaton Corporation plc
- Operates in broad power management and vehicle sectors with diverse products, facing intense industrial machinery competition.
Rockwell Automation, Inc.
- Focuses on industrial automation and digital transformation, competing in niche high-tech markets with strong software emphasis.
2. Capital Structure & Debt
Eaton Corporation plc
- Debt-to-assets favorable at 25.53%, interest coverage strong at 19.5x; moderate leverage.
Rockwell Automation, Inc.
- Higher leverage with debt-to-assets at 32.51%, interest coverage lower at 6.88x; elevated financial risk.
3. Stock Volatility
Eaton Corporation plc
- Beta of 1.18 indicates moderate volatility, more stable relative to market.
Rockwell Automation, Inc.
- Beta of 1.527 signals higher volatility, more sensitive to market swings.
4. Regulatory & Legal
Eaton Corporation plc
- Exposed to global electrical and vehicle safety regulations; potential aerospace compliance costs.
Rockwell Automation, Inc.
- Faces regulations on software, cybersecurity, and industrial safety with increasing compliance complexity.
5. Supply Chain & Operations
Eaton Corporation plc
- Large global footprint with complex supply chains for varied components; risk from raw material price swings.
Rockwell Automation, Inc.
- Supply chain concentrated on tech components; risk in semiconductor shortages and software deployment delays.
6. ESG & Climate Transition
Eaton Corporation plc
- Power management focus aligns with climate solutions; pressure to enhance sustainability disclosures.
Rockwell Automation, Inc.
- Digital and automation solutions support energy efficiency; faces scrutiny on data privacy and ethical AI use.
7. Geopolitical Exposure
Eaton Corporation plc
- Global operations headquartered in Ireland; exposure to EU regulations and trade tensions.
Rockwell Automation, Inc.
- US-based with international markets; vulnerable to US-China trade conflicts and export controls.
Which company shows a better risk-adjusted profile?
Eaton’s strongest risk lies in market competition across diverse sectors, while Rockwell’s financial leverage poses a significant concern. Eaton displays a more balanced risk profile with lower volatility and debt burden. Rockwell’s higher beta and debt heighten its risk, despite strong operational focus. The recent interest coverage disparity underlines Eaton’s superior financial cushioning.
Final Verdict: Which stock to choose?
Eaton Corporation’s superpower lies in its consistent value creation, reflected by a robust and growing ROIC well above its cost of capital. Its disciplined capital allocation fuels steady profitability and cash flow generation. The point of vigilance remains its relatively rich valuation multiples, which could challenge entry timing. Eaton fits well in an Aggressive Growth portfolio seeking durable industrial strength.
Rockwell Automation’s strategic moat centers on its software-driven automation solutions with high recurring revenue and strong operational returns. It offers a narrower but defensible niche, balancing growth with resilience. Compared to Eaton, Rockwell appears less volatile but carries a higher debt load, making it a fit for Growth at a Reasonable Price (GARP) investors focused on innovation and stability.
If you prioritize sustainable value creation and industrial scale, Eaton outshines with superior capital efficiency and a clearer growth trajectory. However, if you seek technology-driven growth with a focus on operational niche and somewhat better safety, Rockwell offers a compelling alternative despite valuation and leverage concerns. Both present distinct scenarios tailored to different investor risk appetites and strategic focuses.
Disclaimer: Investment carries a risk of loss of initial capital. The past performance is not a reliable indicator of future results. Be sure to understand risks before making an investment decision.
Go Further
I encourage you to read the complete analyses of Eaton Corporation plc and Rockwell Automation, Inc. to enhance your investment decisions: