Home > Comparison > Industrials > ETN vs PNR
The strategic rivalry between Eaton Corporation plc and Pentair plc shapes the Industrials sector’s Machinery industry landscape. Eaton operates as a diversified power management powerhouse with broad industrial and aerospace segments. Pentair focuses on specialized water solutions with strong consumer and industrial flow technologies. This analysis pits Eaton’s scale against Pentair’s niche expertise to identify the superior risk-adjusted investment opportunity for a balanced portfolio.
Table of contents
Companies Overview
Eaton Corporation and Pentair are key industrial machinery players shaping power and water solutions markets globally.
Eaton Corporation plc: Global Power Management Leader
Eaton dominates the power management sector with a diverse product portfolio including electrical components, aerospace systems, and vehicle power solutions. Its revenue stems from delivering industrial, residential, and commercial power distribution and connectivity products. In 2026, Eaton sharpened its strategic focus on expanding eMobility and aerospace segments, enhancing innovation in hybrid and electric vehicle technologies.
Pentair plc: Water Solutions Specialist
Pentair focuses on water treatment and fluid management through consumer and industrial segments. It earns revenue from manufacturing pool equipment, filtration systems, and advanced membrane technologies for residential and commercial use. In 2026, Pentair prioritized product innovation and sustainability in water filtration and wastewater management, strengthening its footprint in residential and municipal water solutions.
Strategic Collision: Similarities & Divergences
Both companies operate in industrial machinery but diverge in core philosophies: Eaton pursues a broad power management ecosystem while Pentair specializes in targeted water solutions. Their primary market battle unfolds in industrial infrastructure, where power and water systems intersect. Eaton’s large-scale diversification contrasts with Pentair’s niche focus, defining distinct risk and growth profiles for investors.
Income Statement Comparison
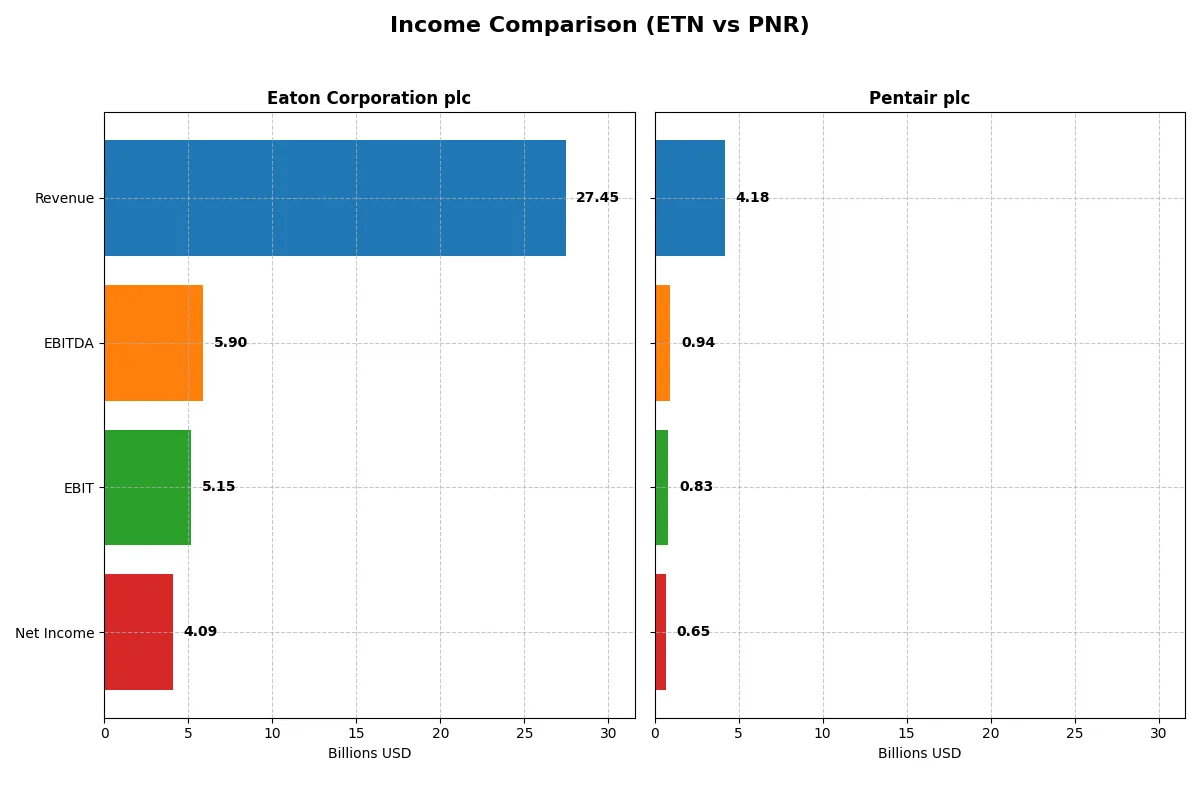
This data dissects the core profitability and scalability of both corporate engines to reveal who dominates the bottom line:
| Metric | Eaton Corporation plc (ETN) | Pentair plc (PNR) |
|---|---|---|
| Revenue | 27.4B | 4.18B |
| Cost of Revenue | 17.1B | 2.49B |
| Operating Expenses | 5.08B | 833M |
| Gross Profit | 10.3B | 1.69B |
| EBITDA | 5.90B | 944M |
| EBIT | 5.15B | 826M |
| Interest Expense | 264M | 69M |
| Net Income | 4.09B | 654M |
| EPS | 10.49 | 3.99 |
| Fiscal Year | 2025 | 2025 |
Income Statement Analysis: The Bottom-Line Duel
The following income statement comparison reveals which company operates with greater efficiency and delivers superior profitability over recent years.
Eaton Corporation plc Analysis
Eaton’s revenue climbed steadily from 19.6B in 2021 to 27.4B in 2025, with net income surging 90% over this period to 4.1B. Its gross margin remains strong at 37.6%, and it maintains a solid net margin near 15%. In 2025, Eaton boosted operating profit efficiently, reflecting robust momentum and expanding scale.
Pentair plc Analysis
Pentair’s revenue growth is more modest, rising 10.9% since 2021 to 4.2B in 2025, with net income growing 18% to 650M. It enjoys a higher gross margin of 40.5% and a slightly better net margin of 15.7%. However, Pentair’s latest revenue growth slowed to 2.3%, indicating a less dynamic top-line compared to Eaton.
Scale and Margin Strength: Eaton’s Momentum vs. Pentair’s Efficiency
Eaton dominates in absolute scale and net income growth, reflecting superior operational leverage and expanding profitability. Pentair holds a marginal edge in margin percentages but lags significantly in revenue and earnings growth. Investors seeking robust growth and scale may favor Eaton’s profile, while those prioritizing margin efficiency might lean toward Pentair’s steadier, albeit slower, expansion.
Financial Ratios Comparison
These vital ratios act as a diagnostic tool to expose the underlying fiscal health, valuation premiums, and capital efficiency of these companies:
| Ratios | Eaton Corporation plc (ETN) | Pentair plc (PNR) |
|---|---|---|
| ROE | 21.1% | 16.9% |
| ROIC | 13.1% | 12.5% |
| P/E | 30.2 | 26.1 |
| P/B | 6.37 | 4.42 |
| Current Ratio | 1.32 | 1.61 |
| Quick Ratio | 0.81 | 0.95 |
| D/E (Debt to Equity) | 0.54 | 0.42 |
| Debt-to-Assets | 25.5% | 23.9% |
| Interest Coverage | 19.8 | 12.4 |
| Asset Turnover | 0.67 | 0.61 |
| Fixed Asset Turnover | 5.40 | 11.1 |
| Payout Ratio | 39.5% | 25.1% |
| Dividend Yield | 1.31% | 0.96% |
| Fiscal Year | 2025 | 2025 |
Efficiency & Valuation Duel: The Vital Signs
Financial ratios act as a company’s DNA, revealing hidden risks and operational excellence behind headline figures.
Eaton Corporation plc
Eaton demonstrates strong profitability with a 21.05% ROE and a favorable 14.9% net margin, reflecting operational efficiency. Its valuation looks stretched, trading at a high P/E of 30.24 and P/B of 6.37, above sector averages. Eaton returns value to shareholders through a modest 1.31% dividend yield, balancing income with reinvestment in R&D.
Pentair plc
Pentair posts a solid 16.9% ROE and a slightly higher 15.66% net margin, showing effective profit generation. Its valuation is more moderate with a P/E of 26.14 and P/B of 4.42, still elevated but less stretched than Eaton. Dividend yield trails at 0.96%, indicating a stronger focus on growth and operational reinvestment over income distribution.
Premium Valuation vs. Operational Safety
Eaton trades at a premium with higher profitability but increased valuation risk. Pentair offers a better balance, combining solid margins with a more conservative valuation. Investors favoring stability and moderate growth may lean toward Pentair’s profile, while those targeting growth at a premium might consider Eaton’s operational efficiency.
Which one offers the Superior Shareholder Reward?
I compare Eaton Corporation plc (ETN) and Pentair plc (PNR) on their shareholder reward strategies. Eaton pays a higher dividend yield around 1.3% with a payout ratio near 40%, supported by strong free cash flow. Eaton also runs a significant share buyback program, enhancing total returns. Pentair offers a lower dividend yield near 0.9%, with a conservative payout ratio around 25%, preserving cash for growth investments. Pentair’s buyback intensity is moderate but consistent. I see Eaton’s balanced mix of dividends and buybacks as more sustainable and rewarding, given its robust cash flow and coverage ratios. In 2026, Eaton offers a more attractive total return profile for investors seeking income and capital appreciation.
Comparative Score Analysis: The Strategic Profile
The radar chart reveals the fundamental DNA and trade-offs of Eaton Corporation plc and Pentair plc, highlighting their financial strengths and valuation nuances:
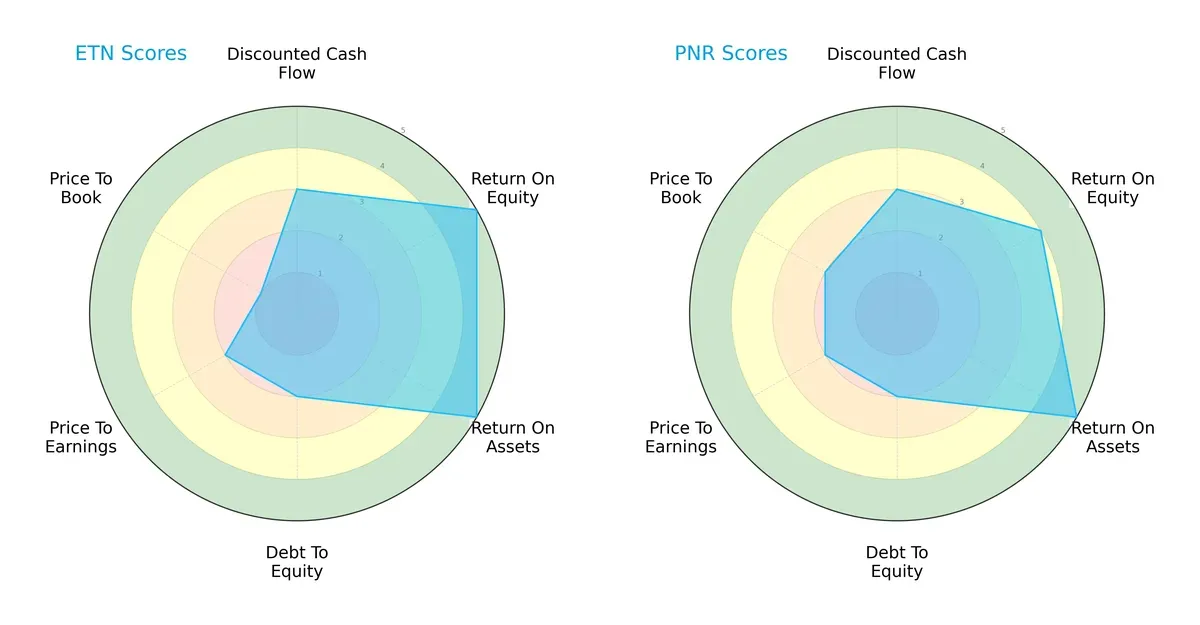
Eaton leads with stronger profitability metrics, scoring a 5 in both ROE and ROA, indicating superior capital and asset efficiency. Pentair trails slightly in ROE with a 4 but matches Eaton in ROA at 5. Both firms show moderate discounted cash flow scores of 3. Debt-to-equity scores are identical at 2, signaling similar leverage risks. Valuation scores expose Eaton’s vulnerability with very unfavorable price-to-book at 1, while Pentair fares better at 2. Overall, Eaton relies on operational excellence, while Pentair presents a more balanced valuation profile.
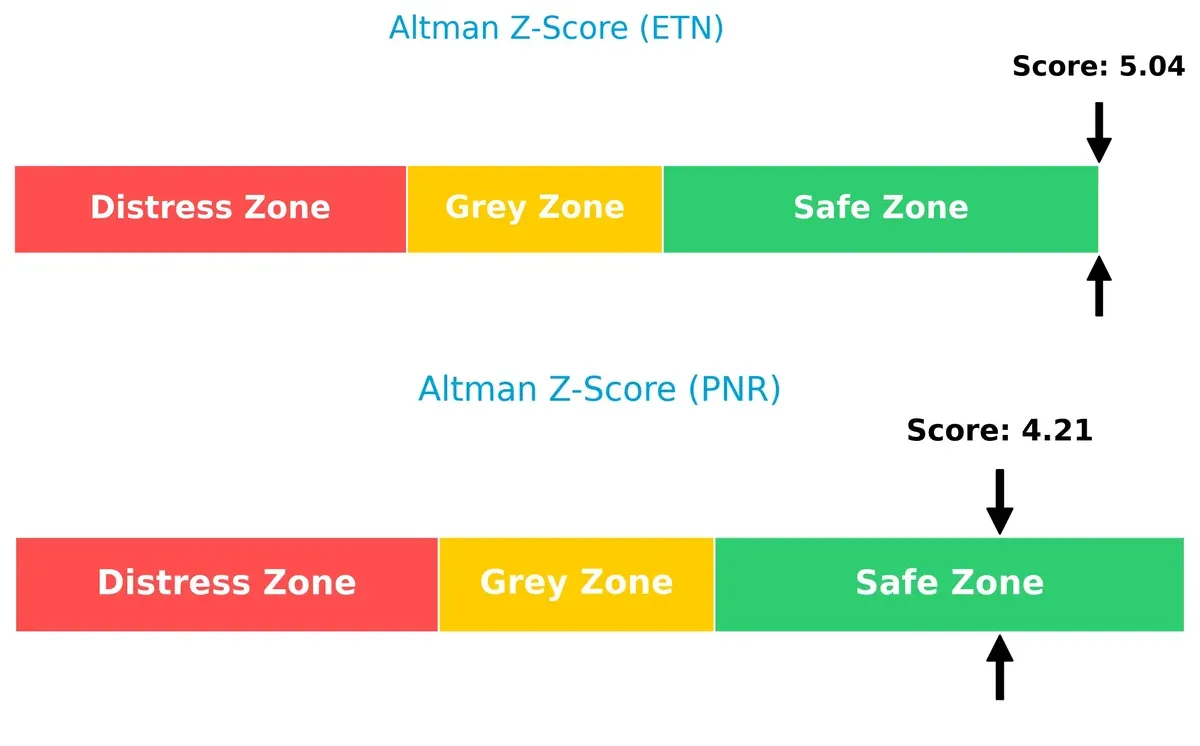
Bankruptcy Risk: Solvency Showdown
Eaton’s Altman Z-Score of 5.04 comfortably surpasses Pentair’s 4.21, placing both firmly in the safe zone. This difference confirms Eaton’s marginally stronger solvency and resilience against bankruptcy risks in the current economic cycle:
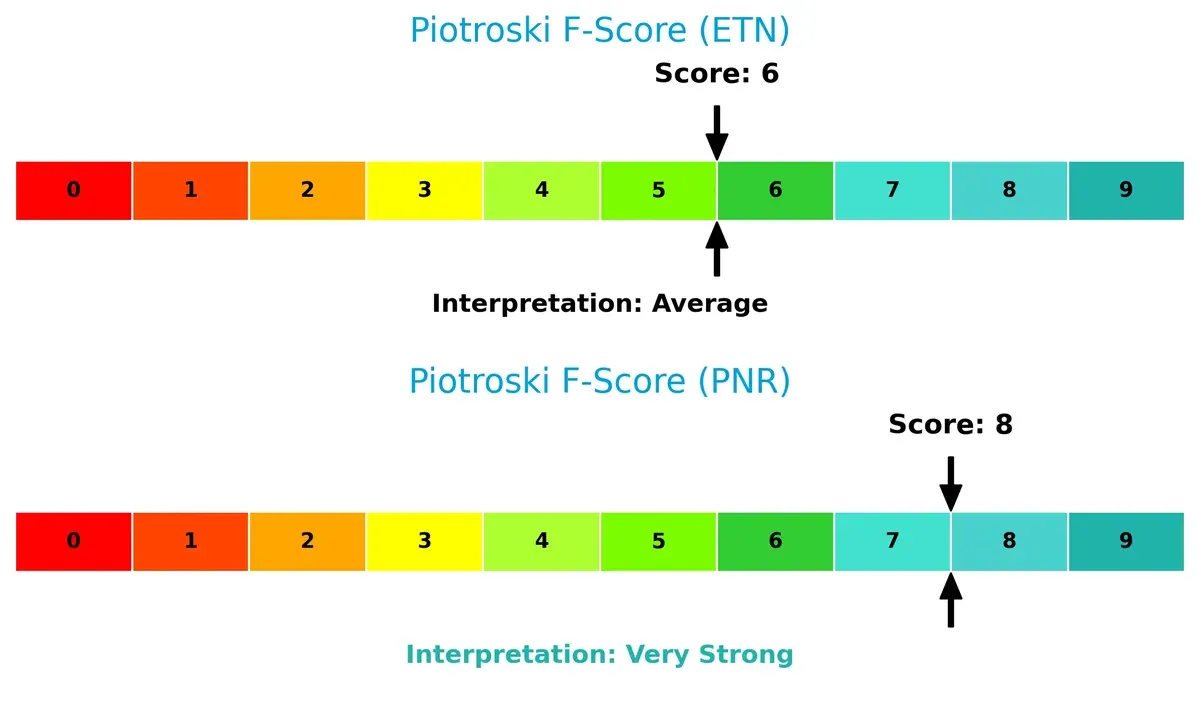
Financial Health: Quality of Operations
Pentair’s Piotroski F-Score of 8 signals very strong financial health, outperforming Eaton’s average score of 6. Pentair exhibits superior internal metrics, reducing red flags in profitability and efficiency compared to Eaton:
How are the two companies positioned?
This section dissects Eaton’s and Pentair’s operational DNA by comparing revenue distribution and internal strengths and weaknesses. The aim is to confront their economic moats and reveal which model offers the most resilient competitive advantage today.
Revenue Segmentation: The Strategic Mix
This visual comparison dissects how Eaton Corporation plc and Pentair plc diversify their income streams and reveals where their primary sector bets lie:
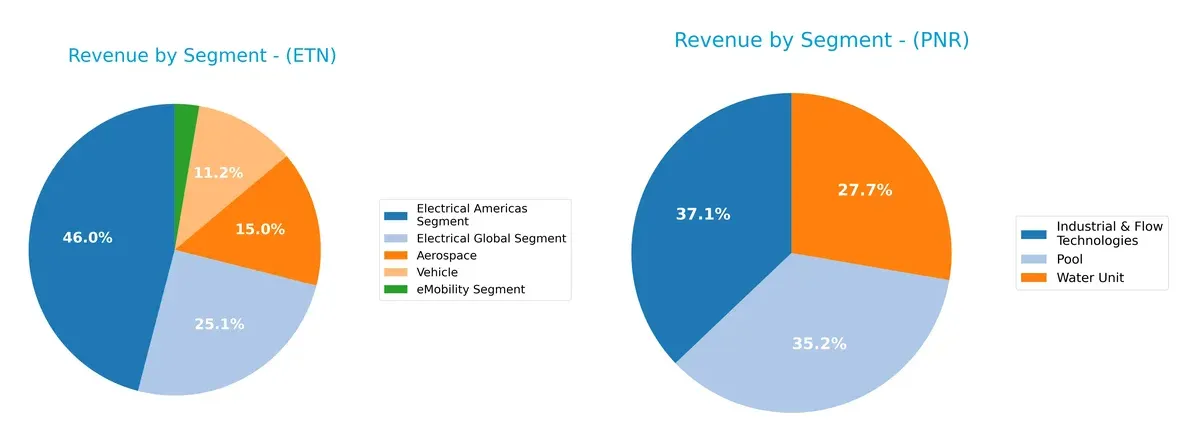
Eaton leans heavily on its Electrical Americas Segment, which dwarfs its other divisions at $11.4B in 2024, anchoring its revenue mix. Meanwhile, Pentair splits revenue more evenly across Industrial & Flow Technologies ($1.5B), Pool ($1.4B), and Water Unit ($1.1B), reflecting a balanced portfolio. Eaton’s concentration signals infrastructure dominance but raises concentration risk. Pentair’s diversified mix offers resilience amid sector cycles and market shifts.
Strengths and Weaknesses Comparison
This table compares the Strengths and Weaknesses of Eaton Corporation plc and Pentair plc:
Eaton Strengths
- Diversified across Aerospace, Electrical Americas & Global, Vehicle, eMobility segments
- Strong profitability with ROE 21% and ROIC 13% above WACC
- Favorable debt-to-assets at 25.5% and high interest coverage ratio
- Large global footprint with significant US and Europe presence
- High fixed asset turnover indicating efficient asset use
Pentair Strengths
- Favorable net margin and ROIC near Eaton’s level
- Strong current ratio and lower debt-to-equity ratio than Eaton
- Higher fixed asset turnover (11.1) signaling asset efficiency
- Clear geographic focus with growing US and developing markets footprint
- Favorable overall ratio profile with 57% favorable metrics
Eaton Weaknesses
- Unfavorable valuation multiples with PE at 30.2 and PB at 6.4
- Neutral liquidity ratios with quick ratio below 1
- Asset turnover slightly lower than Pentair’s
- Dividend yield moderate and valuation may imply overpricing
- Moderate reliance on US market (largest revenue segment)
Pentair Weaknesses
- Unfavorable valuation multiples though lower than Eaton’s PE and PB
- Dividend yield below 1%, rated unfavorable
- Interest coverage lower than Eaton though still favorable
- Less diversified product segmentation compared to Eaton
- Higher percentage of unfavorable financial ratios (21%)
Eaton’s diverse product and geographic mix supports a stable profit base but its high valuation multiples suggest caution. Pentair’s stronger liquidity and asset efficiency contrast with narrower product diversity and weaker dividend yield. Both companies show strengths in profitability and global reach, but face valuation and liquidity challenges that may influence strategic focus.
The Moat Duel: Analyzing Competitive Defensibility
A structural moat is the only shield preserving long-term profits from relentless competitive pressures in industrial sectors:
Eaton Corporation plc: Diverse Industrial Moat with Growing ROIC
Eaton leverages a broad moat rooted in scale and product diversity across electrical, aerospace, and vehicle segments. Its 4.3% ROIC premium over WACC signals efficient capital use and margin stability. Expansion into eMobility in 2026 could deepen this moat by capturing emerging hybrid systems demand.
Pentair plc: Specialized Water Solutions Moat Facing Profitability Challenges
Pentair’s moat centers on niche water treatment and filtration technologies, contrasting Eaton’s scale. Despite positive spreads over WACC, its declining ROIC trend reflects margin pressure. Growth hinges on innovation and further penetration in developing markets, but profitability erosion clouds its moat’s durability.
Scale & Diversification vs. Niche Specialization: Eaton’s Moat Holds Stronger
Eaton’s expanding ROIC and product breadth create a wider, more resilient moat than Pentair’s narrower focus and weakening profitability. Eaton stands better poised to defend market share and sustain excess returns in 2026 and beyond.
Which stock offers better returns?
Over the past 12 months, both Eaton Corporation plc and Pentair plc showed significant price movements, with contrasting recent trading dynamics and volume trends.
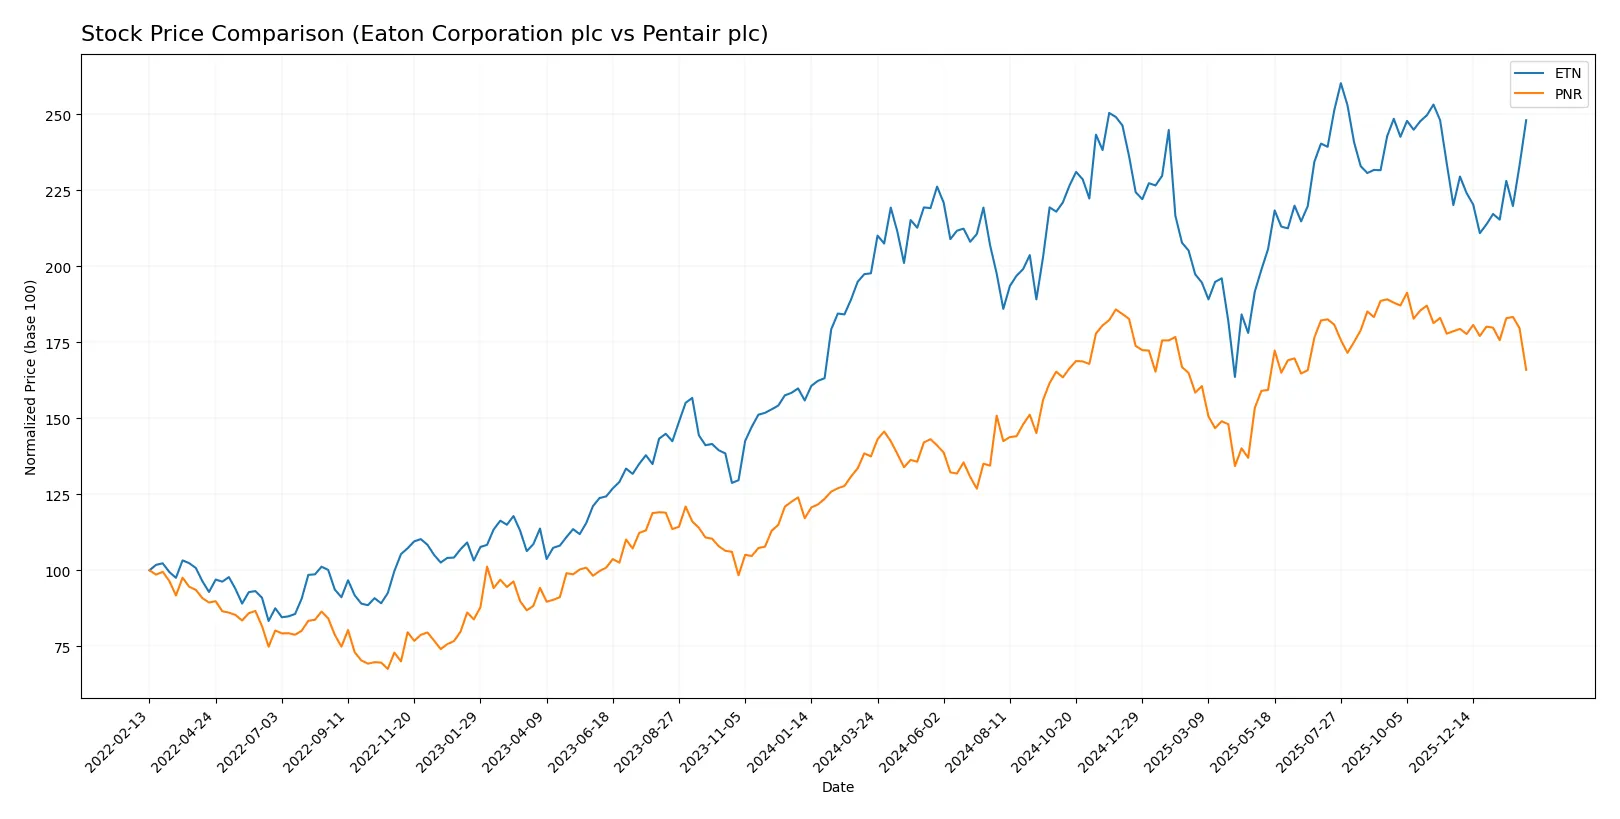
Trend Comparison
Eaton Corporation plc’s stock rose 25.49% over the past year, reflecting a bullish trend with accelerating momentum and a high standard deviation of 29.52%. It reached a peak price of 392.17 and a low of 246.52.
Pentair plc’s stock advanced 20.74% over the same period, also bullish but with decelerating momentum and lower volatility at 10.7%. The stock ranged between 74.39 and 112.23.
Eaton outperformed Pentair with a stronger overall gain and accelerating trend, despite more recent seller dominance in volume compared to Pentair’s decelerating price and seller dominance.
Target Prices
Analysts present a cautiously optimistic consensus on target prices for Eaton Corporation plc and Pentair plc.
| Company | Target Low | Target High | Consensus |
|---|---|---|---|
| Eaton Corporation plc | 295 | 495 | 394 |
| Pentair plc | 90 | 135 | 119 |
The target consensus for Eaton sits roughly 5% above its current price, signaling moderate upside. Pentair’s consensus target exceeds its share price by over 20%, suggesting stronger expected growth potential.

Don’t Let Luck Decide Your Entry Point
Optimize your entry points with our advanced ProRealTime indicators. You’ll get efficient buy signals with precise price targets for maximum performance. Start outperforming now!
How do institutions grade them?
The following tables summarize the latest institutional grades for Eaton Corporation plc and Pentair plc:
Eaton Corporation plc Grades
The table below shows recent stock grades and actions from key institutions for Eaton Corporation plc.
| Grading Company | Action | New Grade | Date |
|---|---|---|---|
| Wells Fargo | Maintain | Equal Weight | 2026-02-04 |
| JP Morgan | Maintain | Overweight | 2026-01-16 |
| HSBC | Upgrade | Buy | 2026-01-16 |
| Morgan Stanley | Maintain | Overweight | 2026-01-12 |
| Citigroup | Maintain | Buy | 2026-01-12 |
| Barclays | Maintain | Equal Weight | 2026-01-07 |
| UBS | Downgrade | Neutral | 2026-01-05 |
| Wells Fargo | Maintain | Equal Weight | 2025-12-18 |
| Wolfe Research | Upgrade | Outperform | 2025-12-09 |
| JP Morgan | Maintain | Overweight | 2025-11-06 |
Pentair plc Grades
Below is a summary of recent stock grades and changes from major grading companies for Pentair plc.
| Grading Company | Action | New Grade | Date |
|---|---|---|---|
| Citigroup | Maintain | Buy | 2026-02-04 |
| Oppenheimer | Maintain | Outperform | 2026-02-04 |
| JP Morgan | Maintain | Overweight | 2026-01-16 |
| Citigroup | Maintain | Buy | 2026-01-12 |
| BNP Paribas Exane | Downgrade | Underperform | 2026-01-07 |
| TD Cowen | Downgrade | Sell | 2026-01-05 |
| Jefferies | Upgrade | Buy | 2025-12-10 |
| Barclays | Downgrade | Equal Weight | 2025-12-04 |
| Oppenheimer | Maintain | Outperform | 2025-11-20 |
| UBS | Maintain | Buy | 2025-10-22 |
Which company has the best grades?
Pentair plc has consistently received higher ratings, including multiple “Outperform” and “Buy” grades. Eaton Corporation plc shows a mix of “Overweight” and “Equal Weight” ratings, with fewer upgrades. Investors may interpret Pentair’s stronger grades as greater institutional confidence in its near-term prospects.
Risks specific to each company
The following categories identify the critical pressure points and systemic threats facing both Eaton Corporation plc and Pentair plc in the 2026 market environment:
1. Market & Competition
Eaton Corporation plc
- Faces intense competition in power management and industrial machinery; strong global footprint provides scale advantage.
Pentair plc
- Competes in specialized water solutions with niche market presence; smaller scale limits pricing power.
2. Capital Structure & Debt
Eaton Corporation plc
- Moderate leverage with debt/equity at 0.54; strong interest coverage at 19.5x reduces default risk.
Pentair plc
- Lower leverage at 0.42 debt/equity and solid interest coverage of 11.9x, indicating more prudent debt usage.
3. Stock Volatility
Eaton Corporation plc
- Beta of 1.18 suggests moderate sensitivity to market swings, typical for industrial sector leaders.
Pentair plc
- Slightly higher beta at 1.22 indicates marginally greater volatility and risk exposure.
4. Regulatory & Legal
Eaton Corporation plc
- Broad global operations expose Eaton to diverse regulatory regimes and compliance costs.
Pentair plc
- Regulatory risk concentrated in water treatment and environmental standards; less diversified than Eaton.
5. Supply Chain & Operations
Eaton Corporation plc
- Complex supply chain supports multiple industrial segments, increasing operational risk amid global disruptions.
Pentair plc
- More focused product lines reduce supply chain complexity but increase dependency on suppliers.
6. ESG & Climate Transition
Eaton Corporation plc
- Faces pressure to innovate in energy efficiency and emissions amid power management industry trends.
Pentair plc
- ESG demands growing in water sustainability, a core business area, posing both risks and opportunities.
7. Geopolitical Exposure
Eaton Corporation plc
- Diversified global presence limits exposure but geopolitical instability in key markets remains a risk.
Pentair plc
- Concentrated European and North American exposure increases vulnerability to regional geopolitical shifts.
Which company shows a better risk-adjusted profile?
Eaton’s largest risk is supply chain complexity, which can disrupt multiple segments simultaneously. Pentair’s key risk lies in its narrower market focus, limiting diversification. Pentair’s more favorable capital structure and stronger Piotroski score suggest a better risk-adjusted profile. Eaton’s scale and operational diversity provide resilience but come with higher systemic operational risks. The recent strong interest coverage ratio for Eaton shows solid debt management, yet Pentair’s lower leverage and higher Piotroski score highlight superior financial health under stress.
Final Verdict: Which stock to choose?
Eaton Corporation (ETN) stands out as a powerhouse of operational efficiency and value creation. Its growing ROIC well above WACC signals a sustainable competitive advantage and increasing profitability. However, its relatively high valuation multiples warrant caution. ETN fits an aggressive growth portfolio seeking durable quality and operational excellence.
Pentair plc (PNR) benefits from a strategic moat rooted in strong asset turnover and consistent cash flow generation. It offers better liquidity and a safer balance sheet compared to ETN, with a solid Piotroski score reflecting financial robustness. PNR suits a Growth at a Reasonable Price (GARP) investor who values stability alongside growth.
If you prioritize high operational efficiency and long-term value creation, Eaton outshines with its proven ability to leverage capital effectively. However, if you seek better financial safety and a more moderate growth trajectory, Pentair offers superior balance sheet strength and consistent cash flow. Each presents a distinct analytical scenario tailored to different risk and growth appetites.
Disclaimer: Investment carries a risk of loss of initial capital. The past performance is not a reliable indicator of future results. Be sure to understand risks before making an investment decision.
Go Further
I encourage you to read the complete analyses of Eaton Corporation plc and Pentair plc to enhance your investment decisions: