Home > Comparison > Industrials > ETN vs PSN
The strategic rivalry between Eaton Corporation plc and Parsons Corporation shapes the industrial machinery sector’s future. Eaton, a global power management giant, operates with a capital-intensive, diversified industrial model. Parsons focuses on integrated defense and critical infrastructure solutions, emphasizing high-tech services. This analysis pits Eaton’s broad industrial reach against Parsons’ specialized technological edge to identify which trajectory offers a superior risk-adjusted return for a diversified portfolio in today’s complex market environment.
Table of contents
Companies Overview
Eaton Corporation and Parsons Corporation hold pivotal roles in the industrial machinery market with distinct operational focuses.
Eaton Corporation plc: Power Management Leader
Eaton Corporation dominates power management worldwide. Its core revenue stems from electrical components, aerospace systems, and vehicle power solutions. In 2026, Eaton emphasizes expanding its eMobility segment, integrating voltage inverters and hybrid power systems to capture growing demand in sustainable transportation.
Parsons Corporation: Defense and Infrastructure Integrator
Parsons Corporation specializes in defense and critical infrastructure solutions. It generates revenue through cybersecurity, missile defense, and intelligent transportation systems. The company’s 2026 strategy targets enhancing federal contracts and smart city technologies, leveraging advanced analytics and program management to support government and industrial clients.
Strategic Collision: Similarities & Divergences
Eaton pursues a broad industrial approach with a focus on electrical and mobility components, while Parsons adopts a specialized defense and infrastructure services model. Their competition centers on critical infrastructure and technology integration. Eaton’s scale and diversified segments contrast with Parsons’ niche market expertise, creating distinct risk and growth profiles for investors.
Income Statement Comparison
This data dissects the core profitability and scalability of both corporate engines to reveal who dominates the bottom line:
| Metric | Eaton Corporation plc (ETN) | Parsons Corporation (PSN) |
|---|---|---|
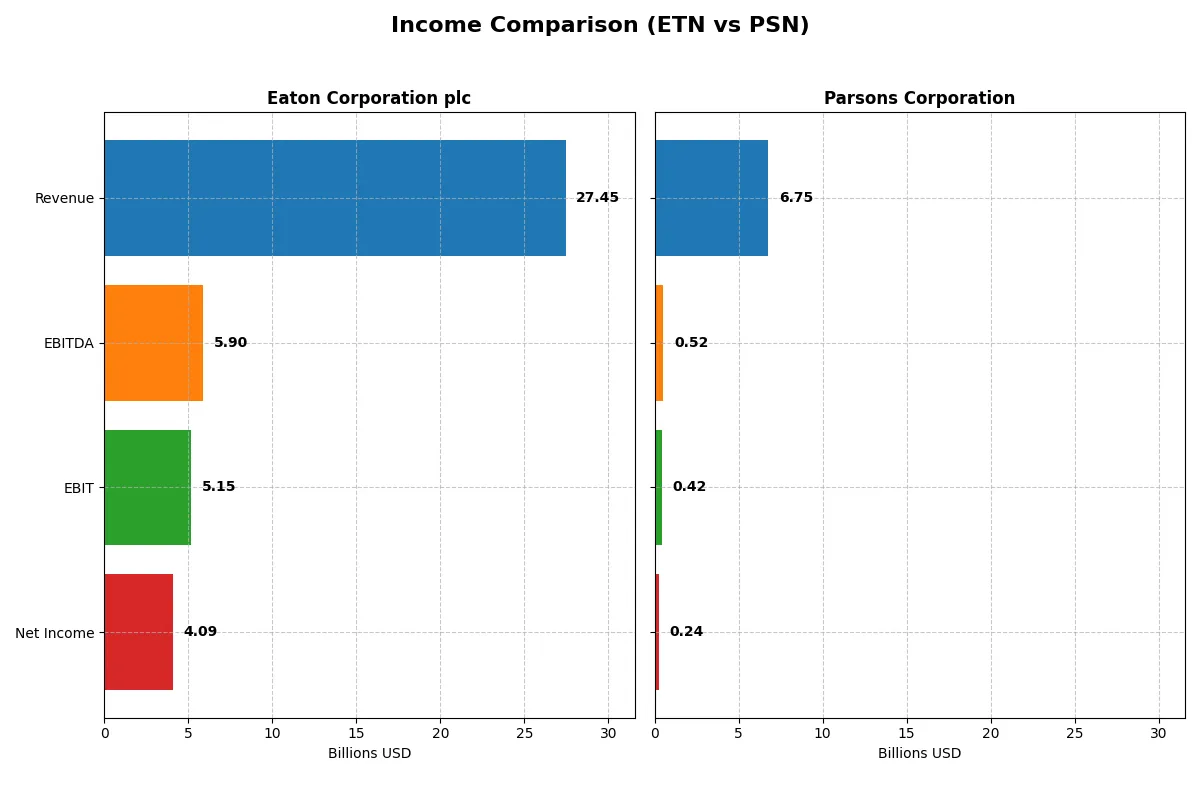
| Revenue | 27.4B | 6.75B |
| Cost of Revenue | 17.1B | 5.34B |
| Operating Expenses | 5.08B | 978M |
| Gross Profit | 10.3B | 1.41B |
| EBITDA | 5.90B | 518M |
| EBIT | 5.15B | 419M |
| Interest Expense | 264M | 52M |
| Net Income | 4.09B | 237.9M |
| EPS | 10.49 | 2.21 |
| Fiscal Year | 2025 | 2024 |
Income Statement Analysis: The Bottom-Line Duel
This income statement comparison reveals the true efficiency and profitability dynamics of two distinct corporate engines.
Eaton Corporation plc Analysis
Eaton’s revenue grew steadily from $19.6B in 2021 to $27.4B in 2025, with net income nearly doubling from $2.1B to $4.1B. Its gross margin remains robust at 37.6%, while the net margin holds a strong 14.9%, reflecting disciplined cost controls and operational leverage. In 2025, Eaton demonstrated solid momentum, with EBIT margin near 19% and EPS growth above 10%, signaling efficient capital deployment.
Parsons Corporation Analysis
Parsons expanded revenue sharply from $3.7B in 2021 to $6.8B in 2024, more than doubling net income from $64M to $237M. Its gross margin sits at a modest 20.8%, and net margin is lower at 3.5%, indicating tighter profitability. However, Parsons shows impressive momentum with a 24% revenue increase and nearly 50% EPS growth in the latest year, reflecting successful scale-up efforts despite thinner margins.
Margin Strength vs. Growth Momentum
Eaton leads with superior margins and consistent profitability, showcasing a powerful operational moat and efficient cost management. Parsons impresses with rapid revenue and earnings growth but at lower profitability levels. For investors seeking steady returns and margin resilience, Eaton’s profile stands out. Parsons appeals to those favoring high-growth potential with room to improve efficiency.
Financial Ratios Comparison
These vital ratios act as a diagnostic tool to expose the underlying fiscal health, valuation premiums, and capital efficiency of the companies compared below:
| Ratios | Eaton Corporation plc (ETN) | Parsons Corporation (PSN) |
|---|---|---|
| ROE | 21.1% | 9.7% |
| ROIC | 13.1% | 8.3% |
| P/E | 30.2 | 41.7 |
| P/B | 6.37 | 4.06 |
| Current Ratio | 1.32 | 1.29 |
| Quick Ratio | 0.81 | 1.29 |
| D/E | 0.54 | 0.59 |
| Debt-to-Assets | 25.5% | 25.9% |
| Interest Coverage | 19.8 | 8.3 |
| Asset Turnover | 0.67 | 1.23 |
| Fixed Asset Turnover | 5.40 | 25.5 |
| Payout Ratio | 39.5% | 0% |
| Dividend Yield | 1.31% | 0% |
| Fiscal Year | 2025 | 2024 |
Efficiency & Valuation Duel: The Vital Signs
Financial ratios act as a company’s DNA, uncovering hidden risks and operational strengths vital for investment decisions.
Eaton Corporation plc
Eaton posts a strong 21.1% ROE and a healthy 14.9% net margin, signaling robust profitability. However, its P/E of 30.2 and P/B of 6.4 suggest the stock trades at a premium. Eaton delivers shareholder value through a modest 1.31% dividend yield, balancing returns with steady R&D investment near 3% of revenue.
Parsons Corporation
Parsons shows a weaker 9.7% ROE and a slim 3.5% net margin, reflecting modest profitability. Its valuation appears stretched with a P/E above 41 and P/B at 4.1. The company pays no dividend, focusing capital on growth initiatives, yet its superior asset turnover of 1.23 hints at operational efficiency despite lower margins.
Premium Valuation vs. Operational Safety
Eaton offers higher profitability but at a premium valuation, while Parsons trades cheaper operational efficiency with weaker returns. Eaton suits investors prioritizing stable returns and dividends, whereas Parsons fits those willing to risk valuation for potential growth.
Which one offers the Superior Shareholder Reward?
I see Eaton Corporation plc (ETN) delivers steady dividends with a 1.3% yield and a moderate 39% payout ratio, backed by solid free cash flow coverage. Its share buybacks remain consistent but modest. Parsons Corporation (PSN) pays no dividends, reinvesting heavily in growth and acquisitions, while its buybacks are negligible. ETN’s distribution model balances income and capital return, proving more sustainable amid market cycles. PSN’s growth focus poses higher risk with potentially volatile returns. For 2026, I favor ETN’s superior total return profile given its blend of dividends and buybacks, aligned with prudent capital allocation.
Comparative Score Analysis: The Strategic Profile
The radar chart reveals the fundamental DNA and trade-offs of Eaton Corporation plc and Parsons Corporation, highlighting their core strengths and vulnerabilities:
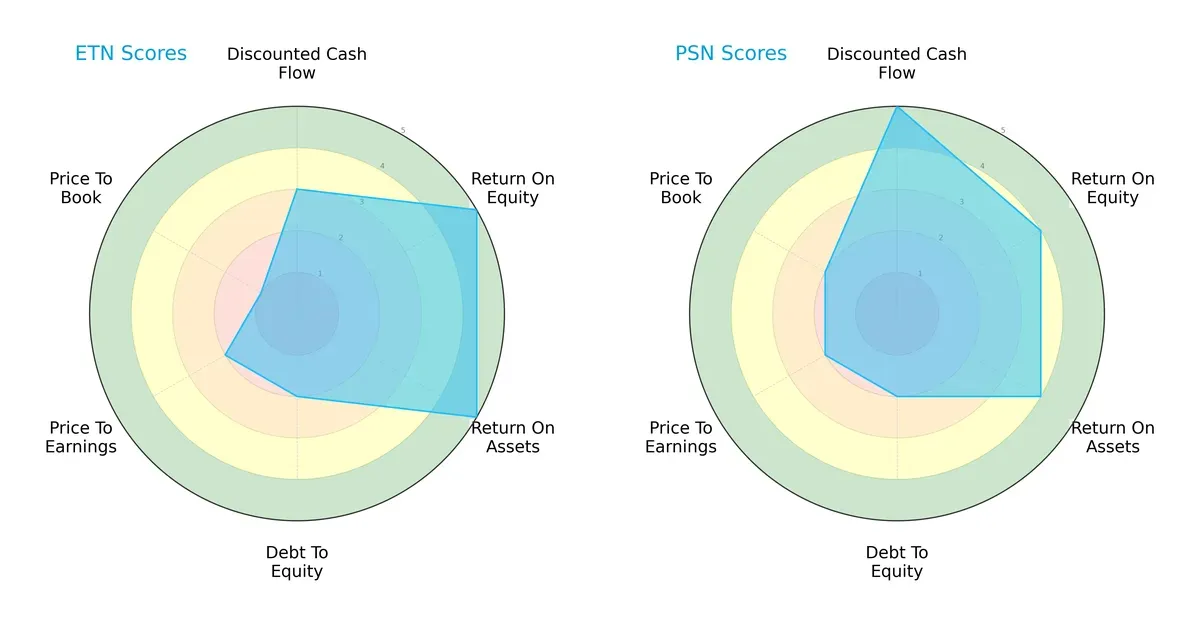
Eaton shows superior efficiency with top ROE (5) and ROA (5) scores, indicating excellent profit and asset utilization. Parsons leads in discounted cash flow valuation (5), suggesting better future cash flow prospects. Both struggle with debt management (2) and valuation metrics (P/E and P/B scores of 2 or below). Eaton’s profile is more unbalanced, relying on operational efficiency, while Parsons offers a more consistent valuation and cash flow edge.
—
Bankruptcy Risk: Solvency Showdown
Eaton’s Altman Z-Score of 5.04 and Parsons’ 3.26 position both firms firmly in the safe zone:
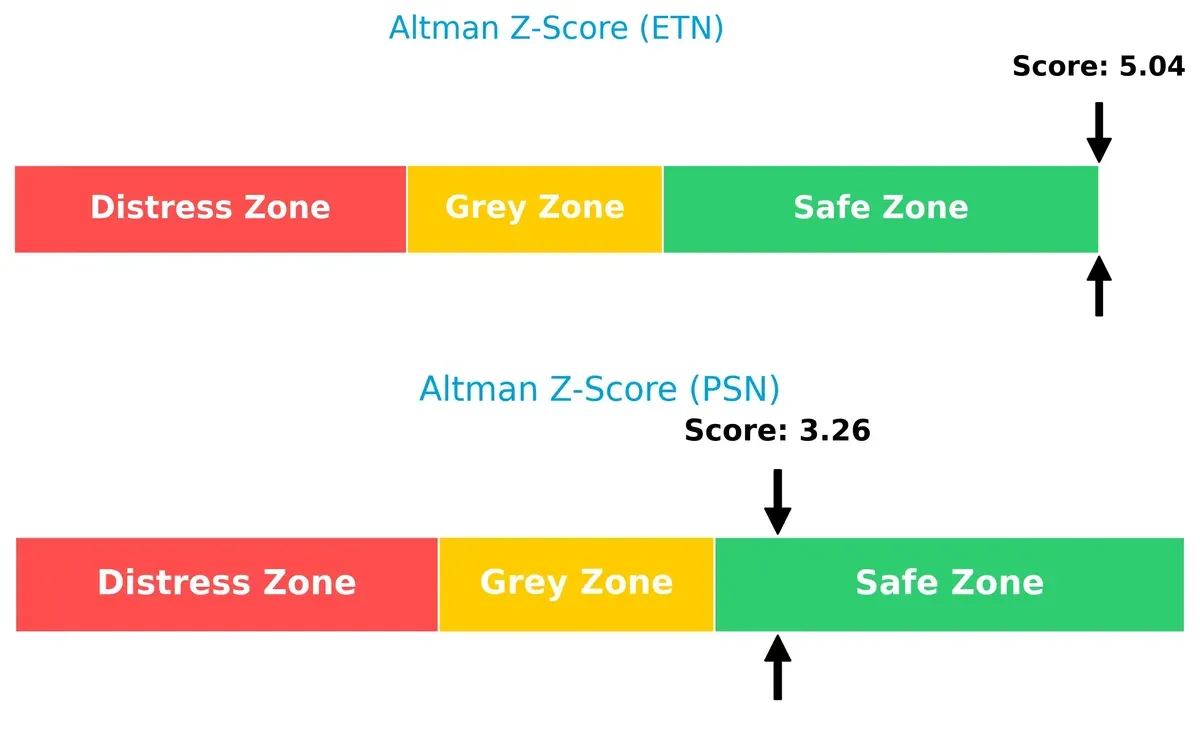
Eaton’s higher score signals stronger long-term solvency and lower bankruptcy risk. Parsons remains stable but with less buffer, reflecting moderate financial resilience in this market cycle.
—
Financial Health: Quality of Operations
Both Eaton and Parsons score a 6 on the Piotroski F-Score, indicating average financial health:
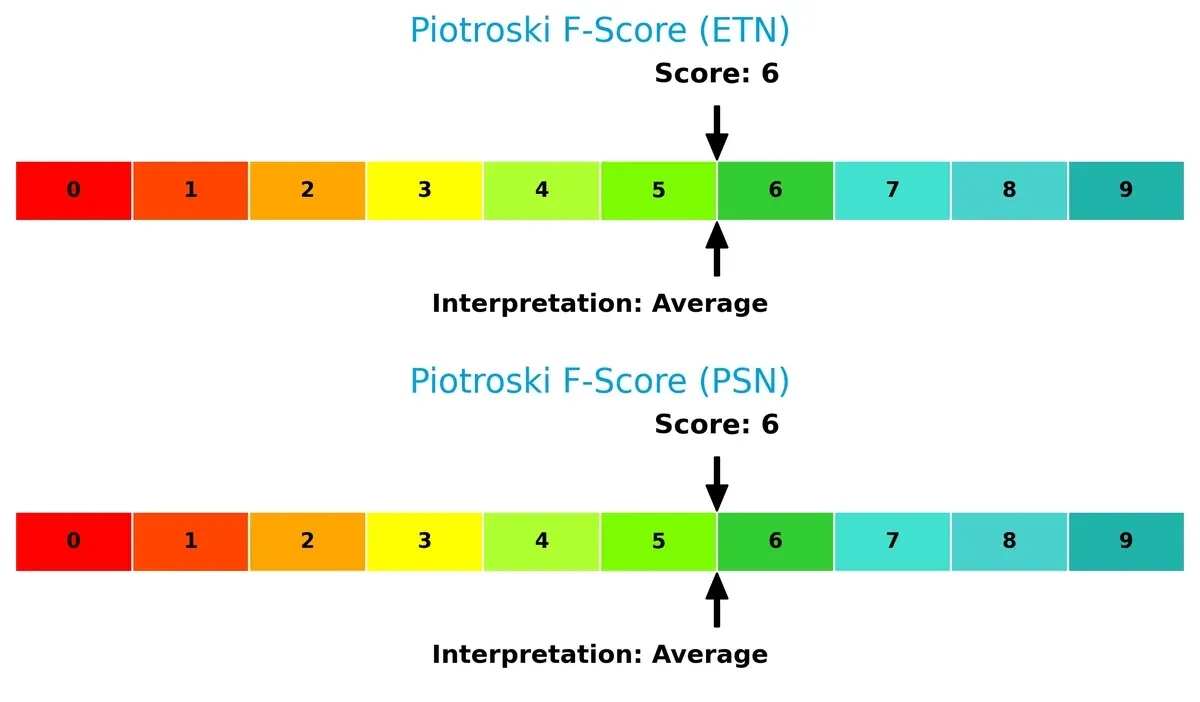
Neither company shows red flags in operational quality or balance sheet strength. However, their scores suggest room for improvement to reach peak financial robustness amid evolving economic challenges.
How are the two companies positioned?
This section dissects Eaton and Parsons’ operational DNA by comparing revenue distribution and internal dynamics. It confronts their economic moats to reveal which model delivers the most resilient competitive advantage today.
Revenue Segmentation: The Strategic Mix
This visual comparison dissects how Eaton Corporation plc and Parsons Corporation diversify their income streams and where their primary sector bets lie:
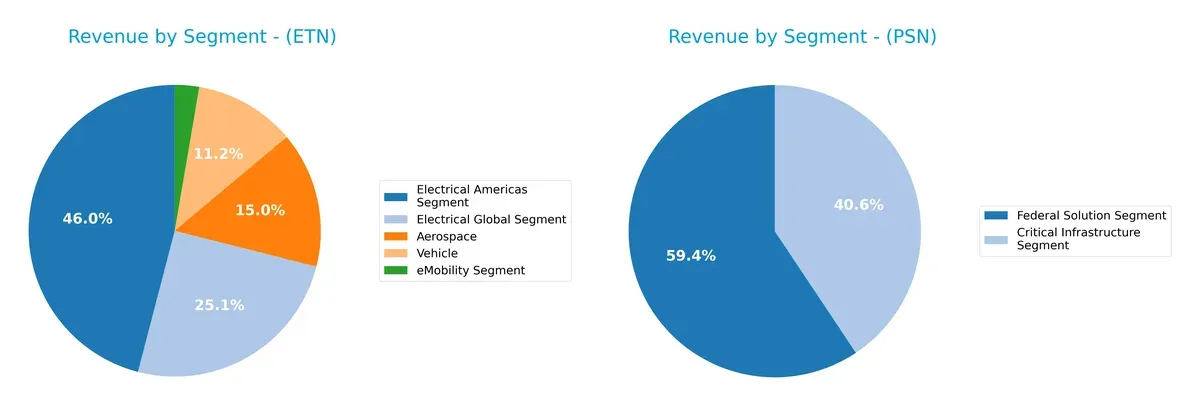
Eaton dominates with a broad mix: Electrical Americas leads at $11.4B, followed by Electrical Global $6.2B and Aerospace $3.7B. Its diversified segments reduce concentration risk and anchor a robust infrastructure footprint. Parsons relies heavily on Federal Solutions at $4.0B, with Critical Infrastructure trailing at $2.7B, showing less diversification and more dependence on government contracts. Eaton’s ecosystem lock-in contrasts Parsons’ focused government exposure.
Strengths and Weaknesses Comparison
This table compares the Strengths and Weaknesses of Eaton Corporation plc and Parsons Corporation:
Eaton Corporation plc Strengths
- Strong profitability with 14.9% net margin and 21.05% ROE
- Favorable debt-to-assets ratio at 25.53%
- Diverse product segments including Aerospace and eMobility
- Global presence with significant US and Europe revenues
- High fixed asset turnover at 5.4
Parsons Corporation Strengths
- Favorable WACC at 6.18% supports capital efficiency
- Strong asset turnover of 1.23 and fixed asset turnover of 25.51
- Favorable interest coverage ratio at 8.13
- Geographic focus with substantial North America and Middle East revenues
- Quick ratio of 1.29 indicates good liquidity
Eaton Corporation plc Weaknesses
- High P/E of 30.24 and P/B of 6.37 suggest overvaluation risk
- Neutral current and quick ratios indicate moderate liquidity
- Net margin and ROIC still only slightly favorable versus WACC
- Heavy US revenue concentration may limit geographic diversification
Parsons Corporation Weaknesses
- Low net margin at 3.48% and ROE at 9.73% reflect weak profitability
- High P/E of 41.72 and unfavorable P/B of 4.06 may pressure valuation
- No dividend yield reduces income appeal
- Smaller product diversification with only two main segments
Overall, Eaton shows strong profitability and diversified global operations but faces valuation and liquidity caution. Parsons benefits from efficient asset use and liquidity but struggles with low profitability and limited diversification. Both companies must balance these factors in their strategic focus.
The Moat Duel: Analyzing Competitive Defensibility
A structural moat is the only thing protecting long-term profits from the erosion of competition. Let’s dissect how Eaton and Parsons defend their turf:
Eaton Corporation plc: Diverse Industrial Powerhouse with Cost Advantage
Eaton leverages a broad product portfolio and efficient capital use to sustain a 4.3% ROIC premium over WACC. Its stable margins reflect durable cost advantages. Expansion in eMobility could deepen Eaton’s moat in 2026.
Parsons Corporation: Niche Defense Innovator with Intangible Assets
Parsons relies on specialized defense contracts and proprietary technology, delivering a 2.1% ROIC premium over WACC. Its growth in cybersecurity and space solutions strengthens its competitive edge, with robust opportunities in critical infrastructure.
Cost Efficiency vs. Specialized Innovation: The Moat Showdown
Eaton’s wider moat stems from superior capital efficiency and scale, while Parsons excels in high-value niche markets. Eaton appears better equipped to defend broad industrial market share; Parsons focuses on deepening specialized defensibility.
Which stock offers better returns?
Over the past year, Eaton Corporation plc’s stock advanced sharply with accelerating gains, while Parsons Corporation’s shares declined steadily, reflecting contrasting trading dynamics and market sentiment.
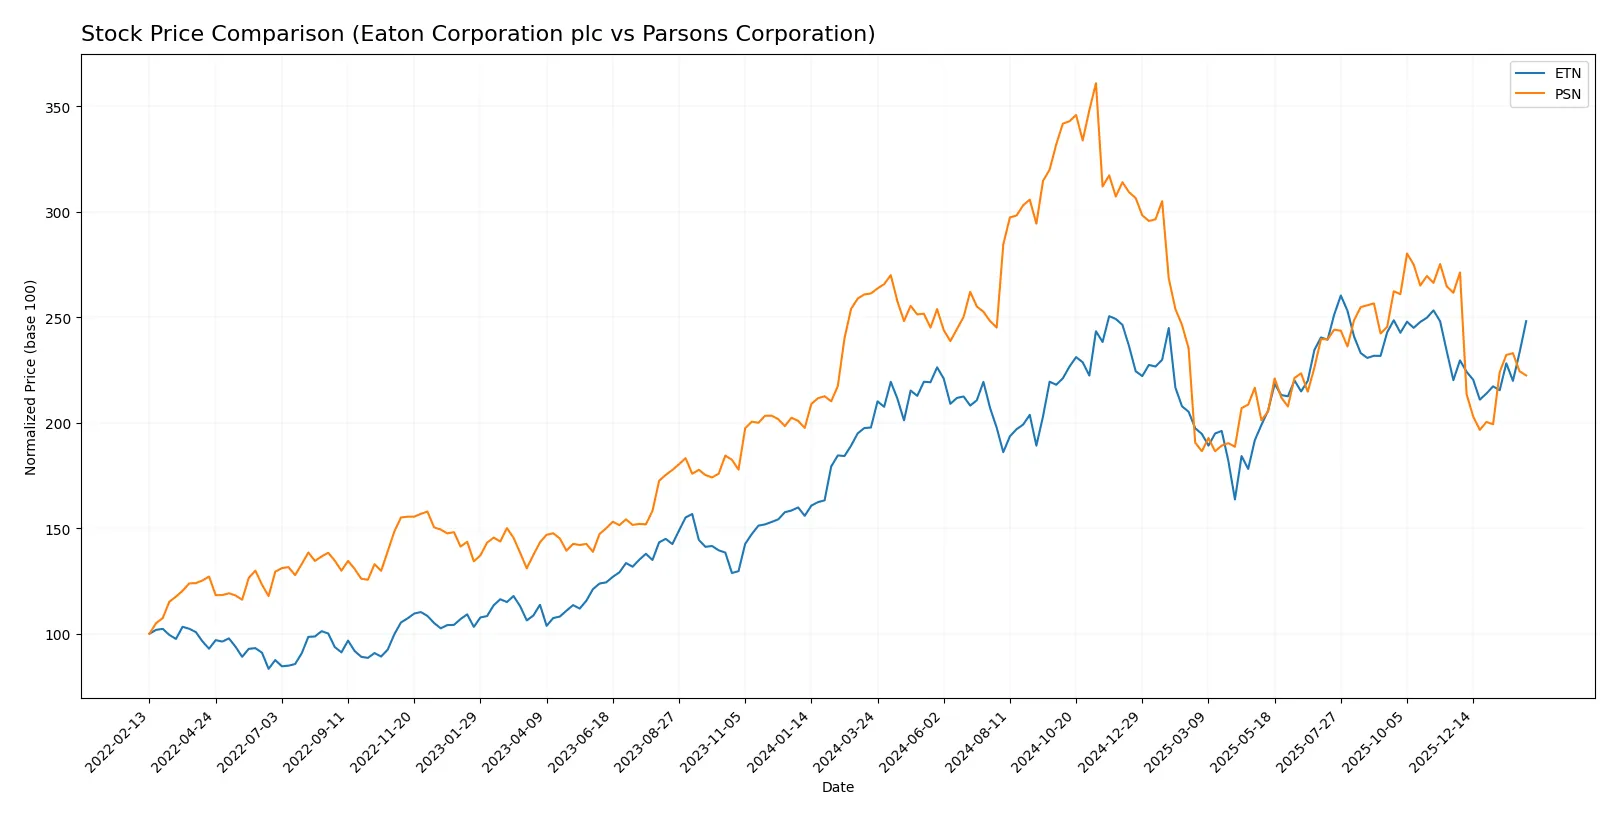
Trend Comparison
Eaton Corporation plc’s stock rose 25.49% over the past 12 months, showing a bullish trend with accelerating momentum and a high volatility of 29.52%. The stock hit a peak of 392.17 and a low of 246.52.
Parsons Corporation’s shares fell 14.87% over the same period, marking a bearish trend with decelerating losses and lower volatility at 13.09%. Its price ranged between 58.22 and 112.69.
Comparing the two, Eaton’s stock delivered the highest market performance, outperforming Parsons by a wide margin over the past year.
Target Prices
Analysts present a balanced target price consensus for Eaton Corporation plc and Parsons Corporation.
| Company | Target Low | Target High | Consensus |
|---|---|---|---|
| Eaton Corporation plc | 295 | 495 | 393.64 |
| Parsons Corporation | 78 | 104 | 86.8 |
Eaton’s consensus target of 393.64 exceeds its current price of 373.82, indicating moderate upside potential. Parsons’ consensus target of 86.8 is notably above its current 69.44 price, suggesting stronger analyst optimism.

Don’t Let Luck Decide Your Entry Point
Optimize your entry points with our advanced ProRealTime indicators. You’ll get efficient buy signals with precise price targets for maximum performance. Start outperforming now!
How do institutions grade them?
The institutional grades for Eaton Corporation plc and Parsons Corporation reveal their recent analyst sentiment:
Eaton Corporation plc Grades
Below is a summary of recent analyst ratings for Eaton Corporation plc from reputable firms.
| Grading Company | Action | New Grade | Date |
|---|---|---|---|
| Wells Fargo | Maintain | Equal Weight | 2026-02-04 |
| JP Morgan | Maintain | Overweight | 2026-01-16 |
| HSBC | Upgrade | Buy | 2026-01-16 |
| Morgan Stanley | Maintain | Overweight | 2026-01-12 |
| Citigroup | Maintain | Buy | 2026-01-12 |
| Barclays | Maintain | Equal Weight | 2026-01-07 |
| UBS | Downgrade | Neutral | 2026-01-05 |
| Wells Fargo | Maintain | Equal Weight | 2025-12-18 |
| Wolfe Research | Upgrade | Outperform | 2025-12-09 |
| JP Morgan | Maintain | Overweight | 2025-11-06 |
Parsons Corporation Grades
Here are the latest institutional grades for Parsons Corporation from recognized grading companies.
| Grading Company | Action | New Grade | Date |
|---|---|---|---|
| Barclays | Maintain | Overweight | 2026-01-23 |
| Keybanc | Maintain | Overweight | 2026-01-20 |
| UBS | Maintain | Buy | 2026-01-15 |
| Citigroup | Maintain | Buy | 2026-01-13 |
| B of A Securities | Maintain | Buy | 2025-12-30 |
| Stifel | Maintain | Buy | 2025-12-23 |
| Jefferies | Maintain | Hold | 2025-12-11 |
| TD Cowen | Upgrade | Buy | 2025-12-10 |
| Baird | Maintain | Outperform | 2025-12-08 |
| Keybanc | Maintain | Overweight | 2025-12-08 |
Which company has the best grades?
Parsons Corporation consistently earns stronger buy and outperform ratings compared to Eaton’s mix of equal weight and overweight grades. This suggests Parsons may enjoy more bullish institutional sentiment, potentially reflecting higher growth expectations.
Risks specific to each company
The following categories identify critical pressure points and systemic threats facing Eaton Corporation plc and Parsons Corporation in the 2026 market environment:
1. Market & Competition
Eaton Corporation plc
- Operates globally in power management with diversified industrial and aerospace segments; faces intense industrial machinery competition.
Parsons Corporation
- Focuses on defense, intelligence, and infrastructure sectors; competition driven by government contracts and technology innovation.
2. Capital Structure & Debt
Eaton Corporation plc
- Debt-to-equity ratio moderate at 0.54; interest coverage strong at 19.5, indicating solid debt servicing capacity.
Parsons Corporation
- Slightly higher debt-to-equity at 0.59; interest coverage at 8.13, adequate but with less cushion than Eaton.
3. Stock Volatility
Eaton Corporation plc
- Beta of 1.18 signals higher volatility than market; price range wide from 232 to 400 USD.
Parsons Corporation
- Lower beta at 0.665 indicates less volatility; price range narrower between 55 and 90 USD.
4. Regulatory & Legal
Eaton Corporation plc
- Subject to global industrial and environmental regulations; faces aerospace compliance risks.
Parsons Corporation
- Operates in defense and intelligence sectors with heavy regulatory scrutiny and government oversight.
5. Supply Chain & Operations
Eaton Corporation plc
- Complex global supply chains in electrical and vehicle components; susceptible to material cost fluctuations.
Parsons Corporation
- Project-driven operations reliant on government contracts; supply chain stability tied to defense and infrastructure projects.
6. ESG & Climate Transition
Eaton Corporation plc
- Industrial focus requires aggressive emission reductions; ESG integration critical for market positioning.
Parsons Corporation
- Increasing ESG expectations in defense and infrastructure; climate transition less direct but growing importance.
7. Geopolitical Exposure
Eaton Corporation plc
- Global operations expose firm to trade tensions and geopolitical risks, especially in emerging markets.
Parsons Corporation
- High exposure to U.S. government budgets and Middle East projects; geopolitical shifts impact contract awards.
Which company shows a better risk-adjusted profile?
Eaton faces significant market volatility and regulatory complexity but benefits from strong debt coverage and diversified operations. Parsons has less stock volatility and favorable asset turnover but carries tighter margins and greater dependency on government contracts. Eaton’s Altman Z-Score (5.04) surpasses Parsons (3.26), signaling superior financial resilience. However, Eaton’s high valuation multiples and debt-to-equity score raise caution. Parsons’ lower beta and favorable asset efficiency present a steadier risk profile, though profitability remains a concern. Overall, Eaton shows a better risk-adjusted profile due to robust cash flow and stronger financial health despite valuation risks.
Final Verdict: Which stock to choose?
Eaton Corporation plc (ETN) excels as a capital-efficient powerhouse with a very favorable moat supported by a growing ROIC well above its WACC. Its strategic strength lies in sustainable value creation and operational excellence. The main point of vigilance remains its relatively high valuation multiples, which could compress returns. ETN fits an aggressive growth portfolio seeking durable competitive advantages.
Parsons Corporation (PSN) stands out for its operational agility and improving profitability within a niche market, underpinned by a solid moat and a conservative balance sheet. Compared to ETN, PSN offers a more moderate risk profile but trades with less margin of safety. It suits investors targeting GARP—growth at a reasonable price—with a focus on steady progress.
If you prioritize sustainable value creation and can tolerate valuation risk, Eaton outshines as the compelling choice due to its robust capital allocation and durable moat. However, if you seek a more measured growth trajectory with better downside protection, Parsons offers better stability and improving fundamentals at a lower entry point.
Disclaimer: Investment carries a risk of loss of initial capital. The past performance is not a reliable indicator of future results. Be sure to understand risks before making an investment decision.
Go Further
I encourage you to read the complete analyses of Eaton Corporation plc and Parsons Corporation to enhance your investment decisions: