Home > Comparison > Industrials > ETN vs PH
The strategic rivalry between Eaton Corporation plc and Parker-Hannifin Corporation shapes the industrial machinery sector’s evolution. Eaton operates as a diversified power management company with broad global reach, while Parker-Hannifin focuses on specialized motion and control technologies. This head-to-head pits a capital-intensive conglomerate against a niche innovator. This analysis aims to identify which corporate trajectory offers superior risk-adjusted returns for a well-diversified portfolio in 2026.
Table of contents
Companies Overview
Eaton Corporation plc and Parker-Hannifin Corporation are pivotal players in industrial machinery markets worldwide.
Eaton Corporation plc: Global Power Management Leader
Eaton operates as a power management company serving electrical, aerospace, vehicle, and eMobility sectors. It generates revenue through electrical components, hydraulic systems, and hybrid power solutions. In 2026, Eaton emphasizes expanding its eMobility segment and enhancing industrial power reliability products to capture evolving energy demands.
Parker-Hannifin Corporation: Motion and Control Innovator
Parker-Hannifin specializes in motion and control technologies for industrial, mobile, and aerospace markets. Its revenue stems from sealing, filtration, hydraulic, and pneumatic systems sold to OEMs and distributors. The company focuses on advancing aerospace systems and diversified industrial solutions, targeting precision and durability in extreme environments this year.
Strategic Collision: Similarities & Divergences
Both companies excel in industrial machinery but diverge in business approaches. Eaton leans on integrated power management across sectors, while Parker-Hannifin prioritizes specialized motion and control components. They fiercely compete in aerospace and industrial equipment markets. Eaton offers broader diversification; Parker-Hannifin provides focused engineering expertise, shaping distinct investment profiles.
Income Statement Comparison
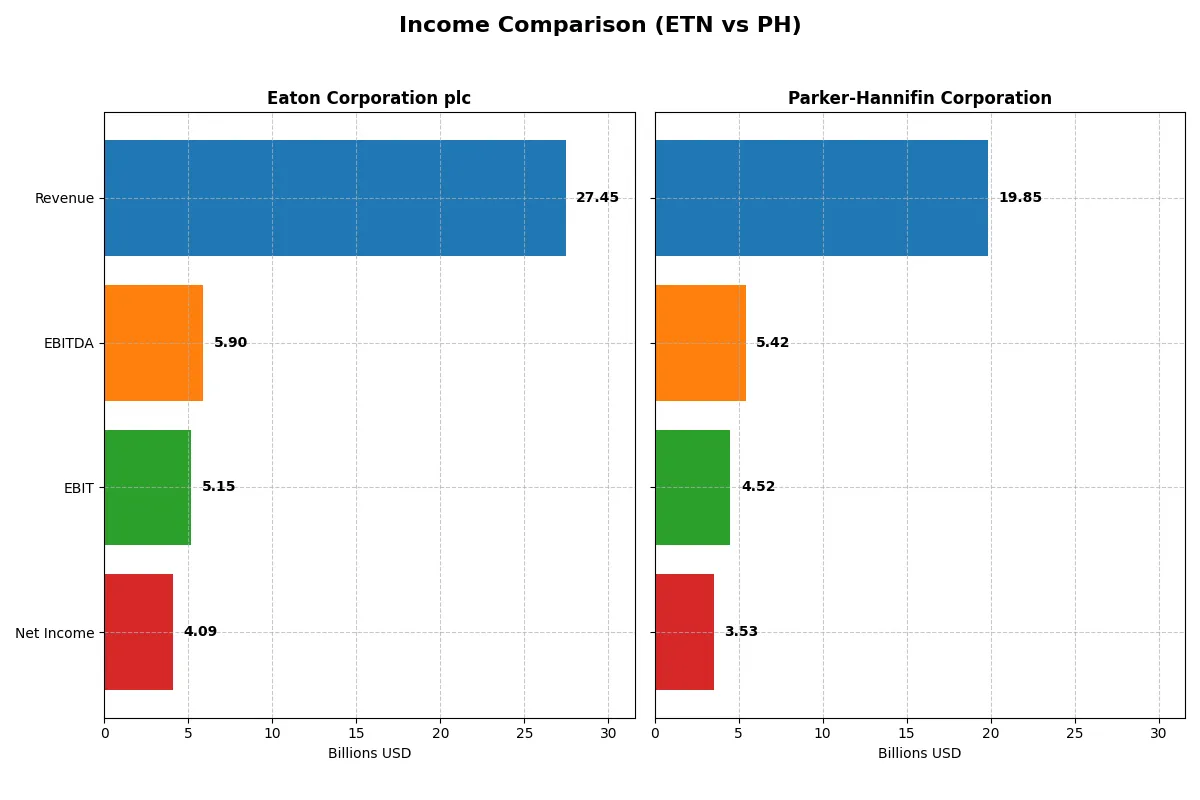
This data dissects the core profitability and scalability of both corporate engines to reveal who dominates the bottom line:
| Metric | Eaton Corporation plc (ETN) | Parker-Hannifin Corporation (PH) |
|---|---|---|
| Revenue | 27.4B | 19.9B |
| Cost of Revenue | 17.1B | 12.5B |
| Operating Expenses | 5.08B | 3.26B |
| Gross Profit | 10.3B | 7.32B |
| EBITDA | 5.9B | 5.42B |
| EBIT | 5.15B | 4.52B |
| Interest Expense | 264M | 409M |
| Net Income | 4.09B | 3.53B |
| EPS | 10.49 | 27.52 |
| Fiscal Year | 2025 | 2025 |
Income Statement Analysis: The Bottom-Line Duel
This income statement comparison uncovers how effectively each company converts sales into profits and manages growth momentum.
Eaton Corporation plc Analysis
Eaton’s revenue climbs steadily to $27.4B in 2025, with net income rising 7.8% year-over-year to $4.09B. Its gross margin holds strong at 37.6%, and net margin remains healthy near 14.9%. The company demonstrates consistent efficiency gains, evident in a 10% EPS growth and a solid 18.8% EBIT margin, signaling robust operational control.
Parker-Hannifin Corporation Analysis
Parker-Hannifin posts $19.85B revenue in mid-2025, slightly down from 2024, yet net income surges 24.2% to $3.53B. Gross margin hovers at 36.9%, with a higher net margin of 17.8%. EBIT margin at 22.8% reflects strong profitability. Despite flat revenue, significant margin expansion and EPS growth highlight improving operational leverage and capital discipline.
Margin Strength vs. Revenue Momentum
Eaton leads with superior revenue scale and stable margin expansion, reflecting consistent growth and efficiency. Parker-Hannifin outpaces Eaton in net margin and EPS growth but struggles with revenue contraction. For investors, Eaton’s balanced profile offers steady growth, while Parker-Hannifin’s high-margin gains appeal to those prioritizing profitability improvement over top-line growth.
Financial Ratios Comparison
These vital ratios act as a diagnostic tool to expose the underlying fiscal health, valuation premiums, and capital efficiency of each company:
| Ratios | Eaton Corporation plc (ETN) | Parker-Hannifin Corporation (PH) |
|---|---|---|
| ROE | 21.1% | 25.8% |
| ROIC | 13.1% | 13.7% |
| P/E | 30.2 | 25.4 |
| P/B | 6.37 | 6.55 |
| Current Ratio | 1.32 | 1.19 |
| Quick Ratio | 0.81 | 0.71 |
| D/E | 0.54 | 0.70 |
| Debt-to-Assets | 25.5% | 32.7% |
| Interest Coverage | 19.8 | 9.93 |
| Asset Turnover | 0.67 | 0.67 |
| Fixed Asset Turnover | 5.40 | 6.76 |
| Payout ratio | 39.5% | 24.4% |
| Dividend yield | 1.31% | 0.96% |
| Fiscal Year | 2025 | 2025 |
Efficiency & Valuation Duel: The Vital Signs
Financial ratios serve as a company’s DNA, unveiling hidden risks and operational excellence through clear, measurable signals.
Eaton Corporation plc
Eaton posts a strong 21.05% ROE and solid 14.9% net margin, indicating efficient profitability. However, its P/E of 30.24 suggests a stretched valuation. The 1.31% dividend yield offers steady shareholder returns, supported by a balanced reinvestment in R&D at 3% of revenue, fueling long-term growth.
Parker-Hannifin Corporation
Parker-Hannifin delivers an impressive 25.81% ROE and a higher 17.79% net margin, reflecting superior profitability. Its P/E of 25.38 appears somewhat expensive but less stretched than Eaton’s. The lower 0.96% dividend yield points to a modest payout, complemented by a disciplined capital allocation favoring operational efficiency and growth.
Balanced Profitability vs. Valuation Stretch
Eaton shows stable profitability but trades at a higher valuation premium, while Parker-Hannifin boasts stronger returns with a slightly more reasonable price. Investors seeking higher operational efficiency may lean toward Parker-Hannifin, whereas those prioritizing dividend income and R&D-driven growth might prefer Eaton.
Which one offers the Superior Shareholder Reward?
I compare Eaton Corporation plc (ETN) and Parker-Hannifin Corporation (PH) on dividends, buybacks, and distribution sustainability. ETN yields 1.31% with a 39.5% payout ratio, balancing dividends and buybacks moderately. PH yields 0.96% with a lighter 24.4% payout but a more aggressive buyback program. ETN’s higher dividend yield and steady payout ratio reflect a conservative, sustainable distribution model. PH favors reinvestment and buybacks, boosting total returns but with elevated financial leverage (debt/equity ~0.7 vs. ETN’s ~0.54). Historically, ETN’s approach suits income-focused investors, while PH appeals to growth-oriented shareholders comfortable with leverage risks. In 2026, I find ETN offers a more attractive total return profile due to sustainable dividends, prudent buybacks, and better balance sheet stability.
Comparative Score Analysis: The Strategic Profile
The radar chart reveals the fundamental DNA and trade-offs of Eaton Corporation plc and Parker-Hannifin Corporation:
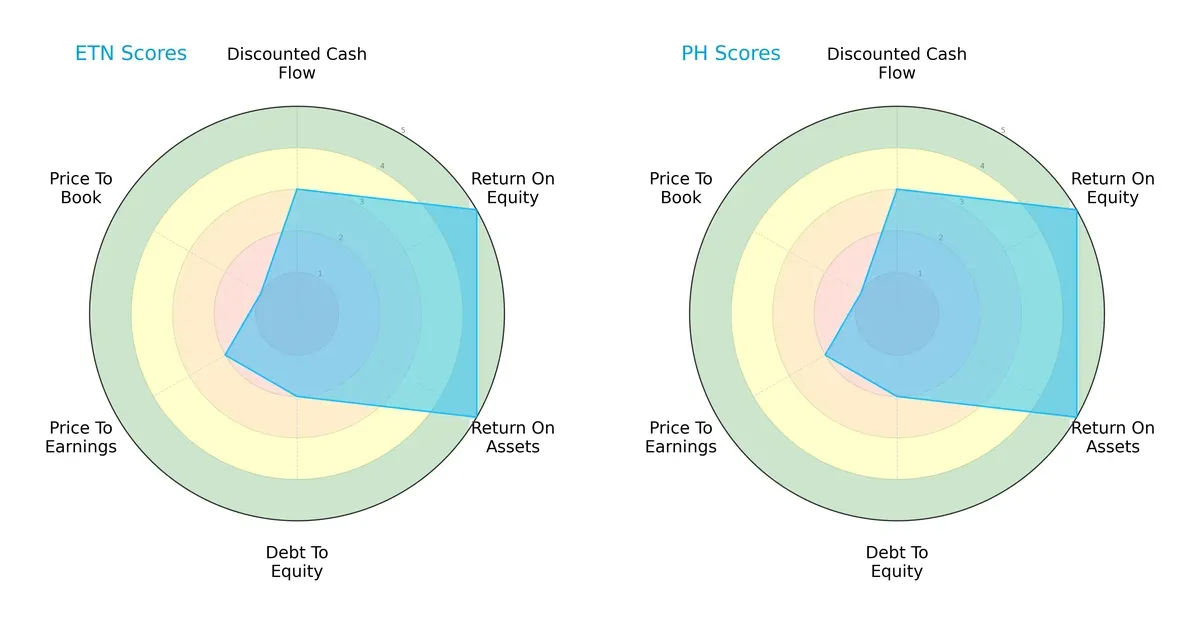
Both firms share identical scores in DCF, ROE, and ROA, reflecting similar profitability and asset efficiency. However, both struggle with leverage and valuation metrics, scoring low on debt-to-equity, P/E, and especially P/B ratios. Neither company exhibits a balanced financial profile; instead, they rely heavily on operational efficiency while facing valuation and leverage headwinds.
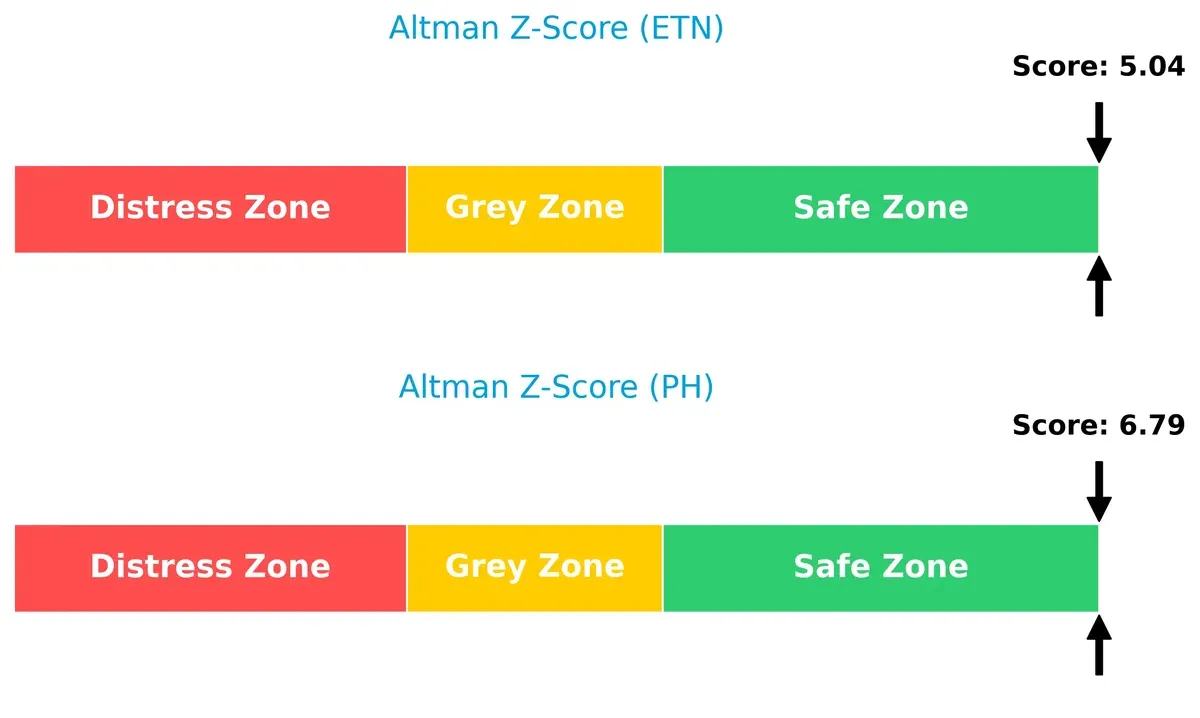
Bankruptcy Risk: Solvency Showdown
Parker-Hannifin’s Altman Z-Score of 6.79 outpaces Eaton’s 5.04, signaling stronger solvency and lower bankruptcy risk. Both remain comfortably in the safe zone, but Parker-Hannifin holds a clearer cushion against economic downturns:
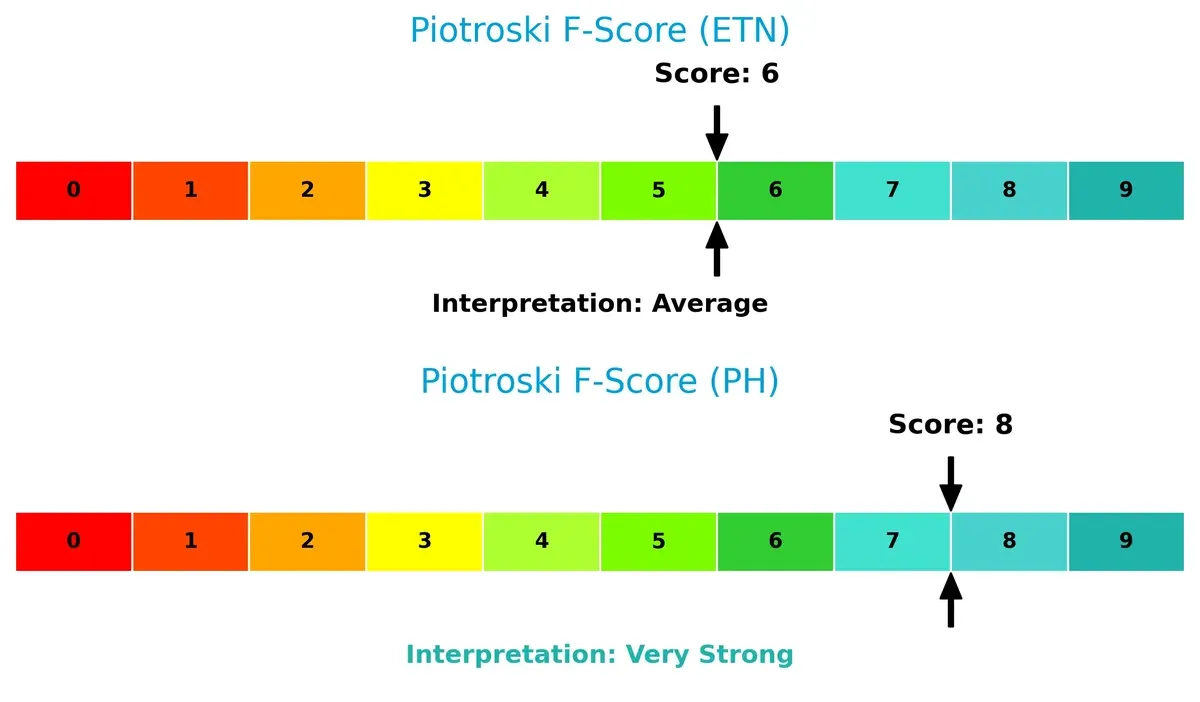
Financial Health: Quality of Operations
Parker-Hannifin’s Piotroski F-Score of 8 surpasses Eaton’s 6, indicating superior internal financial health and operational quality. Eaton’s average score suggests some red flags in profitability or efficiency metrics compared to Parker-Hannifin’s very strong status:
How are the two companies positioned?
This section dissects Eaton and Parker-Hannifin’s operational DNA by comparing their revenue distribution and internal strengths and weaknesses. The goal is to confront their economic moats and identify which model yields the most resilient, sustainable competitive advantage today.
Revenue Segmentation: The Strategic Mix
This visual comparison dissects how Eaton Corporation plc and Parker-Hannifin Corporation diversify their income streams and reveals where their primary sector bets lie:
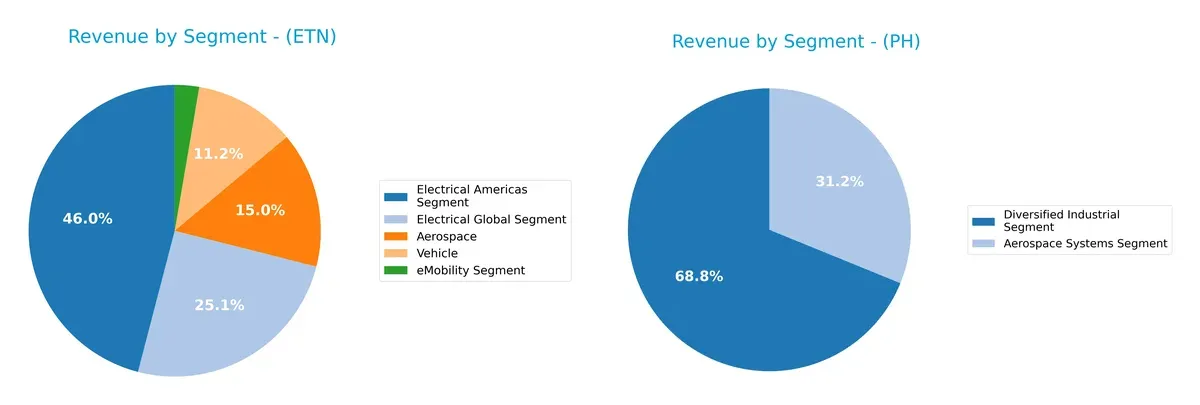
Eaton shows a highly diversified revenue base with significant contributions from Electrical Americas ($11.4B), Electrical Global ($6.2B), Aerospace ($3.7B), and Vehicle ($2.8B) segments. Parker-Hannifin, by contrast, pivots on two core pillars: Diversified Industrial ($13.7B) and Aerospace Systems ($6.2B). Eaton’s broad mix reduces concentration risk, while Parker’s focus suggests strength in industrial dominance but higher exposure to sector cycles.
Strengths and Weaknesses Comparison
This table compares the Strengths and Weaknesses of Eaton Corporation plc (ETN) and Parker-Hannifin Corporation (PH):
ETN Strengths
- Diverse product segments including Aerospace, Electrical Americas, Electrical Global, Vehicle, and eMobility
- Favorable profitability with net margin 14.9% and ROE 21.05%
- Strong interest coverage at 19.5 and favorable fixed asset turnover at 5.4
- Balanced debt-to-assets ratio at 25.53% indicating prudent leverage
- Significant global presence with substantial U.S., Europe, and Asia Pacific revenues
PH Strengths
- High profitability with net margin 17.79% and ROE 25.81%
- Favorable ROIC at 13.69% above WACC
- Strong fixed asset turnover at 6.76 and acceptable interest coverage at 11.04
- Large diversified industrial segment and aerospace systems
- Concentrated North America presence with growing Asia Pacific and Europe revenues
ETN Weaknesses
- Elevated valuation ratios with PE 30.24 and PB 6.37 considered unfavorable
- Neutral liquidity ratios with quick ratio at 0.81 and current ratio 1.32
- Moderate asset turnover at 0.67 limits efficiency
- Slightly less concentrated geographic footprint compared to PH
PH Weaknesses
- Unfavorable quick ratio at 0.71 indicating liquidity risks
- Higher debt-to-assets at 32.68% with neutral leverage status
- Dividend yield low at 0.96% and PB elevated at 6.55
- PE ratio relatively high at 25.38, reflecting valuation concerns
Both companies show slightly favorable financial profiles but differ in profitability and liquidity nuances. ETN offers broader product diversification and stronger liquidity, while PH excels in profitability metrics but faces tighter liquidity and higher leverage, influencing strategic priorities.
The Moat Duel: Analyzing Competitive Defensibility
A structural moat is the only true barrier protecting long-term profits from relentless competition’s erosion in industrial machinery companies:
Eaton Corporation plc: Diverse Product Ecosystem Moat
Eaton secures its moat through broad product integration and power management expertise. This drives a strong 18.8% EBIT margin and growing ROIC, signaling efficient capital use. Expansion in eMobility deepens its competitive edge in 2026.
Parker-Hannifin Corporation: Precision Engineering and Brand Moat
Parker-Hannifin’s moat lies in specialized motion control and sealing technologies with a superior 22.8% EBIT margin. Its brand loyalty and technical know-how sustain value creation, while aerospace system innovations promise further market disruption.
Margin Strength vs. Engineering Specialty: Who Holds the Deeper Moat?
Both companies exhibit very favorable moats with ROIC well above WACC, but Eaton’s broader product ecosystem and faster ROIC growth give it a wider competitive moat. Eaton appears better positioned to defend market share long term.
Which stock offers better returns?
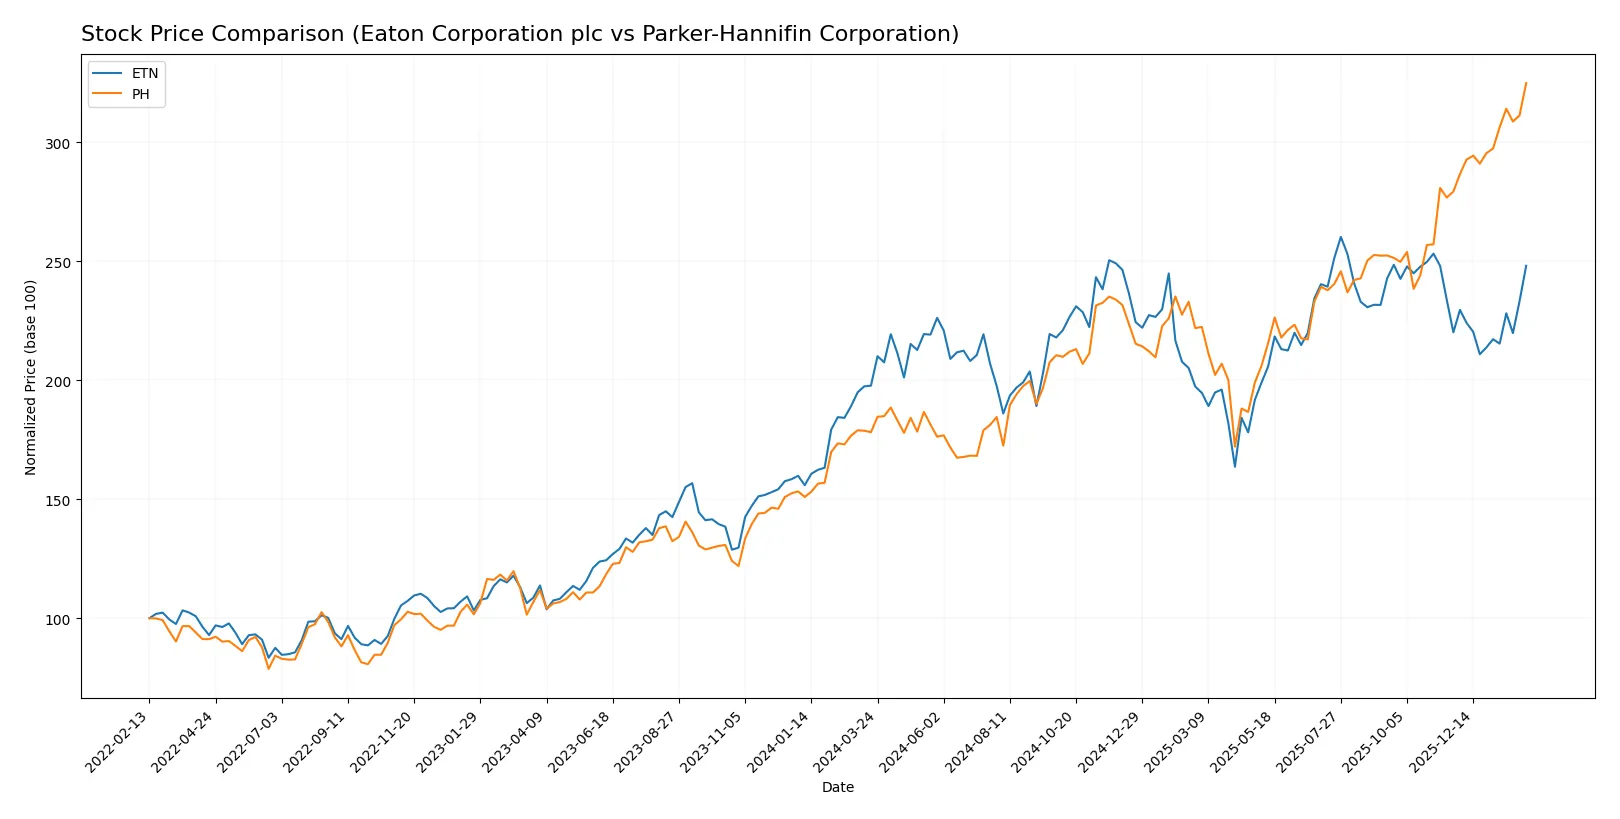
The past year shows Eaton Corporation plc and Parker-Hannifin Corporation both rallying, with Parker-Hannifin’s gains markedly stronger amid accelerating upward momentum.
Trend Comparison
Eaton Corporation plc’s stock rose 25.49% over the past year, showing a bullish trend with acceleration. It ranged between 246.52 and 392.17, reflecting moderate volatility (std dev 29.52).
Parker-Hannifin Corporation’s stock surged 82.38% in the same period, also bullish with acceleration. It exhibited higher volatility (std dev 115.92), trading from 503.3 to a peak of 976.49.
Parker-Hannifin delivered stronger market performance with a larger price increase and higher buyer dominance, outperforming Eaton Corporation plc over the analyzed period.
Target Prices
Analysts present a confident target price consensus for Eaton Corporation plc and Parker-Hannifin Corporation.
| Company | Target Low | Target High | Consensus |
|---|---|---|---|
| Eaton Corporation plc | 295 | 495 | 394 |
| Parker-Hannifin Corporation | 825 | 1139 | 1008 |
The consensus targets for both stocks exceed current prices, signaling analyst optimism. Eaton’s target median sits about 9% above its $374 share price, while Parker-Hannifin’s target consensus suggests roughly a 3% upside from $976.

Don’t Let Luck Decide Your Entry Point
Optimize your entry points with our advanced ProRealTime indicators. You’ll get efficient buy signals with precise price targets for maximum performance. Start outperforming now!
How do institutions grade them?
Eaton Corporation plc Grades
The following table presents recent grades from established financial institutions for Eaton Corporation plc.
| Grading Company | Action | New Grade | Date |
|---|---|---|---|
| Wells Fargo | Maintain | Equal Weight | 2026-02-04 |
| JP Morgan | Maintain | Overweight | 2026-01-16 |
| HSBC | Upgrade | Buy | 2026-01-16 |
| Morgan Stanley | Maintain | Overweight | 2026-01-12 |
| Citigroup | Maintain | Buy | 2026-01-12 |
| Barclays | Maintain | Equal Weight | 2026-01-07 |
| UBS | Downgrade | Neutral | 2026-01-05 |
| Wells Fargo | Maintain | Equal Weight | 2025-12-18 |
| Wolfe Research | Upgrade | Outperform | 2025-12-09 |
| JP Morgan | Maintain | Overweight | 2025-11-06 |
Parker-Hannifin Corporation Grades
Below are the current grades from reputable grading firms for Parker-Hannifin Corporation.
| Grading Company | Action | New Grade | Date |
|---|---|---|---|
| Stifel | Maintain | Hold | 2026-01-30 |
| JP Morgan | Maintain | Overweight | 2026-01-30 |
| Wells Fargo | Maintain | Overweight | 2026-01-30 |
| Barclays | Maintain | Overweight | 2026-01-30 |
| Citigroup | Maintain | Buy | 2026-01-30 |
| Jefferies | Maintain | Buy | 2026-01-30 |
| Stifel | Maintain | Hold | 2026-01-23 |
| JP Morgan | Maintain | Overweight | 2026-01-16 |
| Morgan Stanley | Maintain | Equal Weight | 2026-01-14 |
| Keybanc | Maintain | Overweight | 2026-01-07 |
Which company has the best grades?
Eaton Corporation plc shows a broader range of ratings, including upgrades to Buy and Outperform. Parker-Hannifin maintains consistent Overweight and Buy ratings but lacks upgrades. Eaton’s higher-grade upgrades may signal stronger institutional conviction.
Risks specific to each company
The following categories identify critical pressure points and systemic threats facing Eaton Corporation plc and Parker-Hannifin Corporation in the 2026 market environment:
1. Market & Competition
Eaton Corporation plc
- Faces intense competition in power management and aerospace sectors; premium valuation risks market share pressure.
Parker-Hannifin Corporation
- Competes broadly in motion and control technologies; higher net margin suggests stronger pricing power.
2. Capital Structure & Debt
Eaton Corporation plc
- Moderate debt levels with favorable debt-to-assets and strong interest coverage support financial stability.
Parker-Hannifin Corporation
- Higher debt-to-equity ratio and weaker interest coverage increase financial risk amid rising rates.
3. Stock Volatility
Eaton Corporation plc
- Beta at 1.18 indicates moderate sensitivity to market swings; wider price range suggests higher volatility.
Parker-Hannifin Corporation
- Slightly higher beta of 1.24 implies marginally greater market sensitivity; narrower price range limits extreme swings.
4. Regulatory & Legal
Eaton Corporation plc
- Operates globally with exposure to electrical and aerospace regulations; compliance costs may rise.
Parker-Hannifin Corporation
- Faces regulatory scrutiny in aerospace and industrial sectors; legal risks moderate but present.
5. Supply Chain & Operations
Eaton Corporation plc
- Broad global supply chains vulnerable to disruptions; operational efficiency supported by asset turnover metrics.
Parker-Hannifin Corporation
- Supply chain complexity increased by diversified product lines; strong fixed asset turnover shows operational strength.
6. ESG & Climate Transition
Eaton Corporation plc
- Power management focus aligns with climate transition trends; pressure to meet evolving ESG standards.
Parker-Hannifin Corporation
- Industrial and aerospace operations face increasing ESG scrutiny; transition risks could impact costs.
7. Geopolitical Exposure
Eaton Corporation plc
- Headquarters in Ireland exposes it to EU regulatory shifts and trade tensions.
Parker-Hannifin Corporation
- US-based with global operations; geopolitical risks include tariffs and supply chain disruptions.
Which company shows a better risk-adjusted profile?
Eaton’s strongest risk lies in market valuation and competitive pressure, while Parker-Hannifin faces higher financial leverage risks. Eaton’s superior interest coverage and lower debt-to-assets ratio give it a more resilient capital structure. Parker-Hannifin’s higher Piotroski score signals stronger financial health but its weaker liquidity ratios are a caution. Overall, Eaton presents a better risk-adjusted profile supported by safer leverage metrics and solid operational efficiency in 2026.
Final Verdict: Which stock to choose?
Eaton Corporation plc’s superpower lies in its ability to generate consistent value through a growing ROIC well above its cost of capital. This cash-efficient machine delivers strong returns despite a premium valuation, though its moderate liquidity signals a point of vigilance. Eaton fits best in portfolios targeting steady, long-term growth with an appetite for some valuation risk.
Parker-Hannifin Corporation commands a strategic moat rooted in superior operating margins and robust free cash flow yield, supported by solid balance sheet metrics. Its faster recent price acceleration and higher profitability margins offer a safer profile relative to Eaton. Parker-Hannifin suits GARP investors seeking growth with a better cushion against market volatility.
If you prioritize enduring value creation and operational efficiency, Eaton outshines thanks to its superior capital returns and stable growth trajectory. However, if you seek a blend of growth and defensive stability, Parker-Hannifin offers better downside protection with strong free cash flow and margin expansion despite a somewhat higher leverage. Each appeals to distinct investor avatars with differing risk tolerances and time horizons.
Disclaimer: Investment carries a risk of loss of initial capital. The past performance is not a reliable indicator of future results. Be sure to understand risks before making an investment decision.
Go Further
I encourage you to read the complete analyses of Eaton Corporation plc and Parker-Hannifin Corporation to enhance your investment decisions: