Home > Comparison > Industrials > ETN vs OTIS
The strategic rivalry between Eaton Corporation plc and Otis Worldwide Corporation shapes the industrial machinery landscape. Eaton, a diversified power management giant, delivers complex electrical and aerospace components. Otis focuses on elevator and escalator manufacturing with a vast service network. This contrast highlights a battle between integrated industrial solutions and specialized infrastructure services. This analysis aims to identify which business model offers superior risk-adjusted returns for a balanced, diversified portfolio in 2026.
Table of contents
Companies Overview
Eaton Corporation plc and Otis Worldwide Corporation dominate critical segments of the industrial machinery market.
Eaton Corporation plc: Global Power Management Leader
Eaton stands as a power management powerhouse, generating revenue through electrical components, aerospace systems, vehicle technologies, and eMobility solutions. Its 2026 strategy emphasizes innovation in power distribution and hybrid vehicle systems, aiming to enhance energy efficiency and sustainability across industries worldwide. This diverse portfolio underpins Eaton’s solid market position.
Otis Worldwide Corporation: Elevator and Escalator Specialist
Otis focuses on vertical transportation, delivering elevators, escalators, and moving walkways globally. Its revenue stems from new equipment sales and extensive service contracts, supported by a vast network of 34,000 service mechanics. In 2026, Otis prioritizes service modernization and expanding maintenance offerings to boost reliability and customer retention in urban infrastructure.
Strategic Collision: Similarities & Divergences
Both companies excel in industrial machinery but diverge sharply in scope and approach. Eaton adopts a broad, diversified power systems model, while Otis pursues a focused, service-driven elevator ecosystem. Their primary battleground is infrastructure modernization, with Eaton targeting power management innovations and Otis enhancing transport reliability. These distinct profiles reflect contrasting risk exposures and growth vectors for investors.
Income Statement Comparison
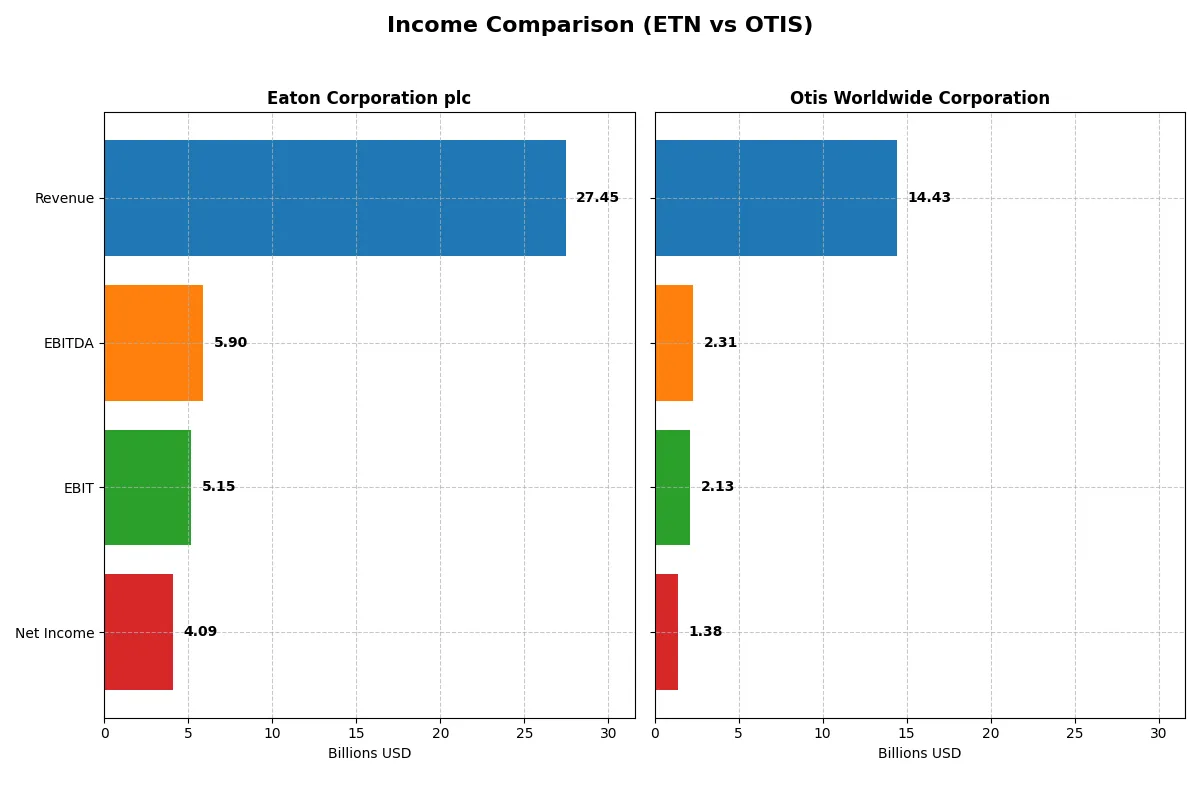
This data dissects the core profitability and scalability of both corporate engines to reveal who dominates the bottom line:
| Metric | Eaton Corporation plc (ETN) | Otis Worldwide Corporation (OTIS) |
|---|---|---|
| Revenue | 27.4B | 14.4B |
| Cost of Revenue | 17.1B | 10.1B |
| Operating Expenses | 5.1B | 2.2B |
| Gross Profit | 10.3B | 4.4B |
| EBITDA | 5.9B | 2.3B |
| EBIT | 5.1B | 2.1B |
| Interest Expense | 264M | 196M |
| Net Income | 4.1B | 1.4B |
| EPS | 10.49 | 3.53 |
| Fiscal Year | 2025 | 2025 |
Income Statement Analysis: The Bottom-Line Duel
This income statement comparison reveals the true efficiency and profitability of Eaton Corporation plc and Otis Worldwide Corporation over recent years.
Eaton Corporation plc Analysis
Eaton’s revenue climbed steadily from $19.6B in 2021 to $27.4B in 2025, with net income nearly doubling from $2.1B to $4.1B. Its gross margin improved to 37.6%, reflecting strong cost control. The net margin at 14.9% remains robust, highlighting efficient operations and healthy earnings momentum in 2025.
Otis Worldwide Corporation Analysis
Otis’s revenue stayed roughly flat around $14B from 2021 to 2025, with net income rising modestly from $1.25B to $1.38B. The gross margin at 30.3% and net margin near 9.6% show consistent profitability but weaker scale benefits. Recent net income growth slowed, with a noticeable dip in earnings per share in 2025.
Verdict: Margin Power vs. Revenue Scale
Eaton dominates with superior revenue growth, higher margins, and nearly double net income compared to Otis. Eaton’s expanding scale and margin improvement signal better capital allocation and operational leverage. Otis appeals for steady cash flow but lacks Eaton’s growth thrust. For investors, Eaton’s profile offers stronger fundamental momentum and efficiency.
Financial Ratios Comparison
These vital ratios act as a diagnostic tool to expose the underlying fiscal health, valuation premiums, and capital efficiency of the companies analyzed:
| Ratios | Eaton Corporation plc (ETN) | Otis Worldwide Corporation (OTIS) |
|---|---|---|
| ROE | 21.1% | -25.7% |
| ROIC | 13.1% | 40.7% |
| P/E | 30.2 | 24.8 |
| P/B | 6.37 | -6.38 |
| Current Ratio | 1.32 | 0.85 |
| Quick Ratio | 0.81 | 0.77 |
| D/E (Debt-to-Equity) | 0.54 | -1.62 |
| Debt-to-Assets | 25.5% | 82.1% |
| Interest Coverage | 19.8 | 11.2 |
| Asset Turnover | 0.67 | 1.35 |
| Fixed Asset Turnover | 5.40 | 11.13 |
| Payout ratio | 39.5% | 46.7% |
| Dividend yield | 1.31% | 1.88% |
| Fiscal Year | 2025 | 2025 |
Efficiency & Valuation Duel: The Vital Signs
Financial ratios serve as a company’s DNA, uncovering hidden risks and operational strengths behind the surface numbers.
Eaton Corporation plc
Eaton demonstrates robust profitability with a 21.05% ROE and a strong 14.9% net margin, signaling operational efficiency. Its valuation is stretched, with a P/E of 30.24 and P/B at 6.37, suggesting premium pricing. Eaton returns 1.31% dividend yield, balancing shareholder rewards with steady reinvestment in R&D (around 3% of revenue).
Otis Worldwide Corporation
Otis posts a high ROIC of 40.74% but suffers a negative ROE at -25.67%, reflecting equity challenges. Its valuation is moderate with a P/E near 24.85 and a favorable P/B ratio. Despite a weak current ratio (0.85), Otis delivers a 1.88% dividend yield while focusing on capital efficiency and growth, evident in its strong asset turnover metrics.
Premium Valuation vs. Operational Intensity
Eaton offers stable profitability with a premium valuation, while Otis combines high capital returns with balance sheet risks. Eaton fits investors seeking operational safety; Otis suits those prioritizing aggressive capital deployment despite leverage concerns.
Which one offers the Superior Shareholder Reward?
I observe Eaton Corporation plc (ETN) and Otis Worldwide Corporation (OTIS) take distinct approaches to shareholder rewards. ETN pays a steady dividend yield around 1.3% with a moderate payout ratio near 39-43%. It supplements returns with active buybacks, sustaining a balanced capital allocation strategy. OTIS offers a slightly higher dividend yield near 1.6-1.9%, but carries elevated leverage and a riskier balance sheet. Its payout ratio ranges from 31% to 47%, reflecting a more aggressive distribution stance. Both companies invest heavily in capex and maintain solid free cash flow coverage above 80%, but ETN’s stronger free cash flow per share (around $8.8 vs. OTIS’s $3.6) supports a more sustainable payout and buyback capacity. Given ETN’s conservative leverage, consistent dividend growth, and robust buybacks, I conclude ETN offers a superior total shareholder return profile in 2026. Investors prioritizing stability and prudent capital management should favor ETN over OTIS.
Comparative Score Analysis: The Strategic Profile
The radar chart reveals the fundamental DNA and trade-offs of Eaton Corporation plc and Otis Worldwide Corporation, highlighting their core financial strengths and weaknesses:
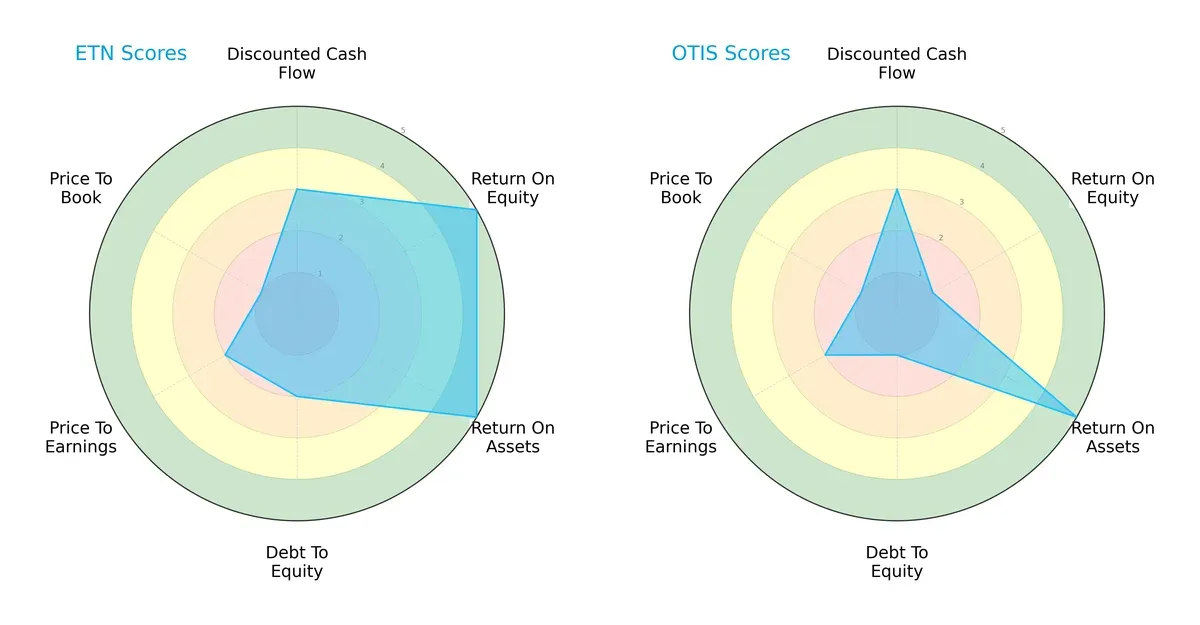
Eaton shows a balanced profile with very favorable ROE and ROA scores, indicating efficient profit generation and asset utilization. Otis matches Eaton in ROA but lags significantly in ROE and debt management. Both firms face valuation challenges, but Eaton’s higher debt-to-equity score signals more financial risk. Overall, Eaton leverages operational efficiency while Otis depends heavily on asset returns.
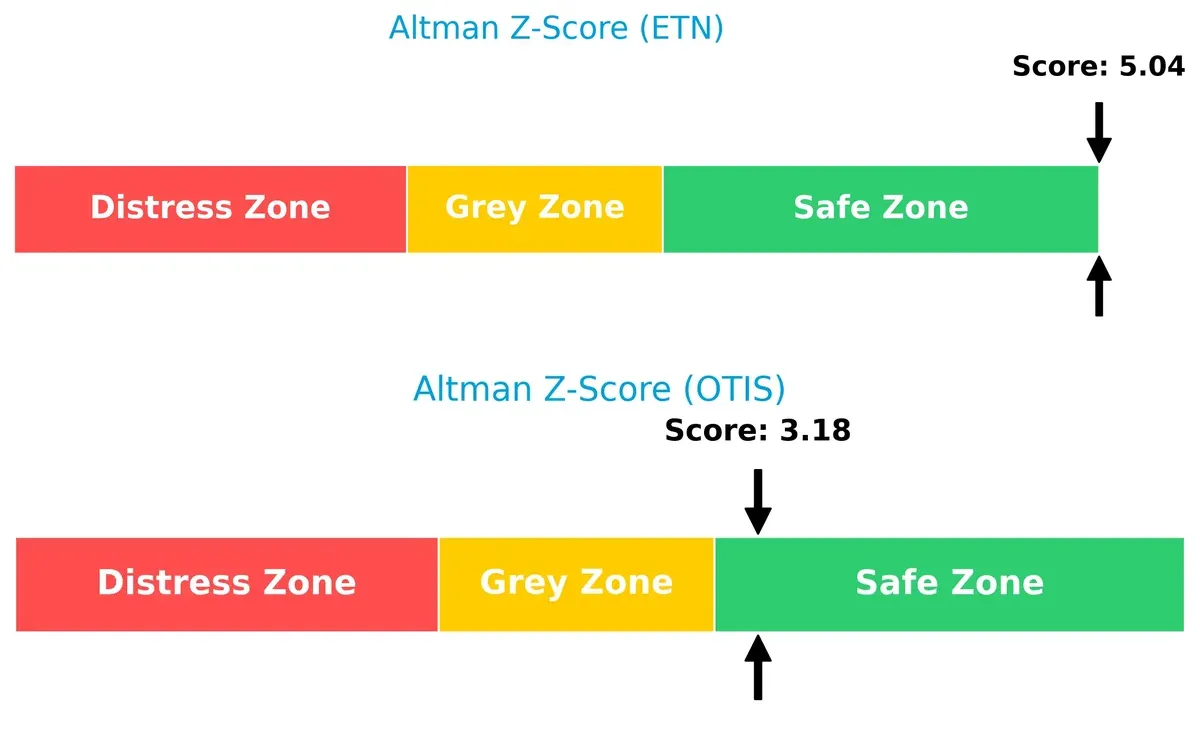
Bankruptcy Risk: Solvency Showdown
Eaton’s Altman Z-Score of 5.04 surpasses Otis’s 3.18, signaling stronger solvency and a safer position against bankruptcy in this cycle:
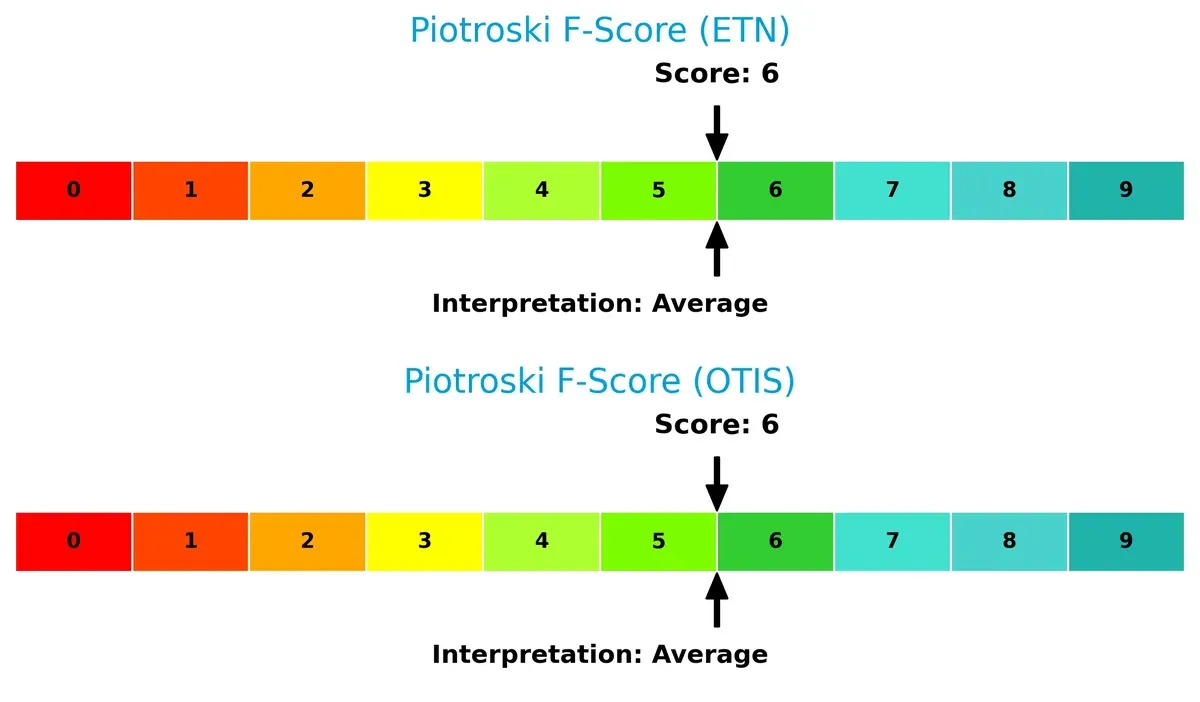
Financial Health: Quality of Operations
Both companies share an average Piotroski F-Score of 6, reflecting decent operational quality without glaring red flags in internal metrics:
How are the two companies positioned?
This section dissects Eaton and Otis’s operational DNA by comparing their revenue distribution and internal dynamics. The goal is to confront their economic moats and identify which model offers the most resilient competitive advantage today.
Revenue Segmentation: The Strategic Mix
This comparison dissects how Eaton Corporation plc and Otis Worldwide Corporation diversify income streams and where their primary sector bets lie:
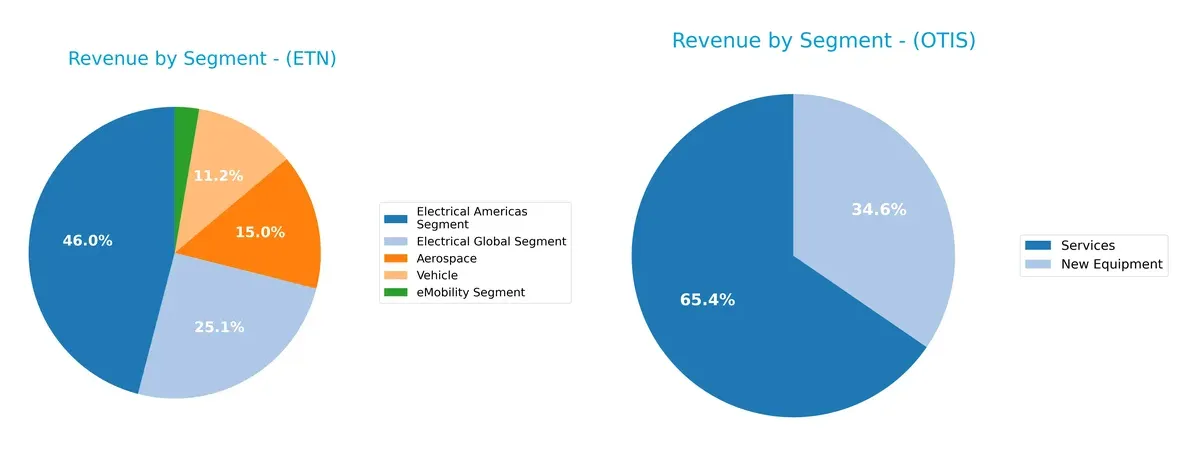
Eaton’s revenue spreads across Aerospace ($3.7B), Electrical Americas ($11.4B), Electrical Global ($6.2B), Vehicle ($2.8B), and eMobility ($669M), showing broad diversification. Otis relies heavily on two segments: Services ($8.9B) and New Equipment ($5.4B). Eaton’s mix anchors on electrical infrastructure and aviation, mitigating concentration risk. Otis pivots on maintenance services and equipment sales, benefiting from ecosystem lock-in but facing dependency on construction cycles.
Strengths and Weaknesses Comparison
This table compares the Strengths and Weaknesses of Eaton Corporation plc (ETN) and Otis Worldwide Corporation (OTIS):
ETN Strengths
- Diverse revenue streams across Aerospace, Electrical Americas, Electrical Global, Vehicle, and eMobility segments
- Strong profitability with 14.9% net margin and 21.05% ROE
- Favorable debt-to-assets ratio at 25.53%
- High fixed asset turnover of 5.4 indicating efficient asset use
- Global presence with significant revenue from US, Europe, Asia Pacific
OTIS Strengths
- High ROIC of 40.74% well above WACC of 7.37% indicates strong capital allocation
- Favorable interest coverage and asset turnover ratios
- Focused market with large Services segment of $9.4B and New Equipment $5.0B
- Favorable price-to-book ratio and debt/equity metrics suggest financial strength
- Geographic revenue diversified with notable China and US exposure
ETN Weaknesses
- Unfavorable valuation multiples with high P/E of 30.24 and P/B of 6.37
- Neutral liquidity ratios including current ratio of 1.32 and quick ratio of 0.81
- Moderate asset turnover of 0.67 may limit growth efficiency
- Heavy reliance on United States market for majority revenue
OTIS Weaknesses
- Negative ROE at -25.67% signals profitability challenges
- Unfavorable liquidity ratios with current ratio of 0.85 and quick ratio of 0.77
- High debt-to-assets ratio of 82.14% increases financial risk
- Concentrated revenue in Services and New Equipment segments limits diversification
Both companies show slightly favorable overall financial health but differ in their strengths. ETN benefits from diversified business segments and solid profitability, while OTIS excels in capital efficiency but faces profitability and liquidity challenges. Each company’s strategic focus and financial profile suggest differing risk and growth dynamics.
The Moat Duel: Analyzing Competitive Defensibility
A structural moat is the only true defense preserving long-term profits from relentless competitive erosion. Let’s dissect the moat mechanics of two industrial giants:
Eaton Corporation plc: Diversified Technological Moat
Eaton leverages a broad portfolio of electrical and vehicle power management products, creating intangible asset moats and cost advantages. Its 4.3% ROIC premium over WACC signals efficient capital use and margin resilience. Expansion in eMobility and aerospace tech could deepen this moat in 2026.
Otis Worldwide Corporation: Service Network Lock-In
Otis builds a formidable switching cost moat through its massive global service network of 34K mechanics and 1,400 branches. With a 33.4% ROIC premium over WACC, Otis converts network effects into stable cash flows. Growth hinges on elevator modernization and infrastructure projects, though slower revenue growth signals caution.
RoIC Supremacy: Diversification vs. Network Effects
Otis’s network-driven moat outpaces Eaton’s diversified asset moat in pure ROIC spread and capital efficiency. Yet, Eaton’s broader product innovation offers a more resilient defense against market shifts. Otis commands deeper pricing power, but Eaton’s scale and tech edge better position it to defend market share long term.
Which stock offers better returns?
The past year reveals divergent paths: Eaton Corporation’s stock surged 25.5%, showing accelerating bullish momentum, while Otis Worldwide declined 8.8%, despite recent minor recovery.
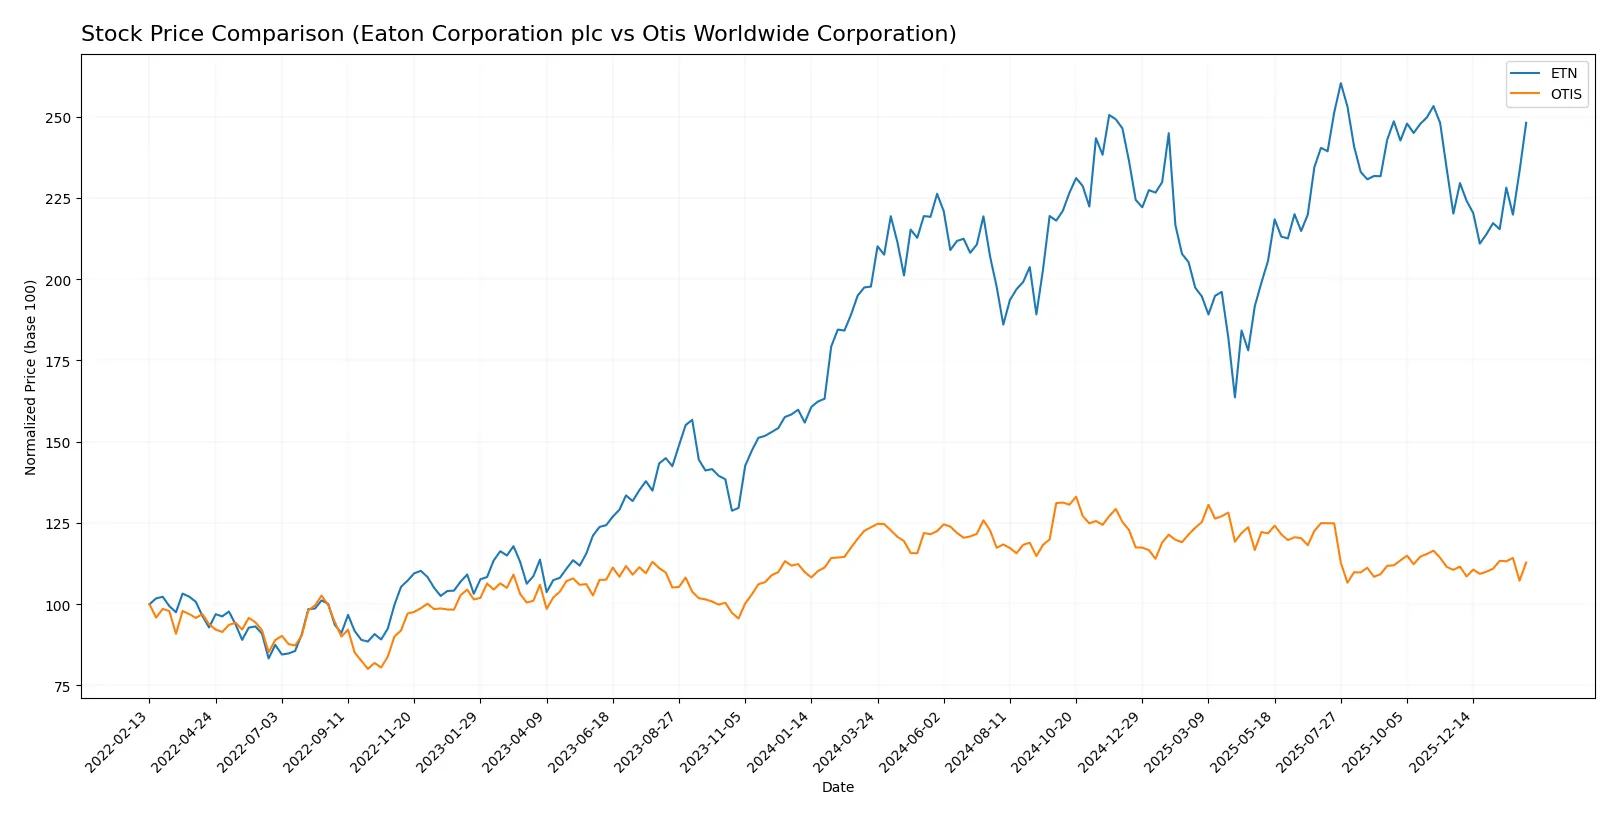
Trend Comparison
Eaton Corporation’s stock rose 25.5% over the past 12 months, marking a clear bullish trend with accelerating gains and a high price volatility of 29.52%. The stock peaked at 392.17 and bottomed at 246.52.
Otis Worldwide’s stock fell 8.8% over the same period, reflecting a bearish trend with accelerating decline. Volatility remained low at 4.88%, with prices ranging between 84.93 and 106.01.
Eaton outperformed Otis in market returns, delivering strong positive momentum versus Otis’s negative trend and limited recent recovery.
Target Prices
Analysts present a balanced target consensus for Eaton Corporation plc and Otis Worldwide Corporation.
| Company | Target Low | Target High | Consensus |
|---|---|---|---|
| Eaton Corporation plc | 295 | 495 | 393.64 |
| Otis Worldwide Corporation | 92 | 109 | 97.75 |
Eaton’s target consensus at $393.64 sits above its current price of $373.82, indicating modest upside potential. Otis’s consensus of $97.75 similarly exceeds its $89.85 trading price, signaling cautious optimism.

Don’t Let Luck Decide Your Entry Point
Optimize your entry points with our advanced ProRealTime indicators. You’ll get efficient buy signals with precise price targets for maximum performance. Start outperforming now!
How do institutions grade them?
The following tables summarize recent institutional grades for Eaton Corporation plc and Otis Worldwide Corporation:
Eaton Corporation plc Grades
The table below shows recent grades and actions from reputable financial institutions for Eaton Corporation plc.
| Grading Company | Action | New Grade | Date |
|---|---|---|---|
| Wells Fargo | maintain | Equal Weight | 2026-02-04 |
| JP Morgan | maintain | Overweight | 2026-01-16 |
| HSBC | upgrade | Buy | 2026-01-16 |
| Morgan Stanley | maintain | Overweight | 2026-01-12 |
| Citigroup | maintain | Buy | 2026-01-12 |
| Barclays | maintain | Equal Weight | 2026-01-07 |
| UBS | downgrade | Neutral | 2026-01-05 |
| Wells Fargo | maintain | Equal Weight | 2025-12-18 |
| Wolfe Research | upgrade | Outperform | 2025-12-09 |
| JP Morgan | maintain | Overweight | 2025-11-06 |
Otis Worldwide Corporation Grades
The table below presents recent grades from established financial firms for Otis Worldwide Corporation.
| Grading Company | Action | New Grade | Date |
|---|---|---|---|
| JP Morgan | maintain | Overweight | 2026-01-16 |
| Wells Fargo | maintain | Equal Weight | 2025-12-15 |
| Barclays | maintain | Underweight | 2025-10-30 |
| JP Morgan | maintain | Overweight | 2025-10-15 |
| Wolfe Research | upgrade | Outperform | 2025-10-08 |
| Wells Fargo | maintain | Equal Weight | 2025-10-06 |
| JP Morgan | maintain | Overweight | 2025-09-18 |
| RBC Capital | maintain | Outperform | 2025-07-28 |
| Wolfe Research | upgrade | Peer Perform | 2025-07-25 |
| JP Morgan | maintain | Overweight | 2025-07-24 |
Which company has the best grades?
Eaton Corporation plc generally earns slightly stronger upgrades, including multiple Buy and Outperform ratings. Otis Worldwide maintains steady Overweight grades but also holds some Underweight and Peer Perform marks. Eaton’s higher-grade momentum may attract investors seeking upside potential, whereas Otis’s stable outlook suggests more moderate expectations.
Risks specific to each company
The following categories identify the critical pressure points and systemic threats facing both Eaton Corporation plc and Otis Worldwide Corporation in the 2026 market environment:
1. Market & Competition
Eaton Corporation plc
- Strong global industrial footprint but faces intense competition in power management and aerospace sectors.
Otis Worldwide Corporation
- Dominates elevator and escalator market yet faces pressure from emerging tech and service innovation rivals.
2. Capital Structure & Debt
Eaton Corporation plc
- Moderate leverage with debt-to-assets at 25.5%, interest coverage strong at 19.5x.
Otis Worldwide Corporation
- High leverage risk: debt-to-assets at 82.1%, weaker liquidity ratios signal financial strain.
3. Stock Volatility
Eaton Corporation plc
- Beta of 1.18 indicates moderate market sensitivity, with a wide price range (232-400).
Otis Worldwide Corporation
- Beta near 1.01 shows lower volatility, but recent price drop (-1.5%) raises caution.
4. Regulatory & Legal
Eaton Corporation plc
- Global operations expose it to complex electrical and aerospace regulations with compliance costs.
Otis Worldwide Corporation
- Subject to safety and building codes worldwide; modernization services face regulatory scrutiny.
5. Supply Chain & Operations
Eaton Corporation plc
- Diverse supply chain risks in electrical and vehicle segments; operational complexity is high.
Otis Worldwide Corporation
- Relies heavily on service network and parts supply; disruption could impair maintenance revenue.
6. ESG & Climate Transition
Eaton Corporation plc
- Strong focus on power efficiency and eMobility aligns well with climate goals but requires ongoing investment.
Otis Worldwide Corporation
- ESG risks from urban infrastructure footprint; transition to greener technologies is slower but steady.
7. Geopolitical Exposure
Eaton Corporation plc
- Operates globally including volatile regions; currency and trade tensions pose risks.
Otis Worldwide Corporation
- Mainly US and China exposure; geopolitical tensions could disrupt key markets.
Which company shows a better risk-adjusted profile?
Eaton faces moderate financial leverage and regulatory complexity but benefits from strong profitability and balance sheet safety. Otis struggles with high debt and liquidity risks despite operational efficiency. Eaton’s Altman Z-Score of 5.04 versus Otis’s 3.18 confirms Eaton’s safer financial zone. Otis’s high debt-to-assets ratio (82%) is a red flag, while Eaton’s better interest coverage and diversified segments provide resilience. Recent market volatility and leverage disparities tilt the risk-adjusted profile in Eaton’s favor.
Final Verdict: Which stock to choose?
Eaton Corporation’s superpower lies in its consistent value creation, driven by a robust and growing ROIC well above its cost of capital. This efficiency fuels solid profitability and resilient growth. A point of vigilance is its relatively high valuation multiples, which may pressure returns if growth slows. Eaton fits well in aggressive growth portfolios seeking durable industrial leaders.
Otis Worldwide commands a strategic moat through its exceptional capital efficiency and recurring revenue from maintenance services. Its financial profile reflects strong asset turnover and stable free cash flow yield, though higher leverage and weaker liquidity suggest greater risk compared to Eaton. Otis aligns with GARP investors who value steady cash flow with a reasonable growth premium.
If you prioritize long-term value creation and are comfortable with premium valuations, Eaton outshines as the compelling choice due to its expanding profitability and financial strength. However, if you seek a more conservative growth approach with steady cash flow and operational efficiency, Otis offers better stability despite its leverage concerns. Each scenario suits distinct investor risk tolerances and strategic goals.
Disclaimer: Investment carries a risk of loss of initial capital. The past performance is not a reliable indicator of future results. Be sure to understand risks before making an investment decision.
Go Further
I encourage you to read the complete analyses of Eaton Corporation plc and Otis Worldwide Corporation to enhance your investment decisions: