Home > Comparison > Industrials > ETN vs NDSN
The strategic rivalry between Eaton Corporation plc and Nordson Corporation shapes the industrial machinery sector’s evolution. Eaton operates as a diversified power management and aerospace giant, leveraging scale and broad product lines. Nordson focuses on precision dispensing and coating technologies, emphasizing innovation and niche markets. This analysis pits scale against specialization to identify which trajectory offers superior risk-adjusted returns for diversified investors navigating industrial sector dynamics in 2026.
Table of contents
Companies Overview
Eaton Corporation plc and Nordson Corporation stand as pivotal players in the industrial machinery sector, shaping critical infrastructure globally.
Eaton Corporation plc: Global Power Management Leader
Eaton dominates as a power management company with a broad portfolio spanning electrical components, aerospace systems, and vehicle powertrains. Its core revenue stems from diversified segments including electrical distribution, aerospace hydraulics, and eMobility solutions. In 2026, Eaton sharpens its strategic focus on expanding its eMobility and power quality offerings to capture growing demand in industrial electrification.
Nordson Corporation: Precision Dispensing Specialist
Nordson excels as an industrial machinery manufacturer specializing in precision dispensing and coating systems for adhesives, polymers, and specialty fluids. It generates revenue from two main segments—Industrial Precision Solutions and Advanced Technology Solutions—serving packaging, semiconductor, and medical markets. In 2026, Nordson prioritizes innovation in automated dispensing and advanced inspection technologies to consolidate its niche leadership.
Strategic Collision: Similarities & Divergences
Both companies emphasize industrial innovation but diverge in scope—Eaton pursues a broad, diversified platform while Nordson focuses on high-precision, specialized systems. The battleground lies in automation and advanced manufacturing solutions where power management meets precision fluid control. Their distinct profiles appeal differently: Eaton offers scale and diversification; Nordson delivers targeted technological expertise.
Income Statement Comparison
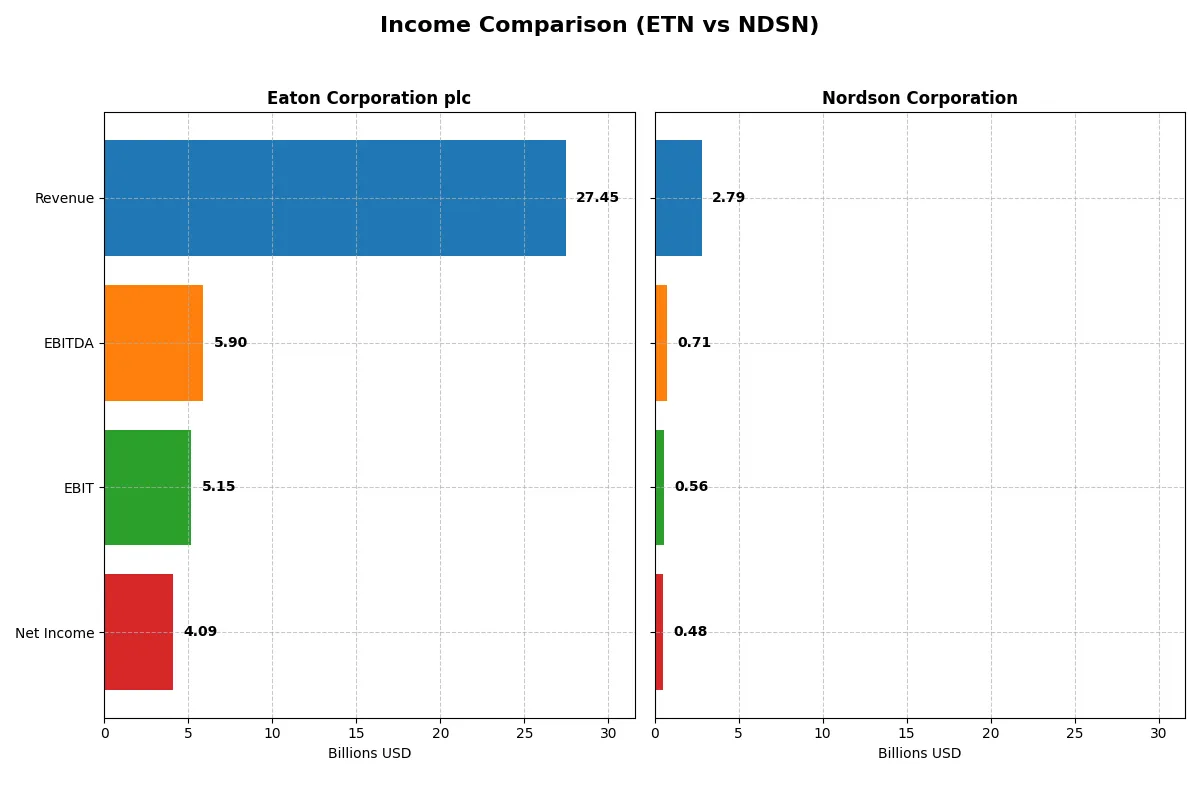
This data dissects the core profitability and scalability of both corporate engines to reveal who dominates the bottom line:
| Metric | Eaton Corporation plc (ETN) | Nordson Corporation (NDSN) |
|---|---|---|
| Revenue | 27.4B | 2.79B |
| Cost of Revenue | 17.1B | 1.25B |
| Operating Expenses | 5.08B | 828M |
| Gross Profit | 10.3B | 1.54B |
| EBITDA | 5.9B | 712M |
| EBIT | 5.15B | 561M |
| Interest Expense | 264M | 101M |
| Net Income | 4.09B | 484M |
| EPS | 10.49 | 8.56 |
| Fiscal Year | 2025 | 2025 |
Income Statement Analysis: The Bottom-Line Duel
The following income statement comparison reveals which company delivers superior operational efficiency and bottom-line strength through their financial performance.
Eaton Corporation plc Analysis
Eaton’s revenue surged from $19.6B in 2021 to $27.4B in 2025, reflecting robust growth. Net income nearly doubled, reaching $4.09B in 2025. The company sustains solid gross (37.6%) and net margins (14.9%), with operating efficiency improving alongside a 10.3% revenue jump last year. Its 2025 momentum signals strong profit conversion amid expanding scale.
Nordson Corporation Analysis
Nordson’s revenue advanced steadily to $2.79B in 2025, up from $2.36B in 2021. Net income grew modestly to $484M with a healthy net margin of 17.4%. Despite a slight EBIT decline last year, gross margin remains high at 55.2%. The company maintains disciplined cost control, though recent earnings momentum shows mixed efficiency signals compared to Eaton.
Margin Power vs. Revenue Scale
Eaton demonstrates stronger top-line expansion and nearly 91% net income growth over five years, while Nordson delivers superior gross margin but slower earnings growth. Eaton’s scale and improving operating leverage provide a clearer fundamental edge. Investors seeking growth backed by efficient margin expansion will find Eaton’s profile more compelling.
Financial Ratios Comparison
These vital ratios act as a diagnostic tool to expose the underlying fiscal health, valuation premiums, and capital efficiency of each company:
| Ratios | Eaton Corporation plc (ETN) | Nordson Corporation (NDSN) |
|---|---|---|
| ROE | 21.1% | 15.9% |
| ROIC | 13.1% | 10.5% |
| P/E | 30.2 | 27.1 |
| P/B | 6.37 | 4.31 |
| Current Ratio | 1.32 | 1.64 |
| Quick Ratio | 0.81 | 1.05 |
| D/E (Debt-to-Equity) | 0.54 | 0.69 |
| Debt-to-Assets | 25.5% | 35.4% |
| Interest Coverage | 19.8 | 7.04 |
| Asset Turnover | 0.67 | 0.47 |
| Fixed Asset Turnover | 5.40 | 4.70 |
| Payout Ratio | 39.5% | 37.0% |
| Dividend Yield | 1.31% | 1.36% |
| Fiscal Year | 2025 | 2025 |
Efficiency & Valuation Duel: The Vital Signs
Financial ratios act as a company’s DNA, exposing hidden risks and operational strengths that shape investment decisions.
Eaton Corporation plc
Eaton posts a strong 21.05% ROE and 14.9% net margin, demonstrating robust profitability. Its P/E of 30.24 signals a stretched valuation compared to sector norms. Eaton delivers modest 1.31% dividend yield, balancing shareholder returns with steady reinvestment in R&D at 3% of revenue, fueling long-term growth.
Nordson Corporation
Nordson shows a solid 15.92% ROE and a superior 17.35% net margin, highlighting efficient operations. The P/E of 27.1 suggests a somewhat expensive stock, yet lower than Eaton’s. It offers a slightly higher dividend yield of 1.36%, while maintaining favorable liquidity and reinvesting selectively in innovation to support incremental growth.
Operational Efficiency vs. Valuation Stretch
Nordson offers a more favorable liquidity profile and better margin efficiency, though at a slightly expensive valuation. Eaton boasts higher returns on equity but trades at a more stretched premium. Investors seeking robust profitability with growth reinvestment may prefer Eaton, while those valuing operational safety and cash flow might lean towards Nordson.
Which one offers the Superior Shareholder Reward?
I see Eaton Corporation (ETN) offers a consistent 1.3% dividend yield with a moderate 39% payout ratio, balancing dividends with steady buybacks. Nordson Corporation (NDSN) pays a similar 1.3% yield but with a lower 35% payout ratio and more intense buyback activity, supported by higher free cash flow coverage. Historically, NDSN’s reinvestment into growth and efficient capital allocation fuel stronger margins and cash flow. I find NDSN’s distribution model more sustainable and attractive for total shareholder return in 2026.
Comparative Score Analysis: The Strategic Profile
The radar chart reveals the fundamental DNA and trade-offs of Eaton Corporation plc and Nordson Corporation, highlighting their strategic financial strengths and weaknesses:
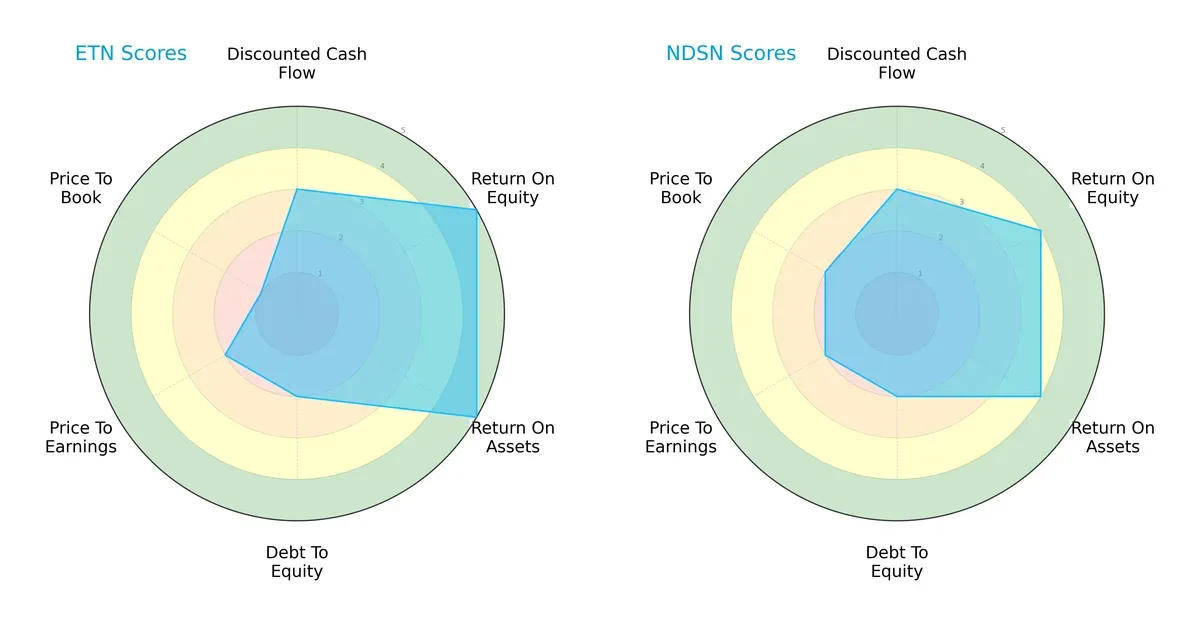
Eaton demonstrates superior profitability with higher ROE (5 vs. 4) and ROA (5 vs. 4) scores, showing efficient capital and asset use. Nordson offers a slightly more balanced valuation profile, scoring better on price-to-book (2 vs. 1). Both share moderate DCF and debt-to-equity scores, but Eaton’s valuation metrics are notably weaker, signaling potential overvaluation risks. Overall, Eaton relies on operational efficiency while Nordson maintains steadier valuation discipline.
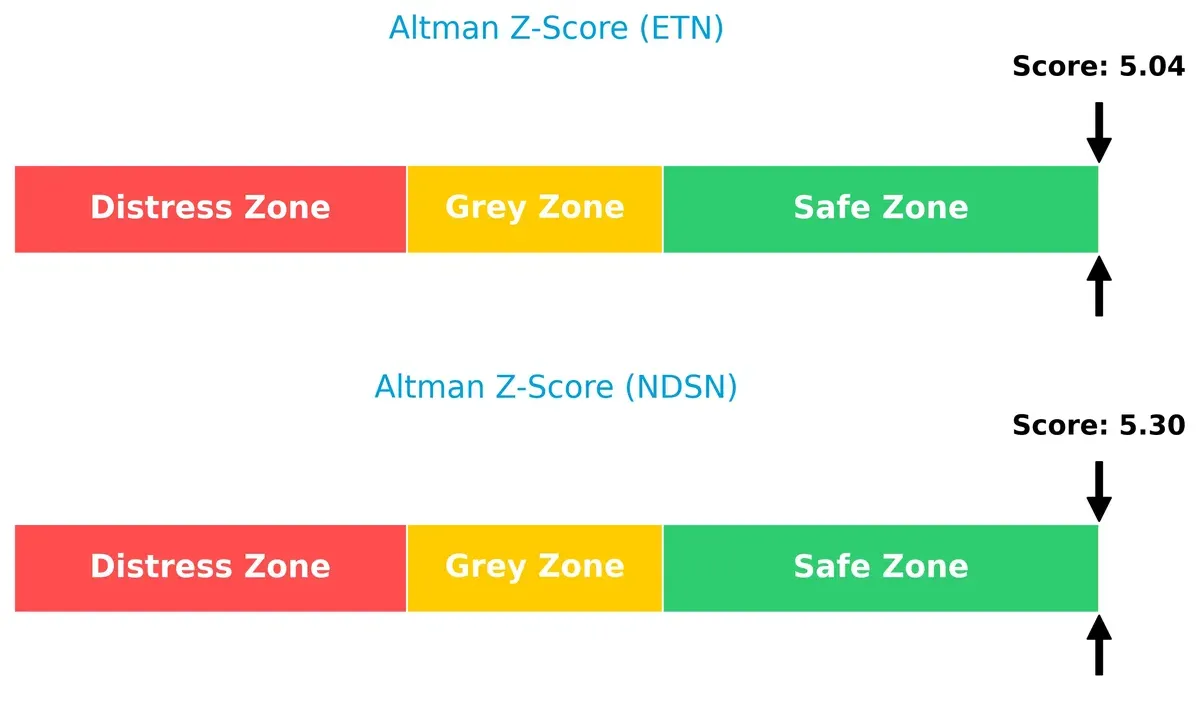
Bankruptcy Risk: Solvency Showdown
Eaton’s Altman Z-Score of 5.04 versus Nordson’s 5.30 places both firms firmly in the safe zone, indicating low bankruptcy risk and strong solvency in this cycle:
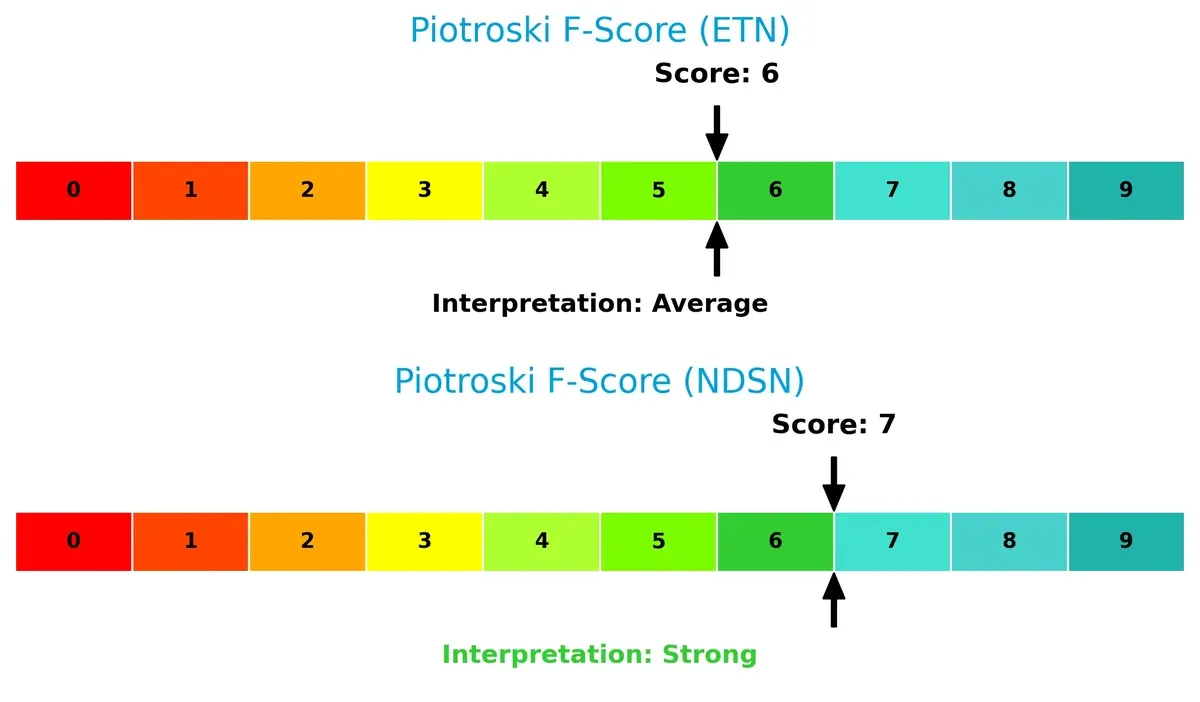
Financial Health: Quality of Operations
Nordson’s Piotroski F-Score of 7 outperforms Eaton’s 6, suggesting stronger internal financial health and operational quality. Eaton’s slightly lower score may hint at emerging red flags in profitability or liquidity metrics:
How are the two companies positioned?
This section dissects Eaton and Nordson’s operational DNA by comparing their revenue distribution and internal dynamics. Our goal is to confront their economic moats and identify which model delivers the most resilient, sustainable competitive advantage today.
Revenue Segmentation: The Strategic Mix
This visual comparison dissects how Eaton Corporation plc and Nordson Corporation diversify their income streams and where their primary sector bets lie:
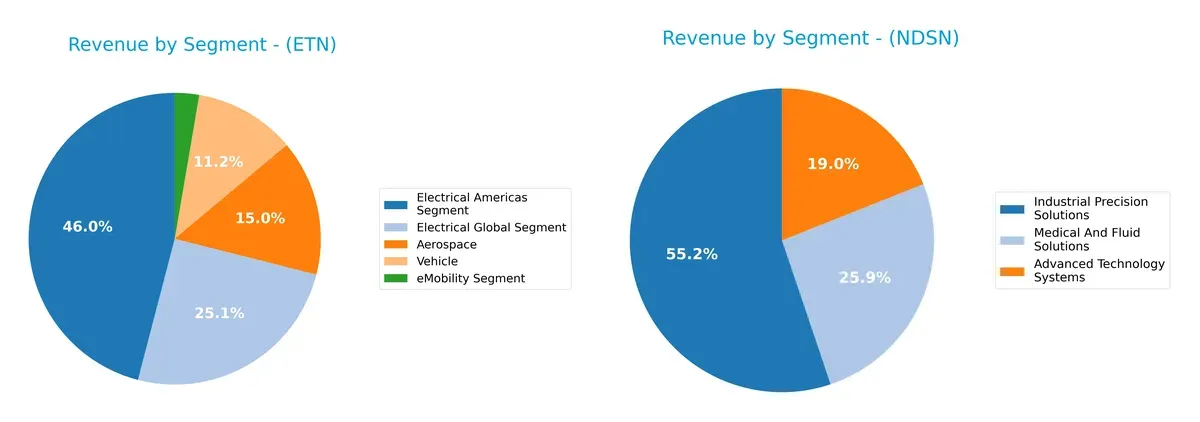
Eaton anchors its revenue in Electrical Americas ($11.4B) and Electrical Global ($6.2B), showing a broad industrial footprint. Aerospace ($3.7B) and Vehicle ($2.8B) segments add geographic and sector diversity. Nordson relies heavily on Industrial Precision Solutions ($1.48B), with smaller contributions from Medical And Fluid Solutions ($695M) and Advanced Technology Systems ($510M). Eaton’s diversified portfolio reduces concentration risk, while Nordson’s focused segmentation indicates niche dominance but higher exposure to demand cycles.
Strengths and Weaknesses Comparison
This table compares the Strengths and Weaknesses of Eaton Corporation plc and Nordson Corporation:
Eaton Corporation plc Strengths
- Broad product diversification across aerospace, electrical, vehicle, and eMobility segments
- Strong profitability with 14.9% net margin and 21.05% ROE
- Favorable debt-to-assets at 25.53% and high interest coverage (19.5)
- Global presence with significant revenue in US, Europe, Asia Pacific, and Latin America
Nordson Corporation Strengths
- Higher net margin at 17.35% and favorable ROIC/WACC spread
- Strong liquidity with current ratio 1.64 and quick ratio 1.05
- Solid global footprint across Americas, Asia Pacific, and Europe
- Favorable interest coverage and efficient fixed asset turnover (4.7)
Eaton Corporation plc Weaknesses
- Elevated valuation multiples (PE 30.24, PB 6.37) indicate stretched market expectations
- Moderate liquidity ratios (current 1.32, quick 0.81) suggest some working capital constraints
- Asset turnover is only neutral at 0.67, limiting operational efficiency
Nordson Corporation Weaknesses
- Higher debt-to-assets ratio (35.36%) could pressure balance sheet flexibility
- Lower asset turnover at 0.47 signals less effective use of assets
- Valuation is also elevated with PE 27.1 and PB 4.31, reflecting market premium
Overall, Eaton shows strength in diversification and strong profitability supported by a balanced capital structure and global scale. Nordson excels in liquidity and operational efficiency but carries higher leverage and lower asset turnover. These traits shape their strategic focus on managing valuation risk and optimizing asset utilization.
The Moat Duel: Analyzing Competitive Defensibility
A structural moat is the only true shield protecting long-term profits from relentless competition erosion. Let’s examine Eaton Corporation and Nordson Corporation’s moats:
Eaton Corporation plc: Wide Economic Moat from Diversified Industrial Power
Eaton’s moat stems from a broad cost advantage and product diversification across power management and eMobility. Its ROIC outpaces WACC by 4.26% with a strong upward trend, signaling durable value creation. Expansion into electrification deepens its competitive edge in 2026.
Nordson Corporation: Precision Niche with Intangible Asset Moat
Nordson relies on specialized dispensing technologies and customer intimacy, creating switching costs distinct from Eaton’s scale. Though it earns a positive spread over WACC, ROIC declined 27%, reflecting pressure on margins. Innovation in advanced fluid control offers growth potential but also risk.
Value Creation vs. Precision Engineering: The Moat Showdown
Eaton’s wider and growing moat outmatches Nordson’s narrower, declining profitability advantage. Eaton’s diversified portfolio and rising ROIC make it better positioned to defend market share against competition in 2026.
Which stock offers better returns?
The past year shows clear bullish trends for both Eaton Corporation plc and Nordson Corporation, with Eaton accelerating from a strong base and Nordson exhibiting a sharper recent rally.
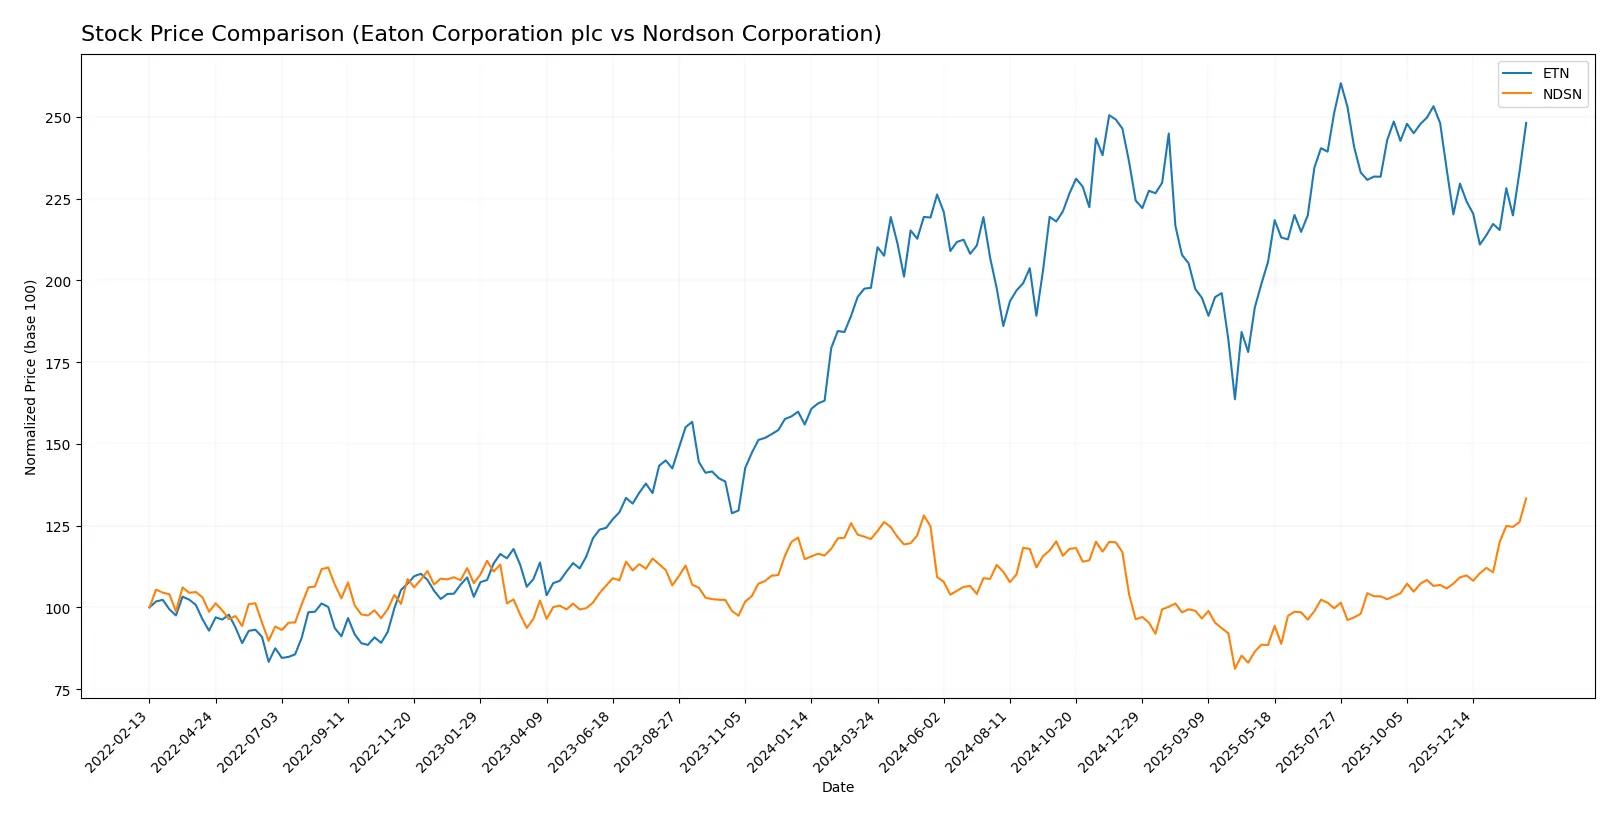
Trend Comparison
Eaton Corporation’s stock rose 25.49% over the past 12 months, showing accelerating bullish momentum and a high volatility level, with prices ranging from 247 to 392.
Nordson Corporation’s stock gained 10.25% over the same period, also bullish with accelerating momentum but lower volatility; recent gains accelerated sharply by 24.28%.
Eaton outperformed Nordson in total yearly returns, despite Nordson’s stronger short-term rally, making Eaton the higher overall market performer.
Target Prices
Analysts show a moderately bullish consensus on both Eaton Corporation plc and Nordson Corporation.
| Company | Target Low | Target High | Consensus |
|---|---|---|---|
| Eaton Corporation plc | 295 | 495 | 393.64 |
| Nordson Corporation | 240 | 295 | 274.17 |
The consensus target for Eaton stands about 5% above the current price of 374, implying moderate upside potential. Nordson’s consensus target is slightly below its current price of 290, signaling limited near-term appreciation.

Don’t Let Luck Decide Your Entry Point
Optimize your entry points with our advanced ProRealTime indicators. You’ll get efficient buy signals with precise price targets for maximum performance. Start outperforming now!
How do institutions grade them?
The following tables summarize recent institutional grades for Eaton Corporation plc and Nordson Corporation:
Eaton Corporation plc Grades
This table shows the latest grades from top financial institutions for Eaton Corporation plc.
| Grading Company | Action | New Grade | Date |
|---|---|---|---|
| Wells Fargo | Maintain | Equal Weight | 2026-02-04 |
| JP Morgan | Maintain | Overweight | 2026-01-16 |
| HSBC | Upgrade | Buy | 2026-01-16 |
| Morgan Stanley | Maintain | Overweight | 2026-01-12 |
| Citigroup | Maintain | Buy | 2026-01-12 |
| Barclays | Maintain | Equal Weight | 2026-01-07 |
| UBS | Downgrade | Neutral | 2026-01-05 |
| Wells Fargo | Maintain | Equal Weight | 2025-12-18 |
| Wolfe Research | Upgrade | Outperform | 2025-12-09 |
| JP Morgan | Maintain | Overweight | 2025-11-06 |
Nordson Corporation Grades
This table summarizes recent grades from recognized financial firms for Nordson Corporation.
| Grading Company | Action | New Grade | Date |
|---|---|---|---|
| DA Davidson | Maintain | Buy | 2025-12-12 |
| Baird | Maintain | Neutral | 2025-12-12 |
| DA Davidson | Maintain | Buy | 2025-12-11 |
| Keybanc | Maintain | Overweight | 2025-12-11 |
| Oppenheimer | Maintain | Outperform | 2025-08-25 |
| Baird | Maintain | Neutral | 2025-08-22 |
| Keybanc | Maintain | Overweight | 2025-07-15 |
| Oppenheimer | Upgrade | Outperform | 2025-05-30 |
| Baird | Maintain | Neutral | 2025-05-30 |
| Keybanc | Maintain | Overweight | 2025-04-08 |
Which company has the best grades?
Nordson consistently earns “Buy,” “Overweight,” and “Outperform” ratings without recent downgrades. Eaton’s ratings vary more, with some downgrades and “Equal Weight” ratings. Nordson’s stronger consensus may suggest higher institutional confidence.
Risks specific to each company
The following categories identify the critical pressure points and systemic threats facing both firms in the 2026 market environment:
1. Market & Competition
Eaton Corporation plc (ETN)
- Operates in diversified power management markets with global scale, facing intense competition from industrial giants.
Nordson Corporation (NDSN)
- Specializes in niche industrial dispensing systems, competing in precision markets with fewer but highly specialized rivals.
2. Capital Structure & Debt
Eaton Corporation plc (ETN)
- Moderate leverage with debt-to-assets at 25.5%, interest coverage strong at 19.5x, signaling solid debt management.
Nordson Corporation (NDSN)
- Higher leverage with debt-to-assets at 35.4%, interest coverage weaker at 5.55x, increasing financial risk under stress.
3. Stock Volatility
Eaton Corporation plc (ETN)
- Beta of 1.18 indicates above-market volatility, reflecting sensitivity to industrial sector cycles.
Nordson Corporation (NDSN)
- Beta near 1.00 shows stock moves roughly in line with the market, suggesting lower relative volatility.
4. Regulatory & Legal
Eaton Corporation plc (ETN)
- Global footprint exposes it to complex regulatory environments, especially in power distribution and aerospace sectors.
Nordson Corporation (NDSN)
- Focused on industrial machinery, faces standard US regulatory scrutiny but less global regulatory complexity.
5. Supply Chain & Operations
Eaton Corporation plc (ETN)
- Large, complex supply chain vulnerable to global disruptions but benefits from scale and diversified sourcing.
Nordson Corporation (NDSN)
- Smaller scale with specialized components, potentially more susceptible to supplier concentration risks.
6. ESG & Climate Transition
Eaton Corporation plc (ETN)
- Power management segments align with climate transition trends; ESG initiatives critical for reputation and compliance.
Nordson Corporation (NDSN)
- Advanced technology solutions support sustainable manufacturing, yet ESG disclosure and initiatives are less pronounced.
7. Geopolitical Exposure
Eaton Corporation plc (ETN)
- Operations span multiple continents, increasing exposure to geopolitical tensions, tariffs, and trade barriers.
Nordson Corporation (NDSN)
- Primarily US-based with some international sales, lower direct geopolitical risk but sensitive to global supply chain shocks.
Which company shows a better risk-adjusted profile?
Eaton’s largest risk lies in its elevated stock volatility and regulatory complexity linked to its global scale. Nordson faces greater financial risk due to higher leverage and weaker interest coverage. However, Nordson’s focused market and lower stock volatility temper these risks. I consider Nordson’s risk-adjusted profile more favorable, supported by its stronger Piotroski score (7 vs. Eaton’s 6) and safer Altman Z-Score, indicating solid financial health despite its debt load. Eaton’s valuation metrics (high P/B and P/E ratios) raise caution, amplifying concerns about overvaluation amid macro uncertainties.
Final Verdict: Which stock to choose?
Eaton Corporation’s superpower lies in its robust value creation, demonstrated by a consistently growing ROIC well above its cost of capital. It excels in operational efficiency and sustainable profitability, though investors should watch its relatively high valuation multiples as a point of vigilance. Eaton suits portfolios seeking steady, long-term industrial growth with moderate risk.
Nordson’s strategic moat centers on its commanding gross margins and strong income quality, reflecting a niche market position and recurring revenue safety. It offers a more conservative financial profile with solid liquidity ratios, though its declining ROIC trend raises caution. Nordson fits well within GARP portfolios targeting quality growth at a reasonable price.
If you prioritize durable competitive advantage and proven capital efficiency, Eaton outshines with superior value creation and margin stability. However, if you seek better liquidity and a more conservative growth path with fewer valuation concerns, Nordson offers better stability despite its slight profitability erosion. Both present compelling but distinct risk-reward scenarios depending on investor strategy.
Disclaimer: Investment carries a risk of loss of initial capital. The past performance is not a reliable indicator of future results. Be sure to understand risks before making an investment decision.
Go Further
I encourage you to read the complete analyses of Eaton Corporation plc and Nordson Corporation to enhance your investment decisions: