Home > Comparison > Industrials > ETN vs NNE
The strategic rivalry between Eaton Corporation plc and Nano Nuclear Energy Inc shapes the future of industrial machinery. Eaton operates as a diversified, capital-intensive power management giant with a broad global footprint. In contrast, Nano Nuclear Energy focuses on cutting-edge microreactor technology, representing a high-risk, innovation-driven growth profile. This analysis will identify which company’s trajectory offers superior risk-adjusted returns, guiding investors seeking stability or breakthrough potential in their portfolios.
Table of contents
Companies Overview
Eaton Corporation and Nano Nuclear Energy both shape critical industrial machinery markets with distinct technological focuses.
Eaton Corporation plc: Global Power Management Leader
Eaton dominates power management with a diverse portfolio spanning electrical components, aerospace systems, and vehicle powertrain solutions. Its revenue flows from industrial, aerospace, and vehicle segments. In 2026, Eaton emphasizes expanding eMobility and hybrid systems, underscoring its strategic pivot toward sustainable, integrated power solutions.
Nano Nuclear Energy Inc: Microreactor Innovator
Nano Nuclear Energy pioneers microreactor technology with its ZEUS solid-core and ODIN low-pressure coolant reactors. Revenue generation targets next-gen nuclear fuel fabrication and consulting services. In 2026, the company focuses on advancing reactor development and fuel supply infrastructure, aiming to disrupt traditional nuclear power with compact, innovative solutions.
Strategic Collision: Similarities & Divergences
Eaton pursues a broad industrial ecosystem with proven power distribution expertise, while Nano Nuclear Energy bets on cutting-edge, compact nuclear reactors. Their competition centers on sustainable energy technologies, albeit from vastly different angles—Eaton through electrification and hybrid systems, Nano Nuclear through nuclear innovation. These contrasting models define distinct risk-reward profiles for investors eyeing industrial transformation.
Income Statement Comparison
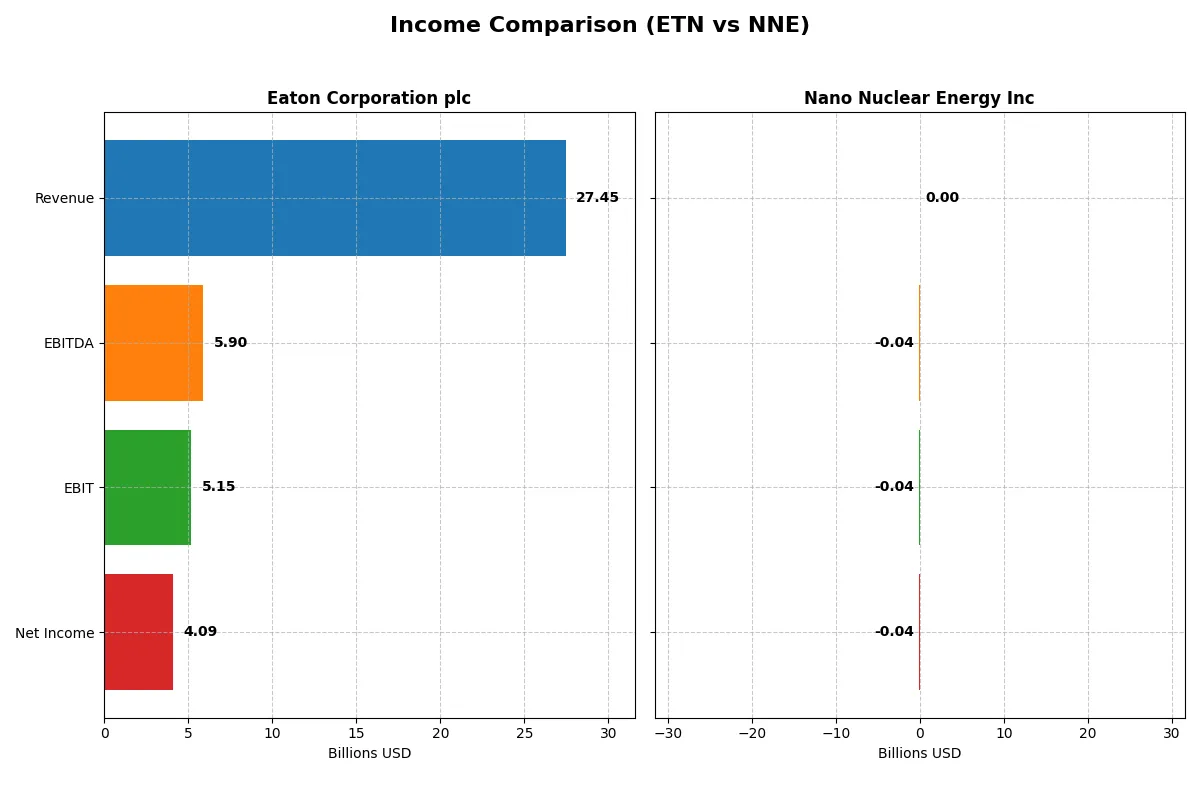
The following data dissects the core profitability and scalability of both corporate engines to reveal who dominates the bottom line:
| Metric | Eaton Corporation plc (ETN) | Nano Nuclear Energy Inc (NNE) |
|---|---|---|
| Revenue | 27.4B | 0 |
| Cost of Revenue | 17.1B | 651K |
| Operating Expenses | 5.08B | 44.4M |
| Gross Profit | 10.3B | -651K |
| EBITDA | 5.9B | -39.4M |
| EBIT | 5.15B | -40.1M |
| Interest Expense | 264M | 0 |
| Net Income | 4.09B | -40.1M |
| EPS | 10.49 | -1.06 |
| Fiscal Year | 2025 | 2025 |
Income Statement Analysis: The Bottom-Line Duel
This income statement comparison reveals the true efficiency and profitability of two very different corporate engines over recent years.
Eaton Corporation plc Analysis
Eaton’s revenue climbed steadily from 19.6B in 2021 to 27.4B in 2025, showing strong growth momentum. Net income nearly doubled from 2.1B to 4.1B, reflecting expanding profitability. Gross margin holds firm at 37.6%, while a healthy net margin of 14.9% confirms robust cost control and operational efficiency in 2025.
Nano Nuclear Energy Inc Analysis
Nano Nuclear Energy has yet to generate revenue, reporting zero sales through 2025. It sustained significant operating losses, with net income deteriorating to -40M in 2025. Negative gross and net margins highlight ongoing development-stage challenges. Despite a slight improvement in EPS growth last year, the company remains loss-making and unprofitable.
Margin Strength vs. Development Losses
Eaton clearly outperforms with substantial revenue and profit growth, supported by strong margins and operational discipline. Nano Nuclear Energy, still in early phases, shows no revenue and persistent losses. For investors, Eaton’s proven profitability offers a more attractive risk-return profile compared to Nano’s high-risk, pre-commercial status.
Financial Ratios Comparison
These vital ratios act as a diagnostic tool to expose the underlying fiscal health, valuation premiums, and capital efficiency of the companies compared below:
| Ratios | Eaton Corporation plc (ETN) | Nano Nuclear Energy Inc (NNE) |
|---|---|---|
| ROE | 21.1% | -0.02% |
| ROIC | 13.1% | -0.02% |
| P/E | 30.2 | -36.5 |
| P/B | 6.37 | 0.007 |
| Current Ratio | 1.32 | 53.5 |
| Quick Ratio | 0.81 | 53.5 |
| D/E | 0.54 | 0.01 |
| Debt-to-Assets | 25.5% | 1.2% |
| Interest Coverage | 19.8 | 0 |
| Asset Turnover | 0.67 | 0 |
| Fixed Asset Turnover | 5.40 | 0 |
| Payout ratio | 39.5% | 0 |
| Dividend yield | 1.31% | 0 |
| Fiscal Year | 2025 | 2025 |
Efficiency & Valuation Duel: The Vital Signs
Financial ratios act as a company’s DNA, exposing operational strengths and hidden risks that shape investor decisions.
Eaton Corporation plc
Eaton delivers strong profitability with a 21.05% ROE and a favorable 14.9% net margin. However, its valuation appears stretched, trading at a P/E of 30.24 and a P/B of 6.37, above sector averages. Eaton supports shareholders with a 1.31% dividend yield, balancing returns and reinvestment in R&D at nearly 3% of revenue.
Nano Nuclear Energy Inc
Nano Nuclear shows weak profitability metrics, with negative ROE and ROIC near -0.02%, reflecting operational struggles. Its valuation metrics are unusual: a negative P/E but very low P/B at 0.01, indicating market skepticism. The company pays no dividends, focusing on preserving capital amid large working capital and negligible asset turnover, signaling high risk and uncertain growth.
Premium Valuation vs. Operational Safety
Eaton offers a better balance of profitability and steady shareholder returns despite a premium valuation. Nano Nuclear’s unfavorable profitability and unusual ratios suggest higher risk with limited operational efficiency. Investors seeking stability may prefer Eaton’s proven financial discipline over Nano Nuclear’s speculative profile.
Which one offers the Superior Shareholder Reward?
I see Eaton Corporation plc (ETN) delivers steady dividends with yields around 1.3%, backed by robust free cash flow and a payout ratio near 40%. ETN complements dividends with consistent buybacks, enhancing shareholder value sustainably. Nano Nuclear Energy Inc (NNE) pays no dividends and reports negative profits, relying entirely on reinvestment in R&D and growth. Its excessive cash ratios and lack of operating cash flow highlight high risk and uncertain returns. For 2026, ETN’s balanced distribution and capital allocation offer a far more attractive and sustainable total return profile than NNE’s speculative model.
Comparative Score Analysis: The Strategic Profile
The radar chart reveals the fundamental DNA and trade-offs of Eaton Corporation plc and Nano Nuclear Energy Inc, highlighting their core financial strengths and weaknesses:
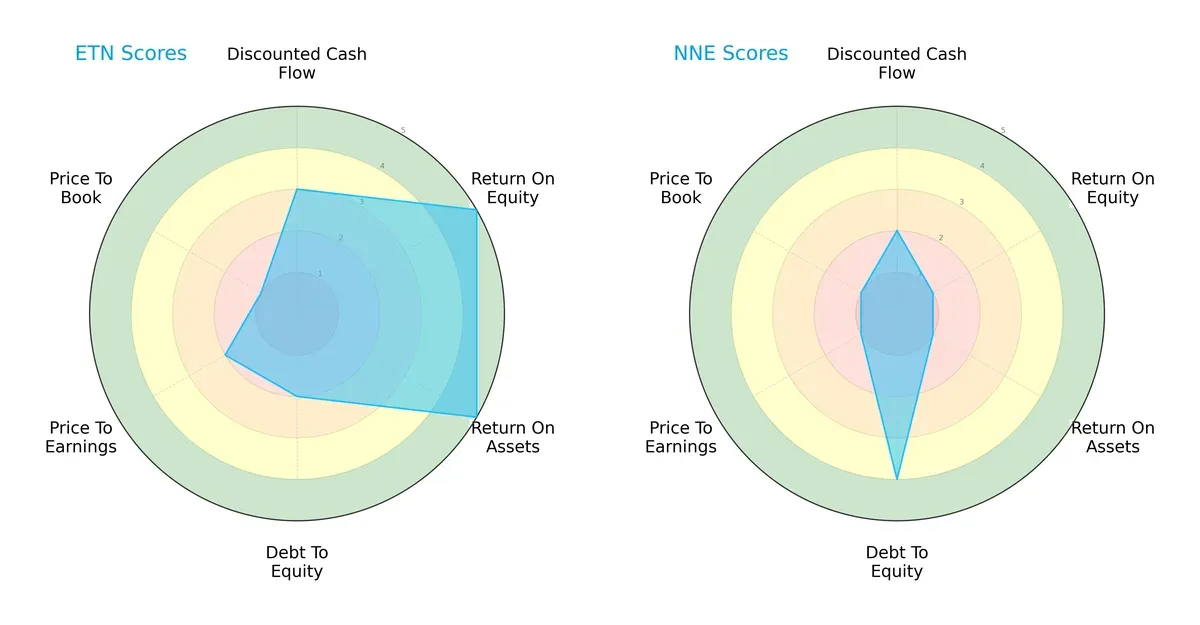
Eaton Corporation shows a balanced profile with very favorable ROE and ROA scores, indicating efficient profit and asset use. However, its debt-to-equity and valuation scores are weak, signaling financial leverage risks and possible overvaluation. Nano Nuclear Energy relies heavily on low debt levels but suffers from poor profitability and valuation metrics. Eaton’s diversified strengths contrast with Nano Nuclear’s narrow edge in leverage management.
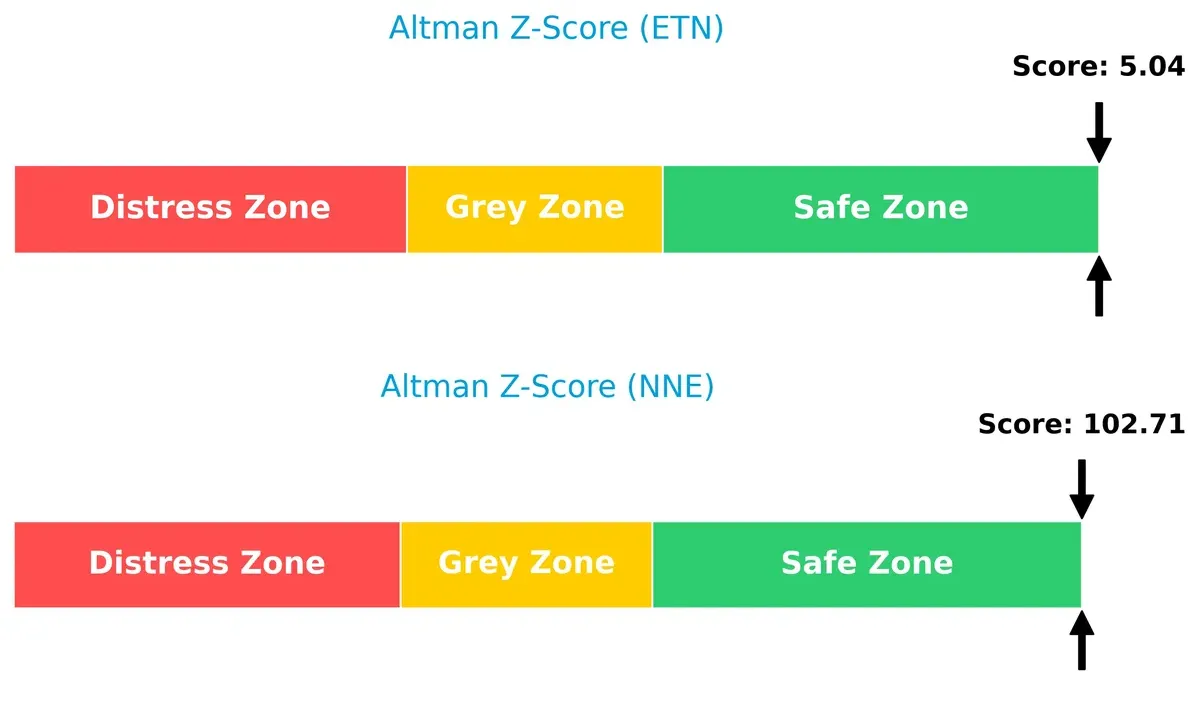
Bankruptcy Risk: Solvency Showdown
The Altman Z-Score gap confirms both companies are in the safe zone, but Nano Nuclear’s extraordinarily high score suggests near-zero bankruptcy risk, while Eaton remains comfortably solvent in this cycle:
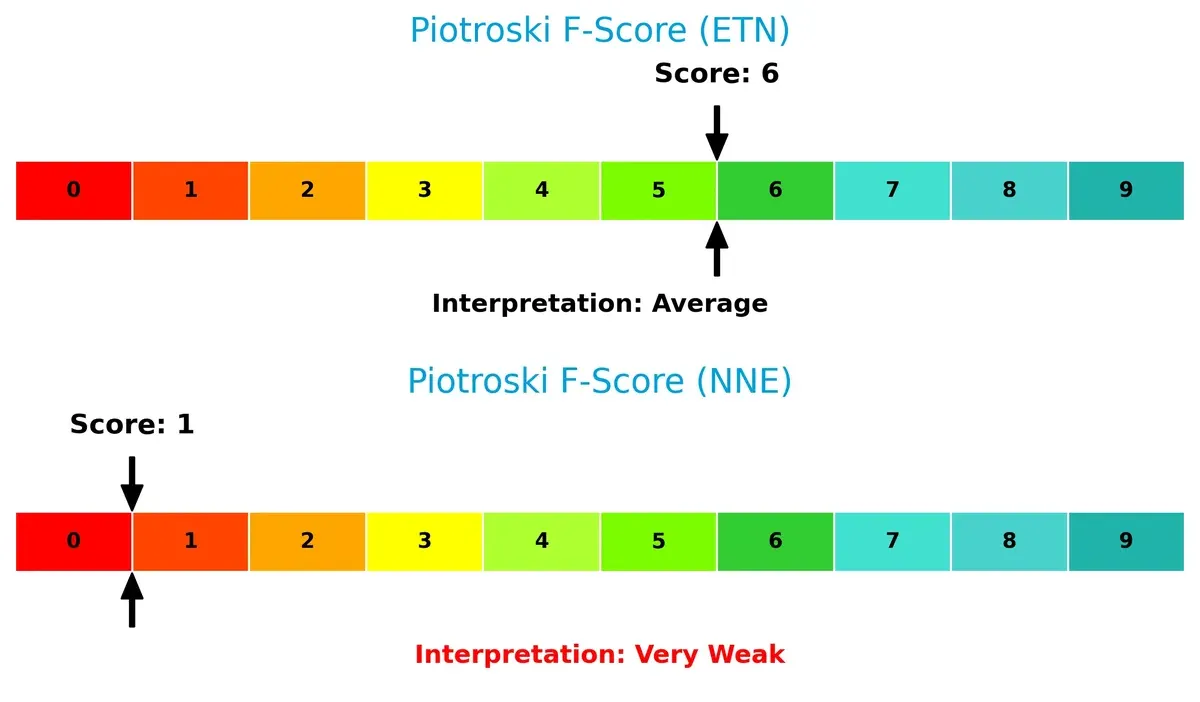
Financial Health: Quality of Operations
The Piotroski F-Score comparison shows Eaton Corporation in solid financial health with an average score of 6, reflecting operational strength. Nano Nuclear’s very weak score of 1 raises red flags about internal financial stability and operational efficiency:
How are the two companies positioned?
This section dissects the operational DNA of ETN and NNE by comparing their revenue distribution and internal strengths and weaknesses. The goal is to confront their economic moats and identify which business model offers the most resilient, sustainable competitive advantage today.
Revenue Segmentation: The Strategic Mix
This visual comparison dissects how Eaton Corporation plc and Nano Nuclear Energy Inc diversify income streams and highlights their primary sector bets:
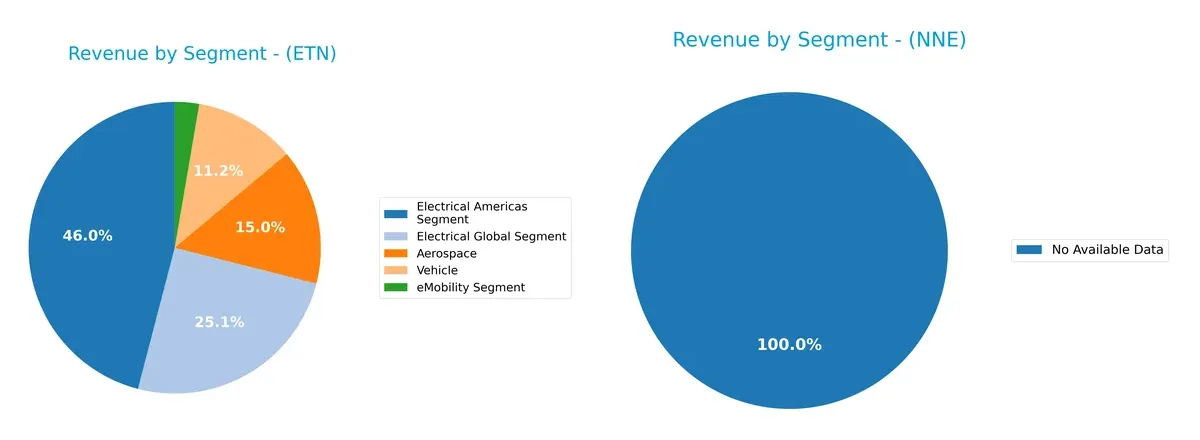
Eaton Corporation plc shows a well-diversified revenue mix with significant contributions from Electrical Americas ($11.4B), Electrical Global ($6.2B), Aerospace ($3.7B), and Vehicle ($2.8B). Nano Nuclear Energy Inc lacks available data, preventing segmentation analysis. Eaton’s broad portfolio reduces concentration risk and anchors it in infrastructure and aerospace sectors, leveraging ecosystem lock-in. This multi-segment approach contrasts with firms reliant on one dominant segment.
Strengths and Weaknesses Comparison
This table compares the strengths and weaknesses of Eaton Corporation plc (ETN) and Nano Nuclear Energy Inc (NNE):
ETN Strengths
- Diverse revenue streams across Aerospace, Electrical, Vehicle, and eMobility segments
- Strong profitability with 14.9% net margin and 21.05% ROE
- Favorable debt metrics with 25.53% debt-to-assets and high interest coverage
NNE Strengths
- Very low debt-to-equity ratio at 0.01
- Favorable price-to-book at 0.01 and price-to-earnings despite negative earnings
- Excellent quick ratio at 53.48 indicating strong short-term liquidity
ETN Weaknesses
- High price multiples with P/E at 30.24 and P/B at 6.37 may imply overvaluation
- Neutral liquidity ratios with current ratio 1.32 and quick ratio 0.81
- Asset turnover moderate at 0.67, limiting capital efficiency
NNE Weaknesses
- Zero profitability with negative ROE and ROIC, net margin at 0%
- High weighted average cost of capital at 13.79%
- Poor operational metrics with zero asset and fixed asset turnover
- Interest coverage at zero and no dividend yield
ETN demonstrates a well-diversified portfolio with solid profitability and conservative leverage. NNE shows strong liquidity and low leverage but faces critical profitability and operational challenges. These contrasts reflect distinct strategic and financial positions for each company.
The Moat Duel: Analyzing Competitive Defensibility
A structural moat is the only shield protecting long-term profits from relentless competition erosion. Let’s dissect how Eaton and Nano Nuclear Energy stand:
Eaton Corporation plc: Diversified Industrial Powerhouse with Proven Efficiency
Eaton’s moat centers on cost advantage and scale, reflected in a robust ROIC 4.3% above WACC and stable 18.8% EBIT margins. Its broad product portfolio and global reach deepen resilience in 2026.
Nano Nuclear Energy Inc: Emerging Tech with Innovation but Unproven Profitability
Nano Nuclear’s moat lies in intangible assets—patented microreactor technology—but it currently sheds value with negative ROIC versus WACC. Promising R&D growth may disrupt markets but profitability remains uncertain.
Scale and Efficiency vs. Innovation Risk
Eaton wields a wider, more sustainable moat through operational scale and capital efficiency. Nano Nuclear’s emerging technology shows potential but lacks the current financial muscle to defend market share effectively.
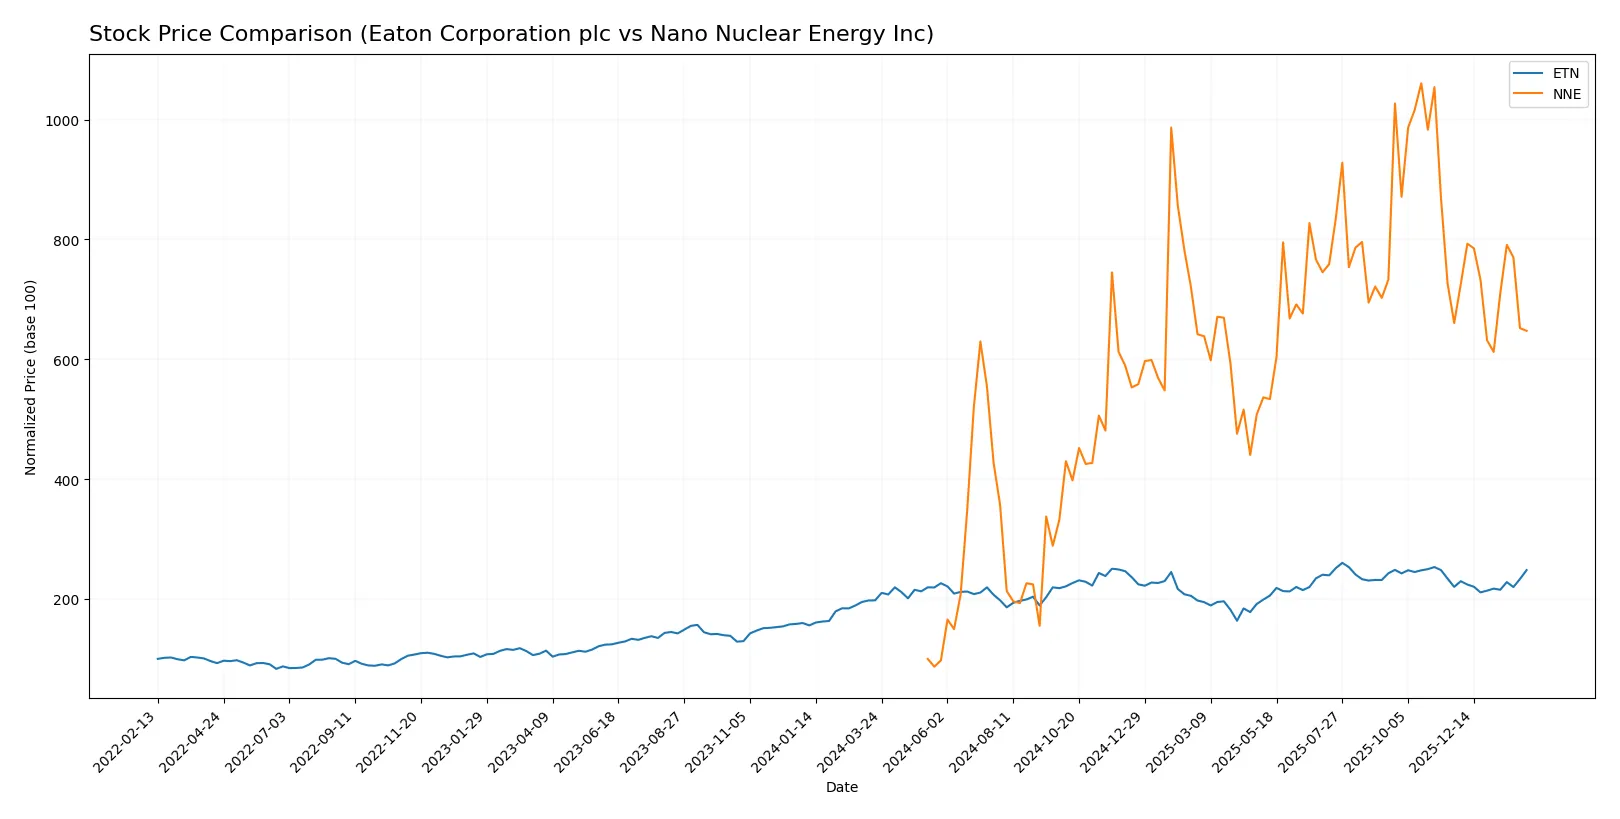
Which stock offers better returns?
Over the past 12 months, both Eaton Corporation plc and Nano Nuclear Energy Inc saw significant price movements, with distinct trading dynamics and shifts in investor sentiment shaping their trajectories.
Trend Comparison
Eaton Corporation plc’s stock rose 25.49% over the past year, marking a bullish trend with accelerating momentum and high volatility, hitting a peak of 392.17 and a low of 246.52.
Nano Nuclear Energy Inc’s stock surged 547.45% over the same period, also bullish but with deceleration. Volatility was lower, with a high of 47.84 and a low of 3.92.
Nano Nuclear Energy Inc delivered the highest market performance, outperforming Eaton Corporation plc by a wide margin in price appreciation.
Target Prices
Analysts show a clear range in target prices for Eaton Corporation plc and Nano Nuclear Energy Inc, reflecting varied growth and risk profiles.
| Company | Target Low | Target High | Consensus |
|---|---|---|---|
| Eaton Corporation plc | 295 | 495 | 394 |
| Nano Nuclear Energy Inc | 50 | 50 | 50 |
Eaton’s consensus target at 394 slightly exceeds its current 374 stock price, indicating moderate upside. Nano Nuclear Energy’s target at 50 substantially surpasses its 29 price, suggesting strong growth expectations but higher risk.

Don’t Let Luck Decide Your Entry Point
Optimize your entry points with our advanced ProRealTime indicators. You’ll get efficient buy signals with precise price targets for maximum performance. Start outperforming now!
How do institutions grade them?
Eaton Corporation plc Grades
Here are the recent institutional grades for Eaton Corporation plc:
| Grading Company | Action | New Grade | Date |
|---|---|---|---|
| Wells Fargo | Maintain | Equal Weight | 2026-02-04 |
| JP Morgan | Maintain | Overweight | 2026-01-16 |
| HSBC | Upgrade | Buy | 2026-01-16 |
| Morgan Stanley | Maintain | Overweight | 2026-01-12 |
| Citigroup | Maintain | Buy | 2026-01-12 |
| Barclays | Maintain | Equal Weight | 2026-01-07 |
| UBS | Downgrade | Neutral | 2026-01-05 |
| Wells Fargo | Maintain | Equal Weight | 2025-12-18 |
| Wolfe Research | Upgrade | Outperform | 2025-12-09 |
| JP Morgan | Maintain | Overweight | 2025-11-06 |
Nano Nuclear Energy Inc Grades
Here are the recent institutional grades for Nano Nuclear Energy Inc:
| Grading Company | Action | New Grade | Date |
|---|---|---|---|
| HC Wainwright & Co. | Maintain | Buy | 2025-08-19 |
| Ladenburg Thalmann | Downgrade | Sell | 2025-08-18 |
| HC Wainwright & Co. | Maintain | Buy | 2025-08-15 |
| HC Wainwright & Co. | Maintain | Buy | 2025-03-31 |
| HC Wainwright & Co. | Maintain | Buy | 2025-01-29 |
| HC Wainwright & Co. | Maintain | Buy | 2024-11-27 |
| Benchmark | Maintain | Buy | 2024-11-07 |
| Benchmark | Maintain | Buy | 2024-07-15 |
| Benchmark | Maintain | Buy | 2024-06-25 |
Which company has the best grades?
Eaton Corporation plc has a mix of Buy, Overweight, and Equal Weight ratings, including upgrades from HSBC and Wolfe Research. Nano Nuclear Energy Inc shows strong Buy consensus but includes a Sell downgrade from Ladenburg Thalmann. Eaton’s grades suggest a more nuanced institutional view, while Nano Nuclear displays broader but slightly more polarized sentiment. Investors should weigh these differences carefully.
Risks specific to each company
The following categories identify the critical pressure points and systemic threats facing both firms in the 2026 market environment:
1. Market & Competition
Eaton Corporation plc (ETN)
- Established industrial player with diverse product lines and global reach. Faces steady competition in power management and aerospace sectors.
Nano Nuclear Energy Inc (NNE)
- Early-stage microreactor tech firm in a niche market. Faces high competition from established nuclear and alternative energy players.
2. Capital Structure & Debt
Eaton Corporation plc (ETN)
- Moderate debt-to-equity ratio (0.54) signals balanced leverage; interest coverage is strong at 19.5x, reducing refinancing risk.
Nano Nuclear Energy Inc (NNE)
- Minimal debt load (D/E 0.01) but no interest coverage due to no earnings; liquidity concerns from extreme current ratio (53.48) suggest inefficiency.
3. Stock Volatility
Eaton Corporation plc (ETN)
- Beta of 1.18 indicates moderate market sensitivity, typical for industrial sector stocks.
Nano Nuclear Energy Inc (NNE)
- Beta of 7.49 shows extreme volatility; stock price swings are highly unpredictable, increasing investor risk.
4. Regulatory & Legal
Eaton Corporation plc (ETN)
- Operates in regulated industrial and aerospace markets with compliance track record; regulatory changes pose moderate risk.
Nano Nuclear Energy Inc (NNE)
- Nuclear technology subject to stringent, evolving regulation; licensing and approval delays represent significant legal risk.
5. Supply Chain & Operations
Eaton Corporation plc (ETN)
- Global manufacturing footprint and supply chains are well-established but exposed to geopolitical tensions and material cost inflation.
Nano Nuclear Energy Inc (NNE)
- Highly specialized supply chain for nuclear fuel and components; early development stage amplifies operational execution risks.
6. ESG & Climate Transition
Eaton Corporation plc (ETN)
- Progressive ESG initiatives in energy efficiency and sustainable products support climate transition alignment.
Nano Nuclear Energy Inc (NNE)
- Nuclear energy offers low-carbon benefits but faces public perception challenges and regulatory ESG hurdles.
7. Geopolitical Exposure
Eaton Corporation plc (ETN)
- Diversified global presence mitigates country-specific risks but still exposed to trade policies and regional instability.
Nano Nuclear Energy Inc (NNE)
- Concentrated U.S. operations reduce geopolitical complexity but increase vulnerability to domestic policy shifts in nuclear energy.
Which company shows a better risk-adjusted profile?
Eaton Corporation exhibits a stronger risk-adjusted profile due to its diversified revenue streams, stable capital structure, and moderate volatility. Nano Nuclear’s key risk lies in its extreme stock volatility and unproven operational model, despite low leverage. Eaton’s Altman Z-score of 5.04 confirms financial safety, whereas Nano Nuclear’s zero earnings and weak Piotroski score highlight foundational weaknesses. These factors make Eaton a more prudent choice in the current market environment.
Final Verdict: Which stock to choose?
Eaton Corporation plc’s superpower lies in its proven ability to create value through disciplined capital allocation and a robust economic moat. It delivers consistent profitability with a growing ROIC well above its cost of capital. A point of vigilance is its relatively high valuation multiples, which may temper near-term upside. Eaton fits well in portfolios seeking Stable Growth with resilience.
Nano Nuclear Energy Inc’s appeal centers on its potential disruptive innovation and extremely low valuation multiples. Its strategic moat is yet unproven, reflected in negative returns and ongoing value erosion. Relative to Eaton, it offers a higher risk profile but could capture outsized gains if its technology commercializes successfully. Nano Nuclear suits Aggressive Speculative portfolios willing to tolerate volatility.
If you prioritize capital preservation and steady value creation, Eaton outshines with its sustainable competitive advantage and consistent earnings power. However, if you seek high-risk, high-reward asymmetric opportunities, Nano Nuclear offers a speculative play on emerging energy technologies despite its current financial struggles. Each scenario demands careful risk management aligned with investor tolerance.
Disclaimer: Investment carries a risk of loss of initial capital. The past performance is not a reliable indicator of future results. Be sure to understand risks before making an investment decision.
Go Further
I encourage you to read the complete analyses of Eaton Corporation plc and Nano Nuclear Energy Inc to enhance your investment decisions: