Home > Comparison > Industrials > ETN vs KAI
The strategic rivalry between Eaton Corporation plc and Kadant Inc. shapes the industrial machinery landscape. Eaton, a diversified power management giant, contrasts with Kadant’s specialized engineered systems focus. This battle highlights the tension between broad-scale industrial solutions and niche technological innovation. I will analyze which company’s trajectory offers superior risk-adjusted returns, guiding investors seeking balanced exposure within the cyclical industrials sector.
Table of contents
Companies Overview
Eaton Corporation plc and Kadant Inc. play pivotal roles in the industrial machinery sector, shaping global industrial efficiency.
Eaton Corporation plc: Power Management Giant
Eaton dominates power management with a broad product portfolio spanning electrical components, aerospace systems, and vehicle technologies. Its core revenue stems from electrical and aerospace segments, focusing on reliability and innovation. In 2026, Eaton’s strategic emphasis lies on expanding its eMobility solutions and enhancing power distribution systems worldwide, reinforcing its market leadership in industrial power management.
Kadant Inc.: Engineered Systems Specialist
Kadant focuses on engineered systems across flow control, industrial processing, and material handling. It generates revenue via fluid-handling equipment, pulping machinery, and biodegradable absorbents. The company prioritizes innovation in processing technologies for packaging and alternative fuels in 2026, leveraging its niche expertise in sustainable industrial solutions to serve specialized markets.
Strategic Collision: Similarities & Divergences
Both firms operate in industrial machinery but diverge sharply in scope and scale. Eaton pursues a diversified, global power management strategy, while Kadant targets specialized engineered systems with a sustainability angle. Their primary battleground is industrial process efficiency, but their investment profiles contrast: Eaton offers broad industrial exposure, whereas Kadant presents a focused niche play with growth tied to green technologies.
Income Statement Comparison
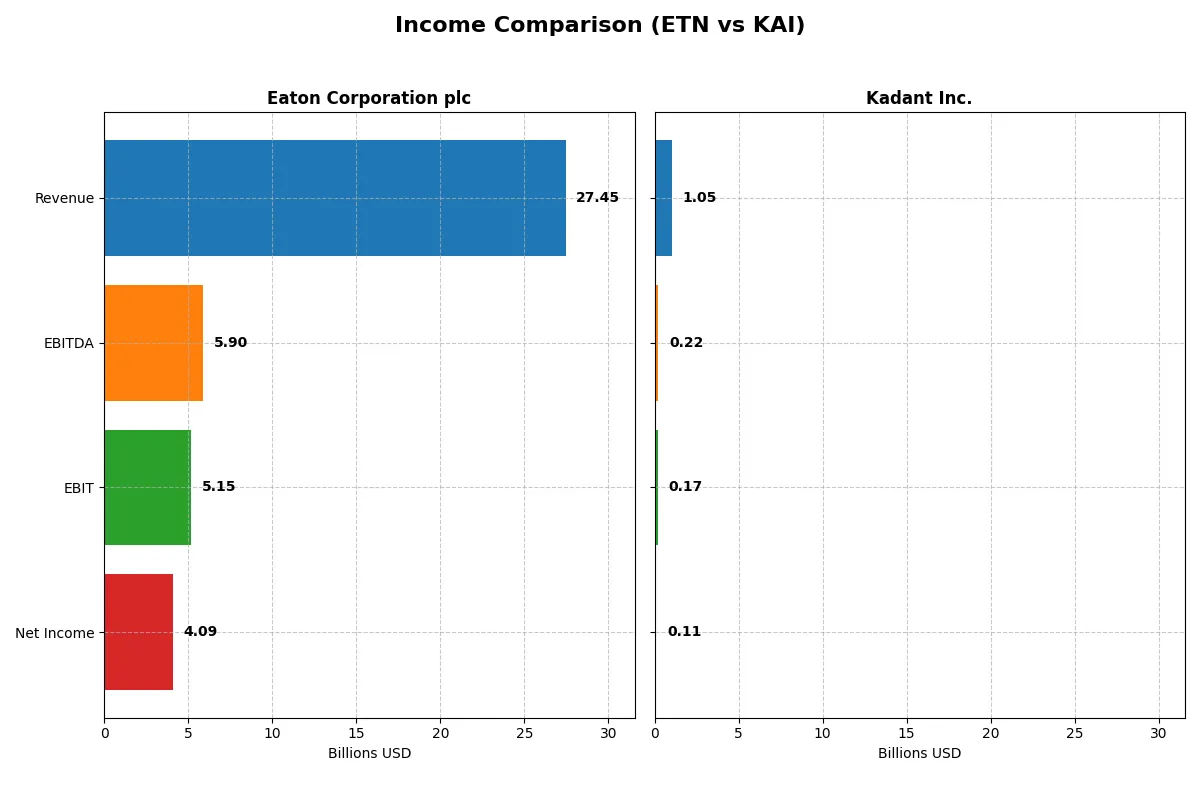
The following data dissects the core profitability and scalability of both corporate engines to reveal who dominates the bottom line:
| Metric | Eaton Corporation plc (ETN) | Kadant Inc. (KAI) |
|---|---|---|
| Revenue | 27.4B | 1.05B |
| Cost of Revenue | 17.1B | 587M |
| Operating Expenses | 5.08B | 294M |
| Gross Profit | 10.3B | 466M |
| EBITDA | 5.9B | 223M |
| EBIT | 5.15B | 173M |
| Interest Expense | 264M | 20M |
| Net Income | 4.09B | 112M |
| EPS | 10.49 | 9.51 |
| Fiscal Year | 2025 | 2024 |
Income Statement Analysis: The Bottom-Line Duel
This income statement comparison reveals which company delivers stronger efficiency and profitability through its core financial performance.
Eaton Corporation plc Analysis
Eaton’s revenue grew steadily from $19.6B in 2021 to $27.4B in 2025, with net income nearly doubling to $4.1B. Gross and net margins remain robust at 37.6% and 14.9%, respectively. The company’s latest fiscal year shows strong momentum, with a 10.3% revenue increase and favorable margin expansion reflecting operational discipline and scale advantages.
Kadant Inc. Analysis
Kadant’s revenue rose from $635M in 2020 to $1.05B in 2024, doubling net income to $112M despite a recent slight dip. Its gross margin of 44.3% surpasses Eaton’s, but a lower net margin of 10.6% suggests higher operating costs. While revenue growth impresses at nearly 10% annually, net margin contraction and EPS decline in 2024 indicate emerging efficiency challenges.
Margin Strength vs. Scale and Momentum
Eaton demonstrates superior scale, consistent margin improvement, and strong bottom-line growth, outpacing Kadant’s smaller but high-margin business. Kadant’s impressive gross margin contrasts with weaker net profitability and recent margin pressures. For investors prioritizing stable earnings and operational leverage, Eaton’s profile offers a more compelling fundamental foundation.
Financial Ratios Comparison
These vital ratios act as a diagnostic tool to expose the underlying fiscal health, valuation premiums, and capital efficiency of Eaton Corporation plc (ETN) and Kadant Inc. (KAI):
| Ratios | Eaton Corporation plc (ETN) | Kadant Inc. (KAI) |
|---|---|---|
| ROE | 21.1% | 13.2% |
| ROIC | 13.1% | 10.1% |
| P/E | 30.2 | 36.9 |
| P/B | 6.37 | 4.86 |
| Current Ratio | 1.32 | 2.31 |
| Quick Ratio | 0.81 | 1.55 |
| D/E | 0.54 | 0.38 |
| Debt-to-Assets | 25.5% | 22.6% |
| Interest Coverage | 19.8x | 8.6x |
| Asset Turnover | 0.67 | 0.74 |
| Fixed Asset Turnover | 5.40 | 6.18 |
| Payout ratio | 39.5% | 13.1% |
| Dividend yield | 1.31% | 0.36% |
| Fiscal Year | 2025 | 2024 |
Efficiency & Valuation Duel: The Vital Signs
Financial ratios act as a company’s DNA, revealing hidden risks and operational excellence critical for investment decisions.
Eaton Corporation plc
Eaton delivers strong profitability with a 21.05% ROE and a 14.9% net margin, signaling operational efficiency. However, its P/E of 30.24 and P/B of 6.37 suggest a stretched valuation. The 1.31% dividend yield offers steady shareholder returns, balancing growth and income for investors.
Kadant Inc.
Kadant posts a moderate 13.17% ROE and a 10.59% net margin, reflecting solid but less robust profitability. Its P/E ratio of 36.9 indicates an expensive stock relative to earnings. Kadant’s low 0.36% dividend yield points to a focus on reinvestment, likely in R&D and growth initiatives.
Premium Valuation vs. Operational Safety
Eaton balances superior profitability with a high but justifiable valuation, while Kadant shows favorable liquidity and reinvestment but trades at a higher premium. Eaton suits investors prioritizing operational strength and dividends; Kadant fits those seeking growth with liquidity comfort.
Which one offers the Superior Shareholder Reward?
I observe Eaton (ETN) delivers a classic income and buyback mix with a 1.3% dividend yield and a 39% payout ratio, maintaining steady FCF support. Kadant (KAI) yields just 0.4%, opting to reinvest heavily while running a modest buyback program. Eaton’s balanced distribution and higher dividend sustainability offer a superior total return profile for income-focused investors in 2026.
Comparative Score Analysis: The Strategic Profile
The radar chart reveals the fundamental DNA and trade-offs of Eaton Corporation plc and Kadant Inc., highlighting their core financial strengths and weaknesses:
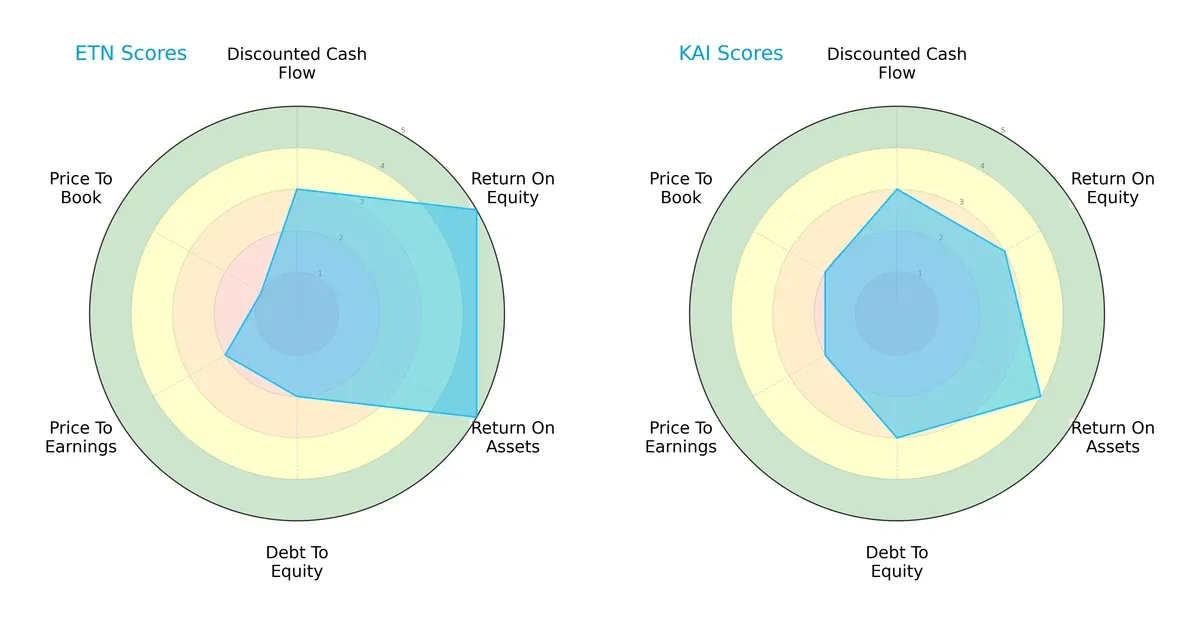
Eaton stands out with superior profitability metrics, scoring 5 in both ROE and ROA, reflecting efficient capital and asset utilization. However, it carries financial risk with a low debt-to-equity score of 2, signaling higher leverage. Kadant shows a more balanced risk profile with a moderate debt score of 3 and respectable profitability (ROE 3, ROA 4). Both deliver moderate DCF scores (3) and face valuation challenges with low P/E and P/B scores, but Eaton leans heavily on operational efficiency, while Kadant maintains steadier financial stability.
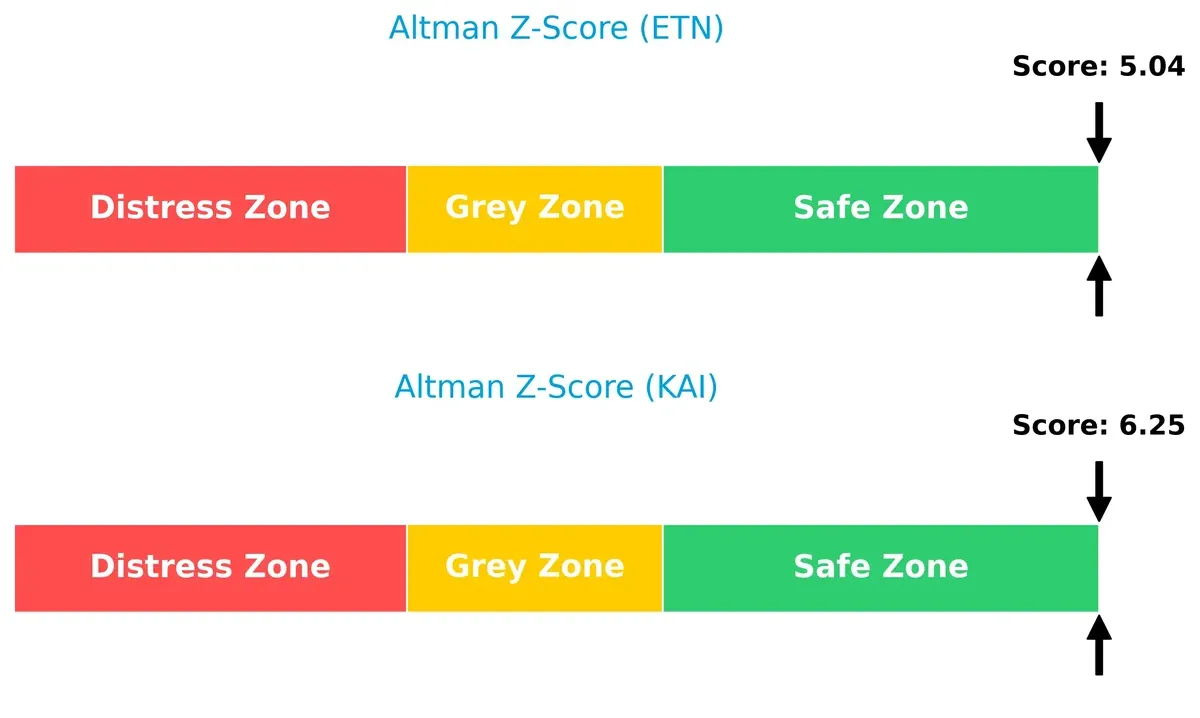
Bankruptcy Risk: Solvency Showdown
Eaton’s Altman Z-Score of 5.04 vs. Kadant’s 6.25 indicates both firms remain firmly in the safe zone, with Kadant demonstrating an even stronger buffer against financial distress in this cycle:
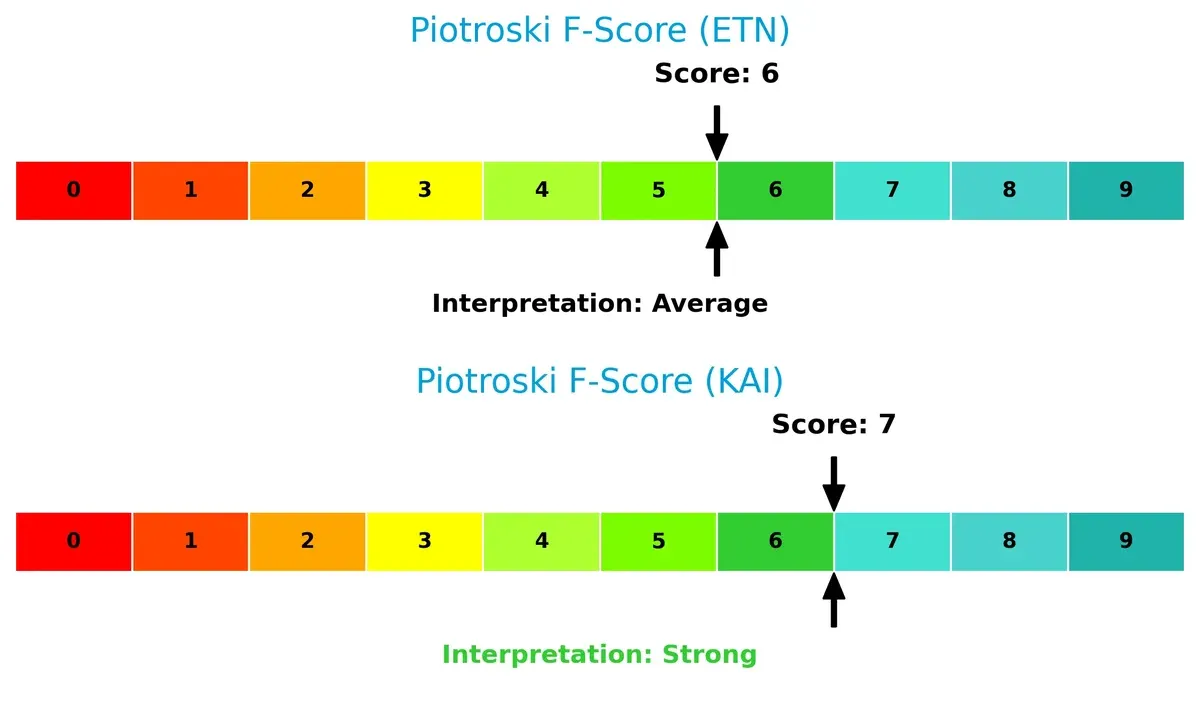
Financial Health: Quality of Operations
Kadant’s Piotroski F-Score of 7 surpasses Eaton’s 6, signaling stronger internal financial health and fewer operational red flags. Both show solid fundamentals, but Kadant edges ahead in quality and sustainability of earnings:
How are the two companies positioned?
This section dissects the operational DNA of Eaton and Kadant by comparing their revenue distribution and internal dynamics. The goal is to confront their economic moats, revealing which model delivers the most resilient competitive advantage today.
Revenue Segmentation: The Strategic Mix
This visual comparison dissects how Eaton Corporation plc and Kadant Inc. diversify their income streams and where their primary sector bets lie:
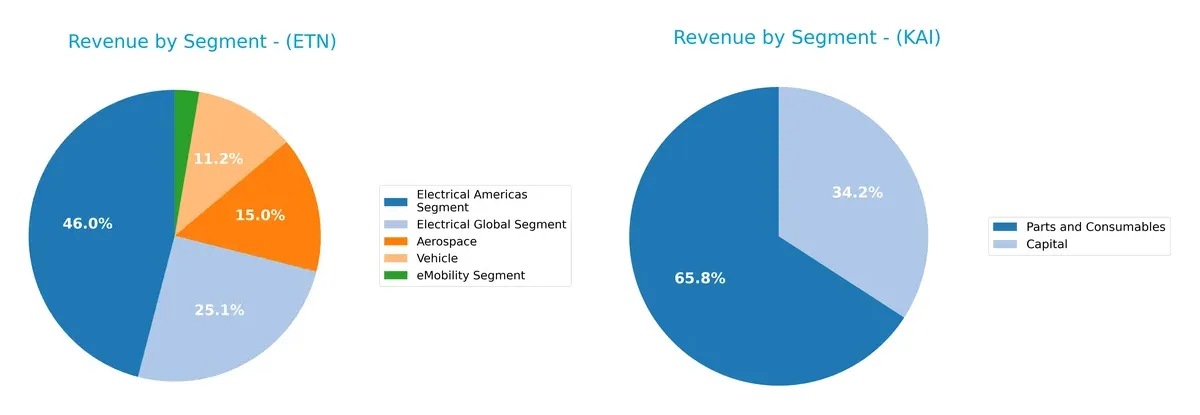
Eaton dominates with a broad portfolio, anchored by Electrical Americas at $11.4B and Electrical Global at $6.2B, complemented by Aerospace and Vehicle segments. Kadant relies heavily on two segments: Parts and Consumables at $694M and Capital at $360M. Eaton’s diversified mix reduces concentration risk and benefits from infrastructure dominance. Kadant’s focused revenue implies exposure to market cycles in paper and capital equipment but may leverage niche specialization.
Strengths and Weaknesses Comparison
This table compares the Strengths and Weaknesses of Eaton Corporation plc (ETN) and Kadant Inc. (KAI):
ETN Strengths
- Diverse revenue streams across Aerospace, Electrical, Vehicle, eMobility segments
- Strong profitability with 14.9% net margin and 21.05% ROE
- Favorable debt-to-assets ratio at 25.53% and high interest coverage
- Significant global presence with large US and Europe sales
- Efficient fixed asset turnover at 5.4
KAI Strengths
- Favorable profitability with 10.59% net margin and 10.08% ROIC
- Strong liquidity ratios with current ratio 2.31 and quick ratio 1.55
- Low leverage with debt-to-assets at 22.57% and interest coverage at 8.64
- Focused product segments like Capital and Parts
- Clear geographic sales concentration in North America and Europe
ETN Weaknesses
- Elevated valuation multiples with PE 30.24 and PB 6.37 marked unfavorable
- Neutral liquidity ratios with quick ratio 0.81 and current ratio 1.32
- Moderate asset turnover at 0.67 limits efficiency gains
- Limited innovation disclosure in segments
- Dividend yield neutral at 1.31%
KAI Weaknesses
- High valuation multiples with PE 36.9 and PB 4.86 unfavorable
- Lower ROE at 13.17% neutral status
- Dividend yield low at 0.36% unfavorable
- Less diversified product and geographic segmentation
- Smaller scale limits market share expansion
ETN’s strengths lie in its diversified product base and strong profitability metrics, while its valuation and liquidity metrics warrant attention. KAI shows robust liquidity and focused profitability but faces challenges from high valuation and narrower diversification. Both companies’ strategic focus reflects their operational scale and market positioning.
The Moat Duel: Analyzing Competitive Defensibility
A structural moat is the only true shield protecting long-term profits from relentless competitive erosion and margin compression:
Eaton Corporation plc: Diversified Industrial Powerhouse with Scale Economies
Eaton’s moat stems from its cost advantage and broad industrial scale, reflected in a strong 18.8% EBIT margin and a rising ROIC above WACC. Its global reach and expanding eMobility segment may deepen this advantage through innovation and scale by 2026.
Kadant Inc.: Specialized Niche with Intangible Asset Leverage
Kadant’s moat relies on specialized engineered systems and proprietary technology, supporting a higher gross margin of 44.3%. However, its ROIC lags WACC, signaling weaker value creation despite improving profitability, with growth hinging on expanding industrial processing solutions.
Scale Dominance vs. Specialized Innovation: Who Holds the Deeper Moat?
Eaton commands a wider and more sustainable moat, combining scale-driven cost advantages with robust capital returns. Kadant’s niche focus offers margin strength but lacks Eaton’s value creation breadth. Eaton stands better poised to defend market share long term.
Which stock offers better returns?
The past year shows strong price gains for both Eaton Corporation plc and Kadant Inc., with notable acceleration in their upward trends and distinct trading volume dynamics.
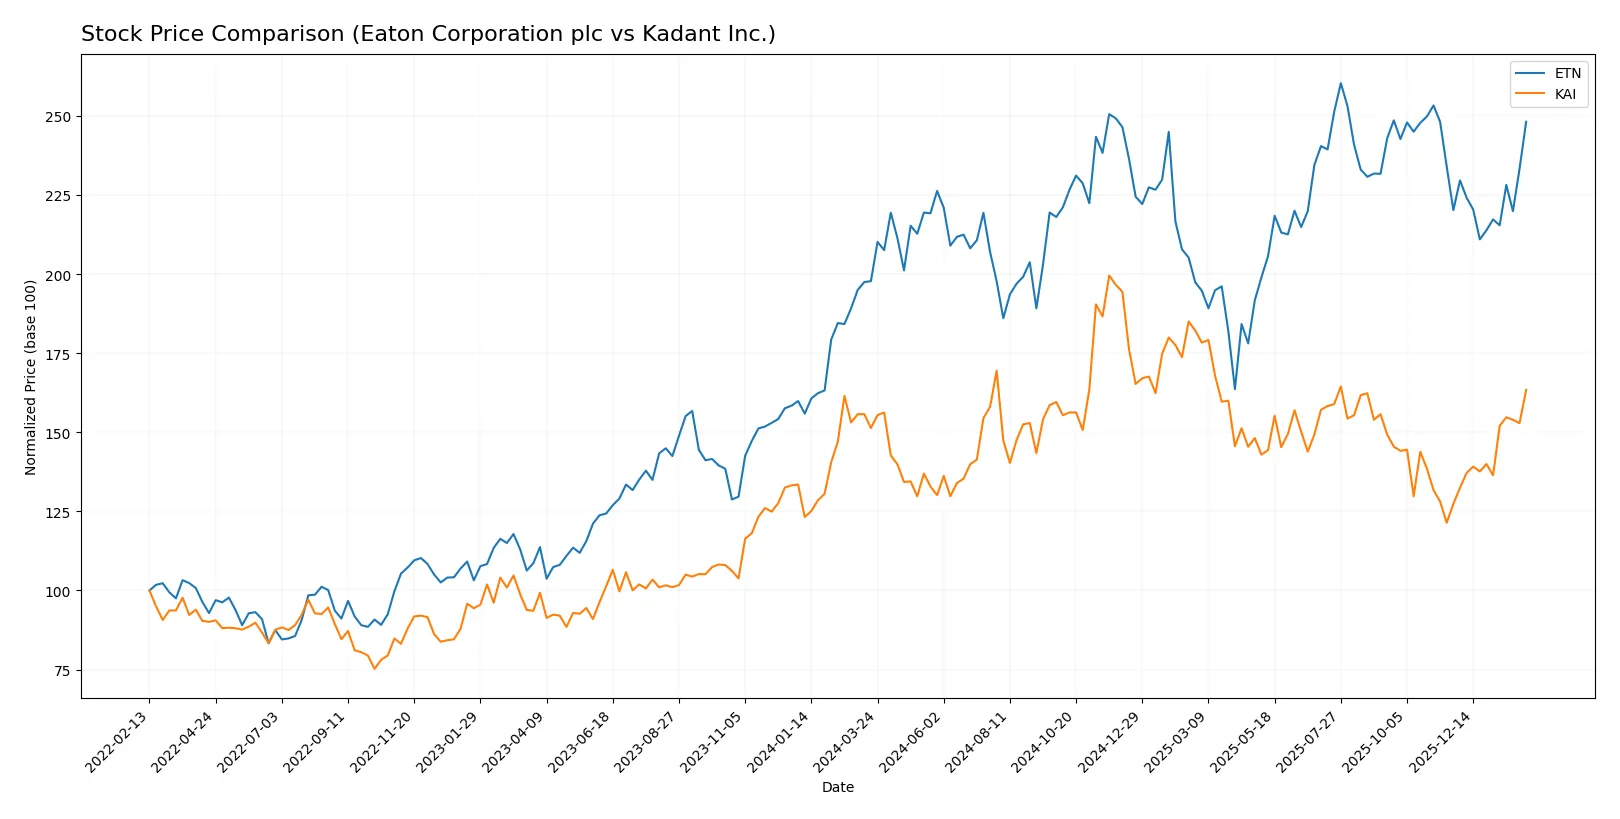
Trend Comparison
Eaton Corporation plc’s stock rose 25.49% over the past year, indicating a bullish trend with accelerating momentum. The price ranged between 246.52 and 392.17, showing moderate volatility (std. dev. 29.52).
Kadant Inc.’s stock increased 7.96% over the same period, also bullish with acceleration. Prices fluctuated between 254.91 and 419.01, but volatility was higher (std. dev. 34.46).
Eaton delivered the highest market return at +25.49%, outperforming Kadant’s +7.96% despite Kadant’s stronger recent surge.
Target Prices
Analysts present a clear consensus on target prices for Eaton Corporation plc and Kadant Inc.
| Company | Target Low | Target High | Consensus |
|---|---|---|---|
| Eaton Corporation plc | 295 | 495 | 393.64 |
| Kadant Inc. | 275 | 410 | 342.5 |
The consensus target prices suggest modest upside for both stocks relative to current prices. Eaton trades near $374, below its $394 consensus, indicating room for growth. Kadant’s consensus of $343 aligns closely with its $343 current price.

Don’t Let Luck Decide Your Entry Point
Optimize your entry points with our advanced ProRealTime indicators. You’ll get efficient buy signals with precise price targets for maximum performance. Start outperforming now!
How do institutions grade them?
Eaton Corporation plc Grades
The following table summarizes Eaton Corporation plc’s recent grades from major institutions.
| Grading Company | Action | New Grade | Date |
|---|---|---|---|
| Wells Fargo | maintain | Equal Weight | 2026-02-04 |
| JP Morgan | maintain | Overweight | 2026-01-16 |
| HSBC | upgrade | Buy | 2026-01-16 |
| Morgan Stanley | maintain | Overweight | 2026-01-12 |
| Citigroup | maintain | Buy | 2026-01-12 |
| Barclays | maintain | Equal Weight | 2026-01-07 |
| UBS | downgrade | Neutral | 2026-01-05 |
| Wells Fargo | maintain | Equal Weight | 2025-12-18 |
| Wolfe Research | upgrade | Outperform | 2025-12-09 |
| JP Morgan | maintain | Overweight | 2025-11-06 |
Kadant Inc. Grades
Below are Kadant Inc.’s consistent grades from established research firms.
| Grading Company | Action | New Grade | Date |
|---|---|---|---|
| DA Davidson | maintain | Neutral | 2026-02-04 |
| Barrington Research | maintain | Outperform | 2026-02-03 |
| Barrington Research | maintain | Outperform | 2025-10-30 |
| Barrington Research | maintain | Outperform | 2025-10-29 |
| Barrington Research | maintain | Outperform | 2025-10-27 |
| Barrington Research | maintain | Outperform | 2025-10-10 |
| Barrington Research | maintain | Outperform | 2025-09-23 |
| DA Davidson | maintain | Neutral | 2025-08-04 |
| Barrington Research | maintain | Outperform | 2025-07-30 |
| Barrington Research | maintain | Outperform | 2025-07-29 |
Which company has the best grades?
Kadant Inc. consistently holds “Outperform” ratings, indicating stronger institutional confidence. Eaton Corporation’s grades vary between “Buy,” “Overweight,” and “Equal Weight,” suggesting mixed sentiment. Investors may interpret Kadant’s steadier positive outlook as a sign of greater analyst conviction.
Risks specific to each company
The following categories identify the critical pressure points and systemic threats facing Eaton Corporation plc and Kadant Inc. in the 2026 market environment:
1. Market & Competition
Eaton Corporation plc
- Large market cap shields from competition but faces premium valuation risk.
Kadant Inc.
- Smaller scale limits pricing power; niche markets increase vulnerability.
2. Capital Structure & Debt
Eaton Corporation plc
- Moderate debt with strong interest coverage signals manageable leverage.
Kadant Inc.
- Lower debt-to-equity ratio enhances financial flexibility and reduces risk.
3. Stock Volatility
Eaton Corporation plc
- Beta of 1.18 indicates slightly above-market volatility.
Kadant Inc.
- Beta of 1.23 suggests somewhat higher sensitivity to market swings.
4. Regulatory & Legal
Eaton Corporation plc
- Global operations expose Eaton to complex regulatory environments.
Kadant Inc.
- US-centric focus reduces multi-jurisdictional regulatory risks.
5. Supply Chain & Operations
Eaton Corporation plc
- Diverse segments increase operational complexity and supply chain risks.
Kadant Inc.
- Smaller, specialized product lines limit exposure but amplify supply disruptions.
6. ESG & Climate Transition
Eaton Corporation plc
- Larger footprint demands aggressive climate strategy adherence.
Kadant Inc.
- Focus on industrial processing offers moderate ESG risk.
7. Geopolitical Exposure
Eaton Corporation plc
- Irish base and global reach increase vulnerability to geopolitical tensions.
Kadant Inc.
- Primarily US operations reduce direct geopolitical risks.
Which company shows a better risk-adjusted profile?
Kadant faces less leverage risk and benefits from a stronger liquidity position, reflected in a higher current ratio and better Altman Z-score. Eaton’s global scale delivers resilience but also elevates geopolitical and regulatory pressures. Kadant’s focused operations and stronger Piotroski score suggest a superior risk-adjusted profile. Eaton’s premium valuation and heavier debt remain key concerns.
Final Verdict: Which stock to choose?
Eaton Corporation plc’s superpower lies in its robust value creation, consistently outperforming its cost of capital with a very favorable moat. Its efficient capital deployment drives growing profitability. The point of vigilance is its premium valuation, which may test patience amid market volatility. Eaton suits portfolios seeking steady, long-term growth with resilience.
Kadant Inc. benefits from a strategic moat built on solid operational efficiency and strong liquidity. Its growing profitability trend enhances safety compared to Eaton’s higher leverage. Kadant appeals to investors favoring a balanced Growth at a Reasonable Price (GARP) approach, offering a blend of growth potential and financial prudence.
If you prioritize durable economic moats and proven value creation, Eaton outshines thanks to its strong ROIC and expanding returns. However, if you seek better balance sheet safety and smoother earnings growth, Kadant offers superior stability with a favorable operational profile. Both represent compelling scenarios tailored to distinct investor risk appetites.
Disclaimer: Investment carries a risk of loss of initial capital. The past performance is not a reliable indicator of future results. Be sure to understand risks before making an investment decision.
Go Further
I encourage you to read the complete analyses of Eaton Corporation plc and Kadant Inc. to enhance your investment decisions: