Home > Comparison > Industrials > ETN vs JBTM
The strategic rivalry between Eaton Corporation plc and JBT Marel Corporation shapes the industrial machinery landscape. Eaton excels as a diversified power management heavyweight, serving multiple global sectors with capital-intensive solutions. JBT Marel, by contrast, specializes in high-tech food processing equipment with a focused, innovation-driven model. This analysis evaluates their contrasting growth strategies and operational scopes to identify which offers the superior risk-adjusted return for a balanced industrial portfolio.
Table of contents
Companies Overview
Eaton Corporation plc and JBT Marel Corporation stand as influential players in the industrial machinery sector with distinct market scopes.
Eaton Corporation plc: Power Management Giant
Eaton Corporation plc dominates as a global power management company, generating revenue from electrical components, aerospace systems, and vehicle segments. Its 2026 strategic focus emphasizes expanding eMobility solutions and enhancing power distribution technologies. Eaton’s diversified portfolio secures its competitive advantage in industrial and aerospace markets worldwide.
JBT Marel Corporation: Food and Beverage Tech Innovator
JBT Marel Corporation leads in industrial machinery with a sharp focus on technology solutions for the food and beverage industry. It earns through value-added processing and automation services across multiple regions. In 2026, the company prioritizes innovation in automated guided vehicles and packaging solutions to capture growth in diverse food processing sectors.
Strategic Collision: Similarities & Divergences
Both companies excel in industrial machinery but diverge sharply in their business philosophies: Eaton pursues a broad power management ecosystem, while JBT Marel targets niche food processing technology. The primary battleground lies in automation and efficiency improvements. Their distinct market approaches create unique investment profiles—Eaton’s scale contrasts with JBT Marel’s specialized innovation.
Income Statement Comparison
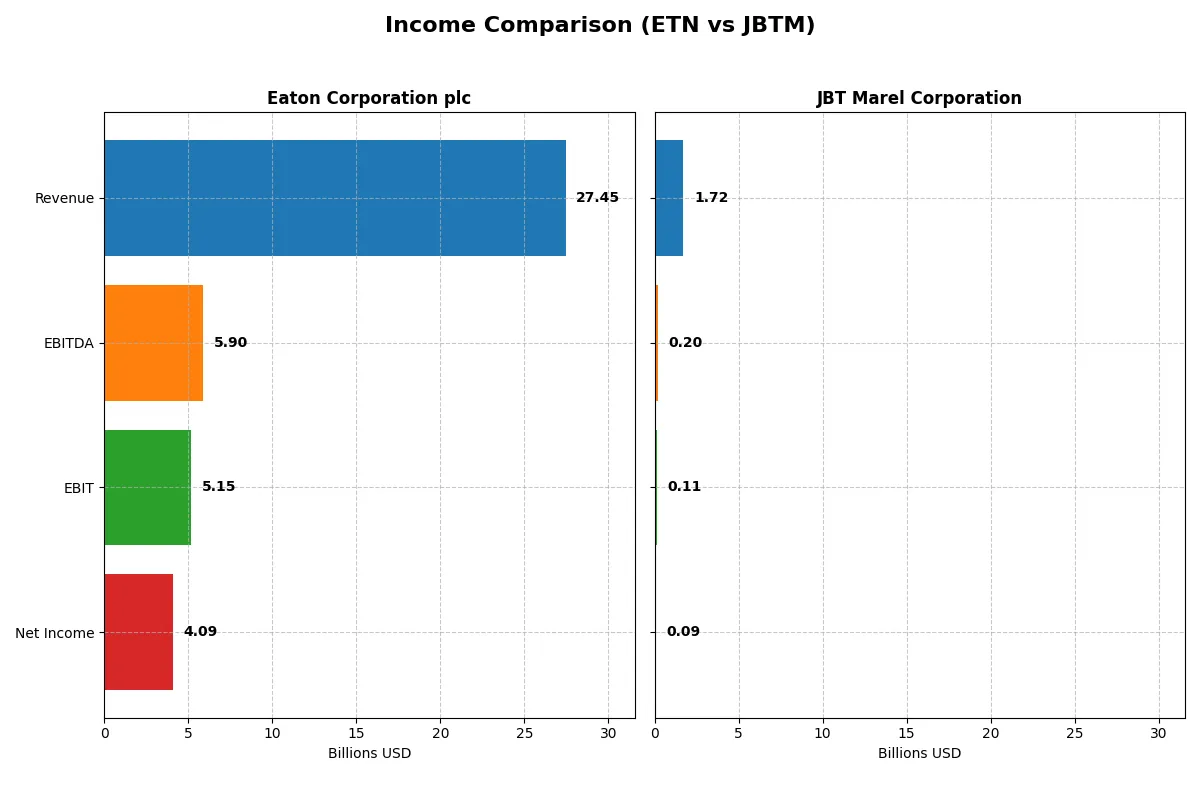
This data dissects the core profitability and scalability of both corporate engines to reveal who dominates the bottom line:
| Metric | Eaton Corporation plc (ETN) | JBT Marel Corporation (JBTM) |
|---|---|---|
| Revenue | 27.4B | 1.72B |
| Cost of Revenue | 17.1B | 1.09B |
| Operating Expenses | 5.08B | 508M |
| Gross Profit | 10.3B | 627M |
| EBITDA | 5.90B | 204M |
| EBIT | 5.15B | 115M |
| Interest Expense | 264M | 19.4M |
| Net Income | 4.09B | 85.4M |
| EPS | 10.49 | 2.67 |
| Fiscal Year | 2025 | 2024 |
Income Statement Analysis: The Bottom-Line Duel
This income statement comparison exposes which company operates with greater efficiency and profitability momentum over recent years.
Eaton Corporation plc Analysis
Eaton’s revenue surged from $19.6B in 2021 to $27.4B in 2025, with net income climbing from $2.1B to $4.1B. Gross and net margins remain robust at 37.6% and 14.9%, respectively, signaling strong cost control. The 2025 results show clear momentum, with a 10.3% revenue growth and a favorable 9.3% EBIT increase, reflecting operational efficiency.
JBT Marel Corporation Analysis
JBTM’s revenue modestly fluctuated around $1.4B-$1.7B from 2020 to 2024, ending at $1.7B. Net income declined from $119M in 2021 to $85M in 2024, compressing net margin to 5%. Despite a healthy gross margin of 36.5%, the company faces weakening EBIT and net margin growth, with a sharp 85% drop in EPS last year, indicating deteriorating profitability.
Margin Strength vs. Profit Growth
Eaton dominates with consistent top-line expansion and margin improvements, delivering nearly 91% net income growth over five years. JBTM struggles with stagnant revenue and declining profitability. Eaton’s profile appeals more to investors seeking strong fundamental growth and margin resilience, while JBTM’s volatile earnings pose notable risks.
Financial Ratios Comparison
These vital ratios act as a diagnostic tool to expose the underlying fiscal health, valuation premiums, and capital efficiency of the companies compared below:
| Ratios | Eaton Corporation plc (ETN) | JBT Marel Corporation (JBTM) |
|---|---|---|
| ROE | 21.1% | 5.5% |
| ROIC | 13.1% | 3.7% |
| P/E | 30.2 | 47.6 |
| P/B | 6.37 | 2.63 |
| Current Ratio | 1.32 | 3.48 |
| Quick Ratio | 0.81 | 3.04 |
| D/E | 0.54 | 0.81 |
| Debt-to-Assets | 25.5% | 36.7% |
| Interest Coverage | 19.8 | 6.1 |
| Asset Turnover | 0.67 | 0.50 |
| Fixed Asset Turnover | 5.40 | 7.34 |
| Payout ratio | 39.5% | 15.3% |
| Dividend yield | 1.31% | 0.32% |
| Fiscal Year | 2025 | 2024 |
Efficiency & Valuation Duel: The Vital Signs
Financial ratios act as a company’s DNA, unveiling hidden risks and operational strengths essential for investment insight.
Eaton Corporation plc
Eaton delivers strong profitability with a 21.05% ROE and a robust 14.9% net margin, signaling operational efficiency. However, its valuation appears stretched, with a P/E of 30.24 and P/B of 6.37, above sector averages. Eaton balances this with a 1.31% dividend yield, reflecting steady shareholder returns amid moderate reinvestment in R&D (3%).
JBT Marel Corporation
JBT Marel shows weaker profitability, with a 5.53% ROE and a modest 4.98% net margin, indicating operational challenges. Its valuation is notably expensive, marked by a high P/E of 47.63, despite a lower P/B of 2.63. The company offers minimal dividends (0.32%), favoring growth reinvestment, though cash flow and current ratio metrics raise caution.
Premium Valuation vs. Operational Safety
Eaton combines superior profitability with moderate dividend returns, albeit at a stretched valuation. JBT presents a riskier profile with low profitability and high valuation. Investors prioritizing operational stability may prefer Eaton, while those seeking growth with tolerance for risk might consider JBT.
Which one offers the Superior Shareholder Reward?
I compare Eaton Corporation plc (ETN) and JBT Marel Corporation (JBTM) on shareholder rewards through dividends, payout ratios, and buyback intensity. ETN pays a 1.31% dividend yield with a moderate 39% payout ratio, supported by strong FCF and consistent buybacks. JBTM yields a scant 0.32% with a low 15% payout, prioritizing reinvestment and modest buybacks. ETN’s model balances steady income and capital returns sustainably. JBTM’s reinvestment focus suits growth but offers limited immediate returns. I conclude ETN delivers superior total shareholder reward in 2026.
Comparative Score Analysis: The Strategic Profile
The radar chart reveals the fundamental DNA and trade-offs of Eaton Corporation plc and JBT Marel Corporation, highlighting their financial strengths and weaknesses:
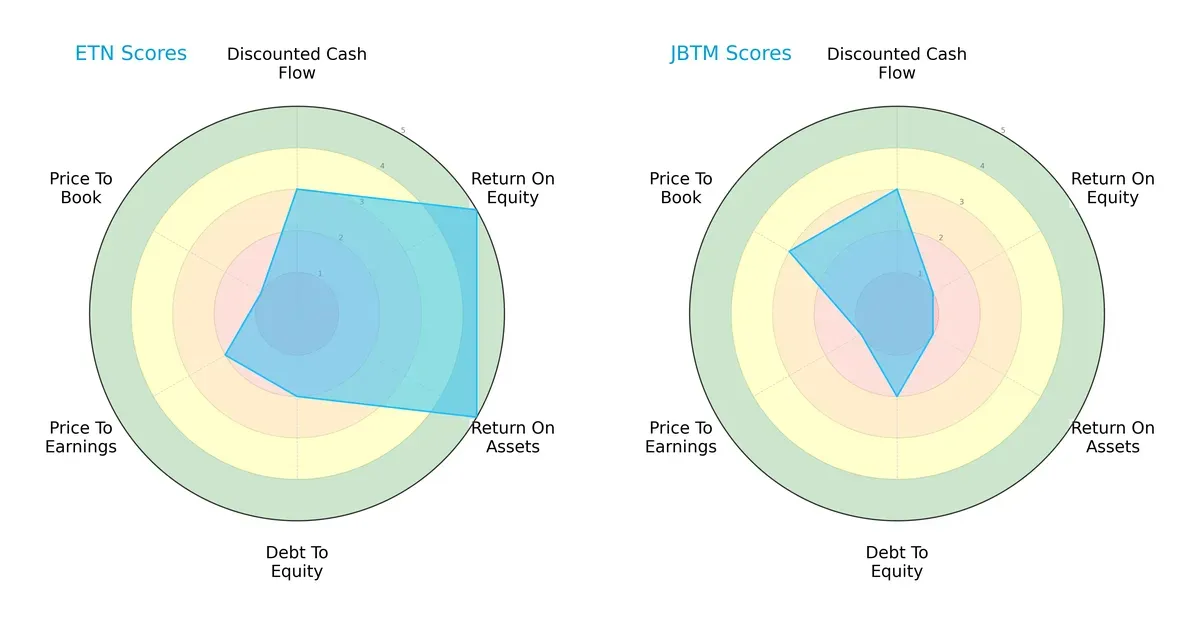
Eaton shows a balanced profile with strong ROE and ROA (5 each), signaling excellent capital efficiency and asset utilization. However, it struggles with valuation metrics, scoring low on P/E (2) and P/B (1), suggesting potential overvaluation or market skepticism. JBT relies more heavily on valuation edges (P/B score of 3) but suffers from weak profitability (ROE and ROA scores of 1) and overall lower scores, reflecting operational challenges. Eaton’s moderate DCF score (3) compared to JBT’s equal score indicates similar market expectations for cash flows, but Eaton’s financial robustness stands out clearly.
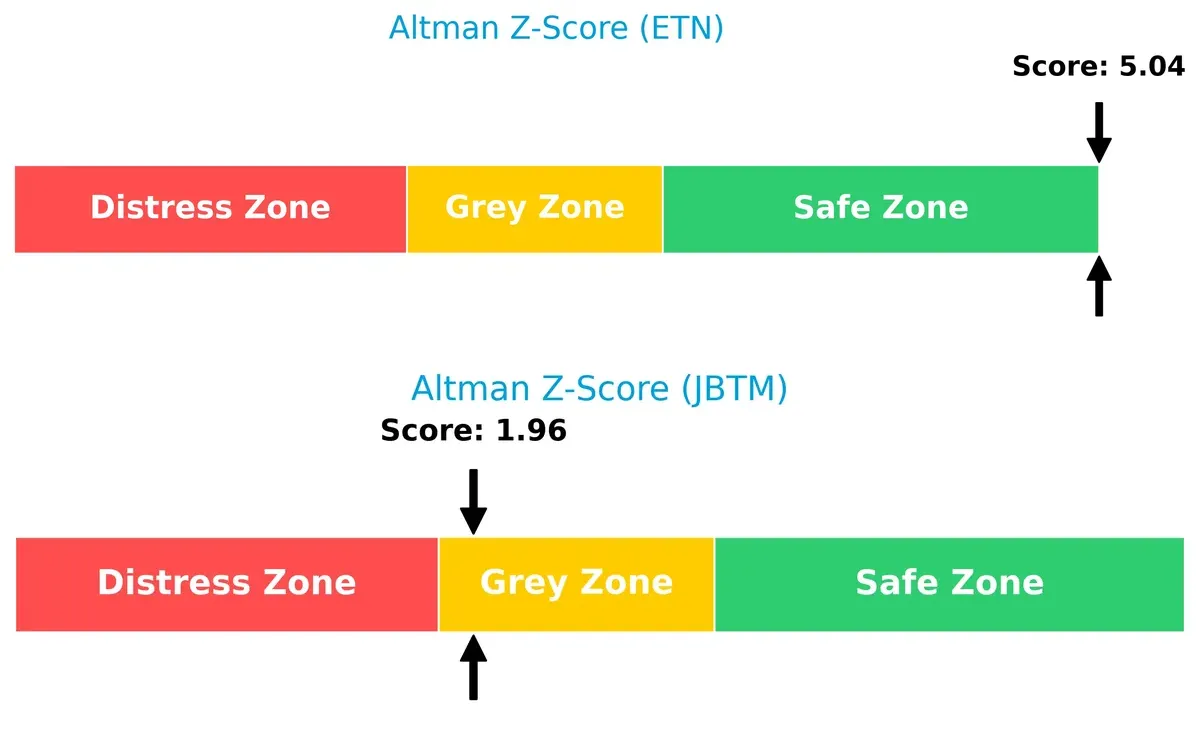
Bankruptcy Risk: Solvency Showdown
Eaton’s Altman Z-Score of 5.04 places it firmly in the safe zone, indicating strong solvency and low bankruptcy risk. JBT’s 1.96 score falls into the grey zone, signaling moderate financial distress risk in this cycle:
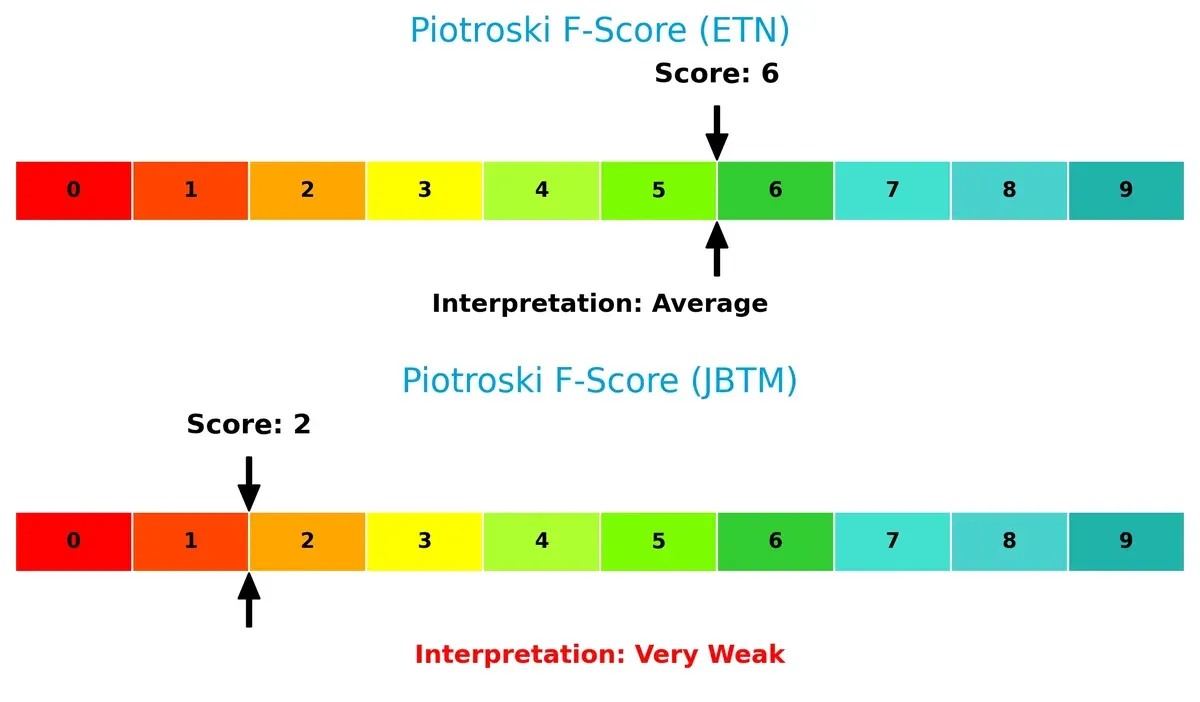
Financial Health: Quality of Operations
Eaton’s Piotroski F-Score of 6 suggests solid financial health with generally sound internal metrics. JBT’s score of 2 flags significant red flags in operational quality and financial strength, underscoring caution for investors:
How are the two companies positioned?
This section dissects Eaton and JBT Marel’s operational DNA by comparing revenue distribution and internal dynamics. The goal is to confront their economic moats and identify the more resilient, sustainable competitive advantage today.
Revenue Segmentation: The Strategic Mix
This visual comparison dissects how Eaton Corporation plc and JBT Marel Corporation diversify income streams and highlights their primary sector bets:
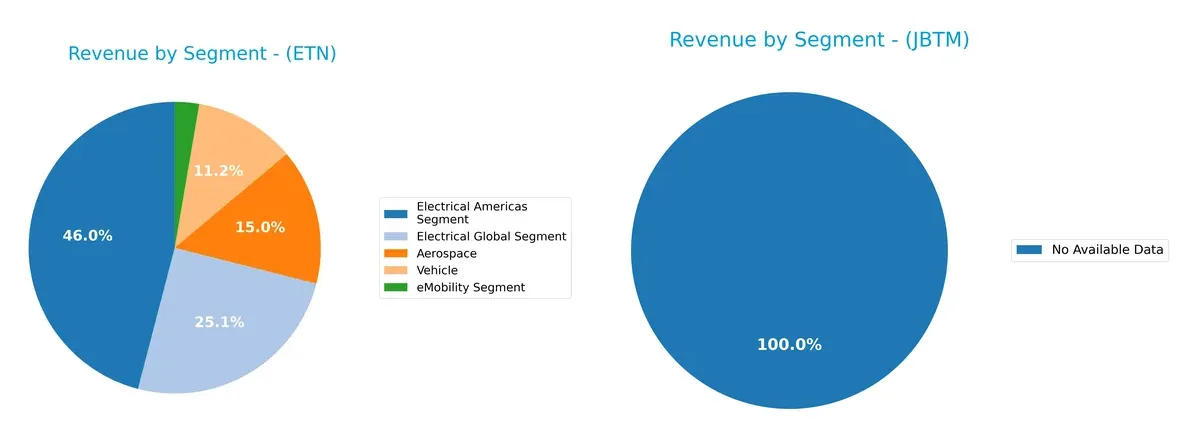
Eaton Corporation plc anchors revenue in Electrical Americas ($11.4B) and Electrical Global ($6.2B), with significant Aerospace ($3.7B) and Vehicle ($2.8B) segments. Eaton’s broad portfolio reduces concentration risk and leverages infrastructure dominance. JBT Marel Corporation lacks reported data, preventing segmentation analysis. Eaton’s diversified mix contrasts with JBT’s unavailable profile, underscoring Eaton’s ecosystem lock-in strategy.
Strengths and Weaknesses Comparison
This table compares the Strengths and Weaknesses of Eaton Corporation plc and JBT Marel Corporation:
Eaton Strengths
- Diversified revenue across Aerospace, Electrical Americas, Electrical Global, Vehicle, and eMobility segments
- Strong profitability with 14.9% net margin and 21.05% ROE
- Favorable debt-to-assets at 25.53% and high interest coverage of 19.5
- Global presence with significant sales in U.S., Europe, Asia Pacific, and Latin America
JBTM Strengths
- Favorable weighted average cost of capital at 7.45%
- Strong quick ratio at 3.04 indicating liquidity
- Favorable fixed asset turnover at 7.34, showing efficient asset use
- Interest coverage at 5.92 supports debt servicing ability
Eaton Weaknesses
- Unfavorable valuation multiples with PE at 30.24 and PB at 6.37
- Neutral current and quick ratios suggest moderate short-term liquidity
- Moderate asset turnover at 0.67 limits revenue generation efficiency
JBTM Weaknesses
- Low profitability with net margin at 4.98% and ROE at 5.53%
- Unfavorable PE at 47.63 and dividend yield at 0.32%
- Unfavorable current ratio at 3.48 may indicate overstocked inventory or receivables
- Higher debt ratio with 36.68% debt to assets potentially raises financial risk
Eaton demonstrates robust profitability and diversified global operations but faces valuation concerns. JBT Marel shows liquidity strengths and asset efficiency but struggles with profitability and valuation metrics. These factors shape each company’s strategic challenges and opportunities.
The Moat Duel: Analyzing Competitive Defensibility
A structural moat is the only shield protecting long-term profits from relentless competition erosion. Let’s dissect the core moats of Eaton and JBT Marel:
Eaton Corporation plc: Diversified Industrial Powerhouse with Cost Advantage
Eaton’s moat stems from a broad industrial portfolio and operational scale, maintaining high ROIC well above WACC. Its stable 18.8% EBIT margin signals margin resilience. In 2026, expanding eMobility and aerospace segments could deepen this cost advantage moat.
JBT Marel Corporation: Specialized Food Tech with Narrower Moat
JBT’s moat relies on specialized technology for food processing, contrasting Eaton’s scale. However, it suffers from a declining ROIC and compressed margins, reflecting weaker competitive positioning. Future growth hinges on innovation and market expansion, but risks remain elevated.
Scale and Cost Leadership vs. Niche Innovation
Eaton holds a wider, more sustainable moat with growing ROIC and strong margin stability. JBT’s shrinking ROIC and profitability erosion expose it to competitive threats. Eaton is better equipped to defend and expand its market share through operational breadth and cost leadership.
Which stock offers better returns?
The past year saw Eaton Corporation plc and JBT Marel Corporation both gaining significantly, with JBTM showing a steeper ascent and stronger buyer dominance recently.
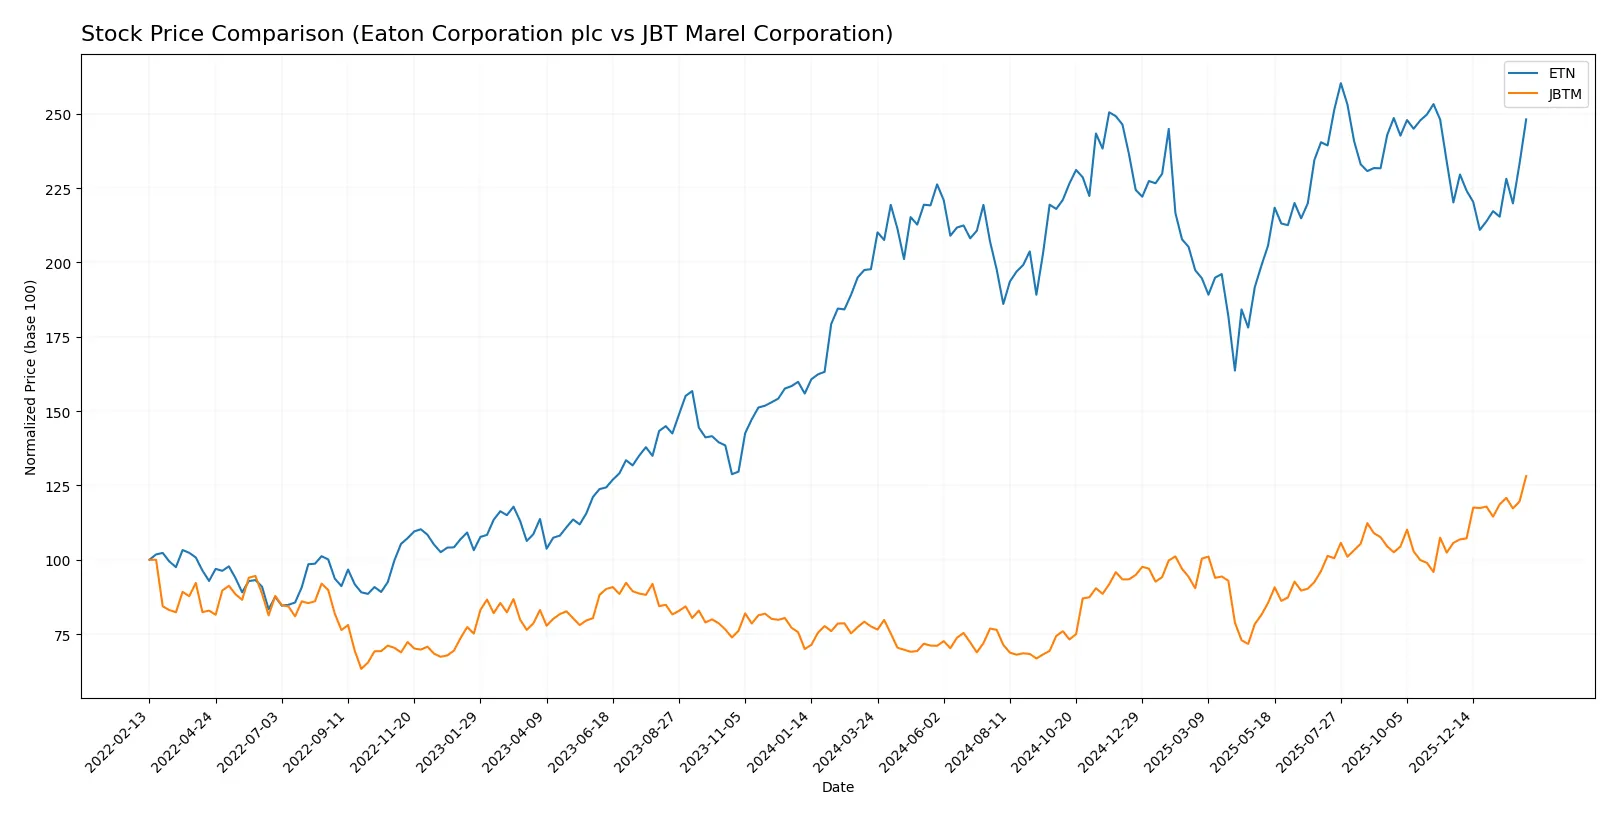
Trend Comparison
Eaton Corporation plc’s stock rose 25.49% over the past year, exhibiting a bullish trend with accelerating momentum and a high volatility level marked by a 29.52 standard deviation.
JBT Marel Corporation’s stock surged 65.2% in the same period, also bullish with accelerating gains, but with lower volatility at a 20.79 standard deviation, reflecting steadier upward movement.
JBT Marel Corporation clearly outperformed Eaton Corporation plc, delivering the highest market return with stronger recent buyer dominance and a faster trend slope.
Target Prices
Analysts present a clear consensus on target prices for Eaton Corporation plc and JBT Marel Corporation.
| Company | Target Low | Target High | Consensus |
|---|---|---|---|
| Eaton Corporation plc | 295 | 495 | 394 |
| JBT Marel Corporation | 169 | 180 | 175 |
The consensus target for Eaton suggests a roughly 5% upside from the current 374 price, reflecting solid confidence. JBT Marel’s targets indicate a modest 3.5% potential gain, signaling cautious optimism among analysts.

Don’t Let Luck Decide Your Entry Point
Optimize your entry points with our advanced ProRealTime indicators. You’ll get efficient buy signals with precise price targets for maximum performance. Start outperforming now!
How do institutions grade them?
Here is a summary of recent institutional grades for Eaton Corporation plc and JBT Marel Corporation:
Eaton Corporation plc Grades
The following table shows recent grades and actions from major financial institutions:
| Grading Company | Action | New Grade | Date |
|---|---|---|---|
| Wells Fargo | Maintain | Equal Weight | 2026-02-04 |
| JP Morgan | Maintain | Overweight | 2026-01-16 |
| HSBC | Upgrade | Buy | 2026-01-16 |
| Morgan Stanley | Maintain | Overweight | 2026-01-12 |
| Citigroup | Maintain | Buy | 2026-01-12 |
| Barclays | Maintain | Equal Weight | 2026-01-07 |
| UBS | Downgrade | Neutral | 2026-01-05 |
| Wells Fargo | Maintain | Equal Weight | 2025-12-18 |
| Wolfe Research | Upgrade | Outperform | 2025-12-09 |
| JP Morgan | Maintain | Overweight | 2025-11-06 |
JBT Marel Corporation Grades
Recent upgrades from reputable institutions are summarized below:
| Grading Company | Action | New Grade | Date |
|---|---|---|---|
| Jefferies | Upgrade | Buy | 2025-12-10 |
| William Blair | Upgrade | Outperform | 2025-08-06 |
Which company has the best grades?
Eaton shows a broader range of grades with a mix of Overweight, Buy, and Equal Weight ratings from top banks. JBT Marel’s grades are fewer but notably upgraded to Buy and Outperform. Investors may view Eaton’s diversity in opinions as reflecting complex market views, while JBT’s consistent upgrades could signal growing confidence.
Risks specific to each company
In 2026, these categories reveal the critical pressure points and systemic threats both Eaton Corporation plc and JBT Marel Corporation face in a complex market environment:
1. Market & Competition
Eaton Corporation plc
- Large market cap (145B) supports scale advantages but faces intense industrial machinery competition.
JBT Marel Corporation
- Smaller market cap (8.8B) limits scale; competes niche food and beverage tech market with innovation pressure.
2. Capital Structure & Debt
Eaton Corporation plc
- Moderate debt-to-assets (25.5%) and strong interest coverage (19.5x) signal solid financial stability.
JBT Marel Corporation
- Higher debt-to-assets (36.7%) with lower interest coverage (5.9x) poses moderate leverage risk.
3. Stock Volatility
Eaton Corporation plc
- Beta of 1.18 shows moderate sensitivity to market swings, typical for industrials in recovery cycles.
JBT Marel Corporation
- Beta of 0.975 indicates lower volatility but exposes stock to sector-specific operational risks.
4. Regulatory & Legal
Eaton Corporation plc
- Global operations in power management expose Eaton to diverse and evolving regulatory frameworks.
JBT Marel Corporation
- Food tech niche faces stringent safety and compliance regulations, increasing operational complexity.
5. Supply Chain & Operations
Eaton Corporation plc
- Large, complex supply chains create exposure to global disruptions but benefit from diversified sourcing.
JBT Marel Corporation
- Reliance on specialized components in automated systems heightens supply chain vulnerability.
6. ESG & Climate Transition
Eaton Corporation plc
- Power management focus aligns with clean energy trends but demands ongoing innovation in sustainability.
JBT Marel Corporation
- Food processing automation supports efficiency but must address increasing ESG scrutiny in food safety and waste.
7. Geopolitical Exposure
Eaton Corporation plc
- Irish headquarters with global footprint subjects Eaton to multinational trade tensions and currency risks.
JBT Marel Corporation
- U.S.-based with global sales but more concentrated in North America, limiting some geopolitical risks.
Which company shows a better risk-adjusted profile?
Eaton’s robust capital structure and safer Altman Z-Score highlight a stronger risk-adjusted profile. JBT’s higher leverage and weaker profitability metrics amplify its risk, despite niche market focus. Eaton’s diversified operations and financial stability offer more resilience amid 2026’s market uncertainties.
Final Verdict: Which stock to choose?
Eaton Corporation plc (ETN) wields unmatched capital efficiency, delivering consistent value creation with a growing economic moat. Its strength lies in disciplined capital allocation and robust returns, though investors should monitor its premium valuation as a point of vigilance. ETN suits portfolios targeting steady, long-term growth with moderate risk tolerance.
JBT Marel Corporation (JBTM) leverages an operational niche with high recent price momentum, supported by a solid liquidity cushion. However, it struggles with declining profitability and value destruction, reflecting strategic challenges. Compared to ETN, JBTM offers less stability and fits portfolios that can absorb volatility in pursuit of opportunistic growth.
If you prioritize durable value creation and proven operational excellence, Eaton outshines due to its sustainable competitive advantage and financial strength. However, if you seek higher-risk, momentum-driven opportunities with potential upside, JBT Marel presents an analytical scenario worth consideration despite its current financial headwinds.
Disclaimer: Investment carries a risk of loss of initial capital. The past performance is not a reliable indicator of future results. Be sure to understand risks before making an investment decision.
Go Further
I encourage you to read the complete analyses of Eaton Corporation plc and JBT Marel Corporation to enhance your investment decisions: