Home > Comparison > Industrials > ETN vs IR
The strategic rivalry between Eaton Corporation plc and Ingersoll Rand Inc. shapes the industrial machinery sector’s competitive landscape. Eaton, a diversified power management leader, contrasts with Ingersoll Rand’s focus on mission-critical air and fluid technologies. This analysis pits Eaton’s broad industrial platform against Ingersoll Rand’s specialized precision solutions. I will determine which company’s operational model offers superior risk-adjusted returns for a diversified industrial portfolio in 2026.
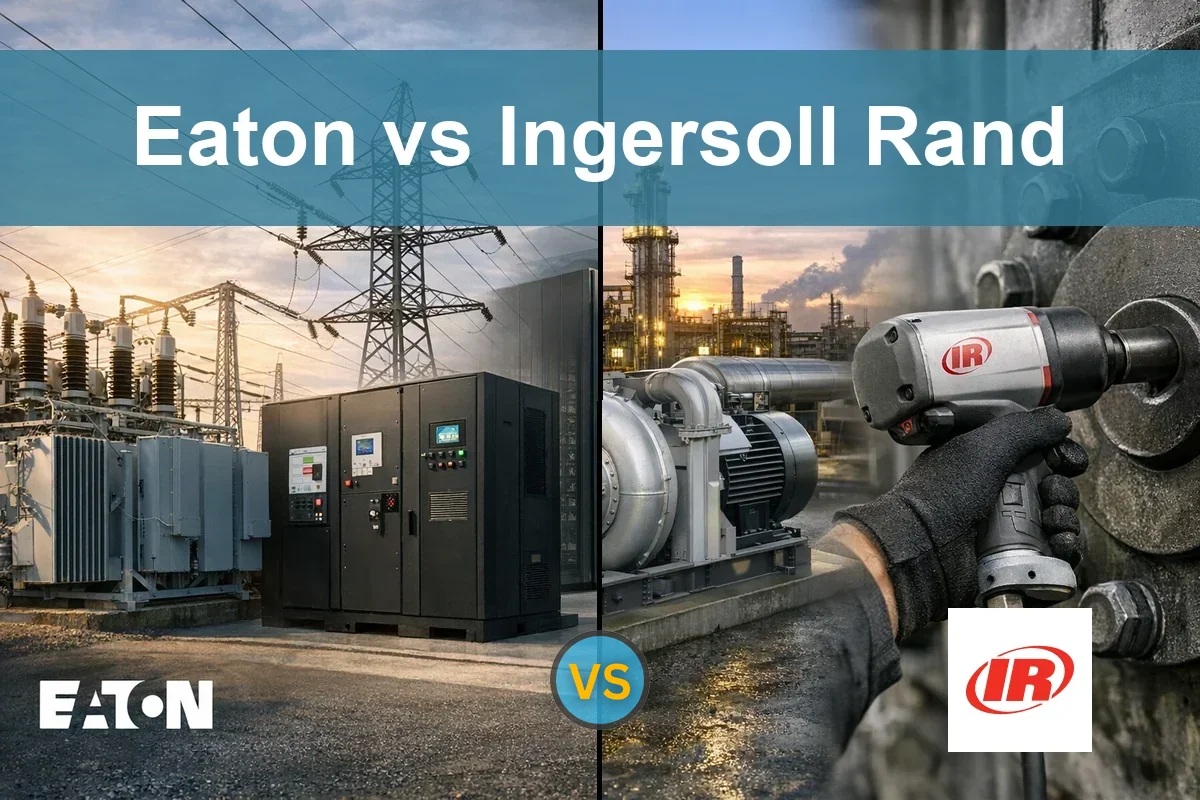
Table of contents
Companies Overview
Eaton Corporation plc and Ingersoll Rand Inc. stand as key industrial machinery players shaping global markets.
Eaton Corporation plc: Power Management Leader
Eaton dominates as a power management company worldwide. It earns primarily through electrical components, aerospace systems, vehicle transmissions, and eMobility products. In 2026, Eaton focuses strategically on expanding its eMobility segment alongside strengthening power distribution and aerospace technologies.
Ingersoll Rand Inc.: Mission-Critical Technologies Provider
Ingersoll Rand specializes in industrial machinery and mission-critical technologies, including air compression, fluid transfer, and precision pumps. Its 2026 strategy targets growth in industrial technologies and precision science segments, emphasizing aftermarket services and specialized applications across diverse sectors.
Strategic Collision: Similarities & Divergences
Both companies lead in industrial machinery but diverge in business philosophy: Eaton emphasizes broad power management solutions, while Ingersoll Rand pursues specialized, mission-critical technologies. Their primary battleground lies in industrial equipment and aftermarket services. Eaton offers a diversified global footprint, whereas Ingersoll Rand presents a focused innovation profile, defining distinct investment characteristics.
Income Statement Comparison
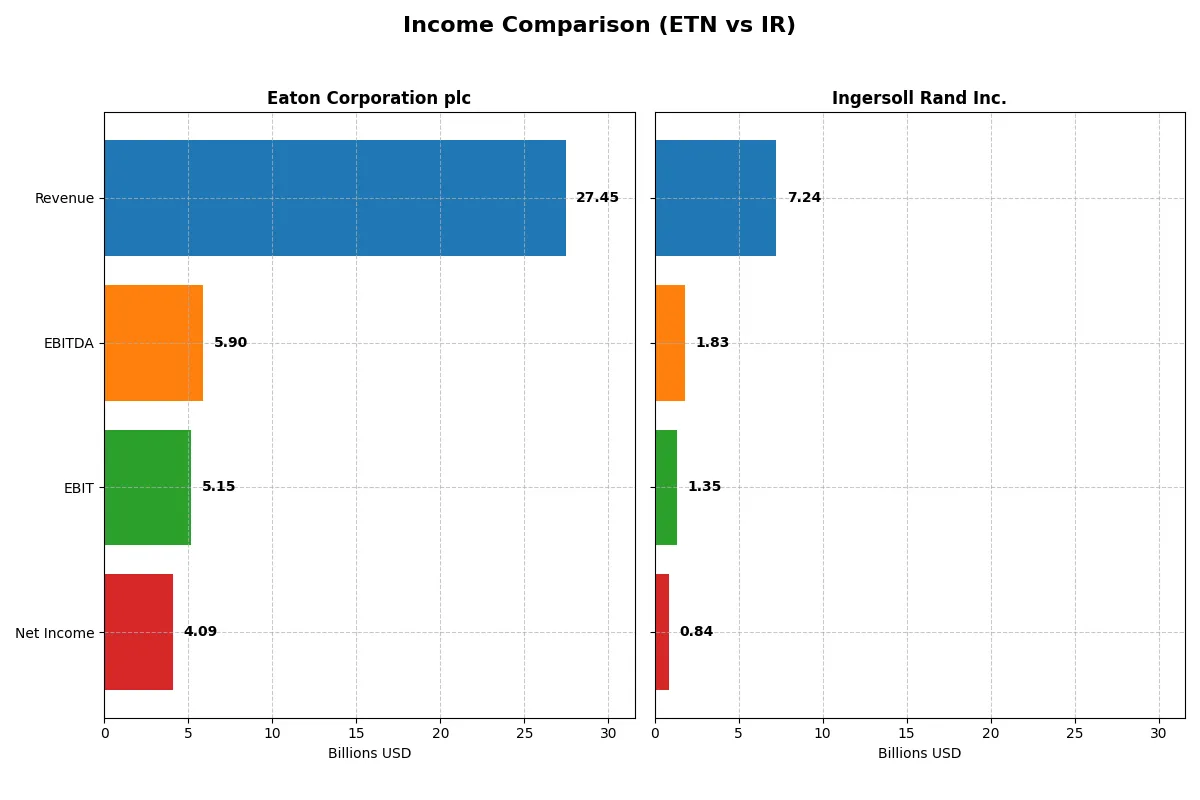
This data dissects the core profitability and scalability of both corporate engines to reveal who dominates the bottom line:
| Metric | Eaton Corporation plc (ETN) | Ingersoll Rand Inc. (IR) |
|---|---|---|
| Revenue | 27.4B | 7.24B |
| Cost of Revenue | 17.1B | 4.07B |
| Operating Expenses | 5.08B | 1.87B |
| Gross Profit | 10.3B | 3.17B |
| EBITDA | 5.90B | 1.83B |
| EBIT | 5.15B | 1.35B |
| Interest Expense | 264M | 213M |
| Net Income | 4.09B | 839M |
| EPS | 10.49 | 2.08 |
| Fiscal Year | 2025 | 2024 |
Income Statement Analysis: The Bottom-Line Duel
This income statement comparison reveals which company operates with greater financial efficiency and profit momentum over recent years.
Eaton Corporation plc Analysis
Eaton’s revenue rose steadily from $19.6B in 2021 to $27.4B in 2025, with net income surging from $2.1B to $4.1B. Gross and net margins remain healthy at 37.6% and 14.9%, showing consistent operational control. The 2025 results highlight strong momentum, supported by a solid 10.3% revenue growth and expanding EBIT margin of 18.8%.
Ingersoll Rand Inc. Analysis
Ingersoll Rand’s revenue grew from $5.2B in 2021 to $7.2B in 2024, with net income improving sharply from $563M to $839M. It boasts a higher gross margin of 43.8%, though net margin trails Eaton at 11.6%. The 2024 year shows moderate revenue growth of 5.2% and healthy EBIT growth of 13.3%, indicating improving operational leverage.
Margin Strength vs. Growth Scale
Eaton leads in absolute scale and net income growth, doubling profits over five years with superior net margin stability. Ingersoll Rand offers a stronger gross margin and rapid earnings expansion from a smaller base. For investors, Eaton’s broad scale and consistent margin improvement suggest resilience, while Ingersoll Rand’s profile suits those seeking higher growth potential in a smaller firm.
Financial Ratios Comparison
These vital ratios act as a diagnostic tool to expose the underlying fiscal health, valuation premiums, and capital efficiency of the companies compared below:
| Ratios | Eaton Corporation plc (ETN) | Ingersoll Rand Inc. (IR) |
|---|---|---|
| ROE | 21.1% | 8.2% |
| ROIC | 13.1% | 6.1% |
| P/E | 30.2 | 43.5 |
| P/B | 6.4 | 3.6 |
| Current Ratio | 1.32 | 2.29 |
| Quick Ratio | 0.81 | 1.71 |
| D/E (Debt-to-Equity) | 0.54 | 0.49 |
| Debt-to-Assets | 25.5% | 27.7% |
| Interest Coverage | 19.8 | 6.1 |
| Asset Turnover | 0.67 | 0.40 |
| Fixed Asset Turnover | 5.40 | 8.59 |
| Payout Ratio | 39.5% | 3.9% |
| Dividend Yield | 1.31% | 0.09% |
| Fiscal Year | 2025 | 2024 |
Efficiency & Valuation Duel: The Vital Signs
Financial ratios act as a company’s DNA, uncovering hidden operational strengths and risks that define its market standing and investor appeal.
Eaton Corporation plc
Eaton impresses with a robust 21.05% ROE and a strong 14.9% net margin, signaling efficient profitability. Its P/E ratio of 30.24 appears stretched compared to sector norms, while a P/B of 6.37 confirms premium valuation. Eaton rewards shareholders with a 1.31% dividend yield, balancing growth through steady R&D investment.
Ingersoll Rand Inc.
Ingersoll Rand shows a lower 8.24% ROE and 11.59% net margin, reflecting moderate profitability. Its P/E at 43.51 marks the stock as expensive, despite a reasonable P/B of 3.58. The company maintains a solid current ratio of 2.29 but offers a minimal 0.09% dividend yield, likely emphasizing reinvestment over payouts.
Premium Valuation vs. Operational Safety
Eaton’s superior returns and balanced payout amidst a stretched valuation contrast with Ingersoll Rand’s safer liquidity but weaker profitability. Eaton suits investors prioritizing growth and income, while Ingersoll Rand appeals to those favoring financial stability with cautious exposure.
Which one offers the Superior Shareholder Reward?
I see Eaton Corporation (ETN) balances dividends and buybacks more effectively than Ingersoll Rand (IR). ETN yields about 1.3% with a 39% payout ratio, sustainably covered by strong free cash flow. Its buyback intensity is moderate, enhancing total returns consistently. IR pays a negligible dividend (0.09% yield) with an ultra-low 4% payout ratio, favoring aggressive reinvestment and buybacks. However, IR’s high P/E and volatile margins raise sustainability concerns. Historically, ETN’s balanced distribution and capital allocation offer a more attractive and reliable total return profile for 2026 investors.
Comparative Score Analysis: The Strategic Profile
The radar chart reveals the fundamental DNA and trade-offs of Eaton Corporation plc and Ingersoll Rand Inc., highlighting their financial strengths and vulnerabilities:
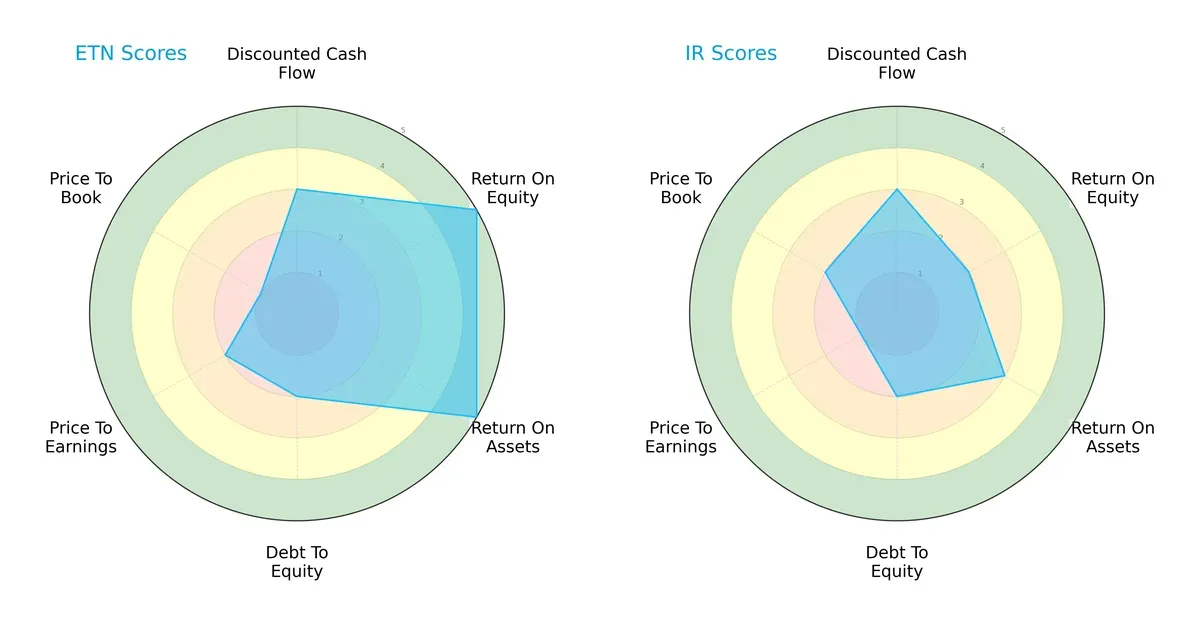
Eaton dominates in profitability with superior ROE (5 vs. 2) and ROA (5 vs. 3) scores, reflecting efficient capital and asset use. Both firms share moderate DCF scores (3), but Eaton’s valuation scores lag sharply, with very unfavorable P/B (1) and unfavorable P/E (2) metrics. Ingersoll Rand shows a slightly more balanced valuation profile but weaker profitability. Eaton’s imbalance suggests reliance on operational excellence despite expensive equity pricing, while Ingersoll Rand leans on valuation appeal but lacks robust returns.
Bankruptcy Risk: Solvency Showdown
Eaton’s Altman Z-Score of 5.04 versus Ingersoll Rand’s 3.76 places both comfortably in the safe zone:
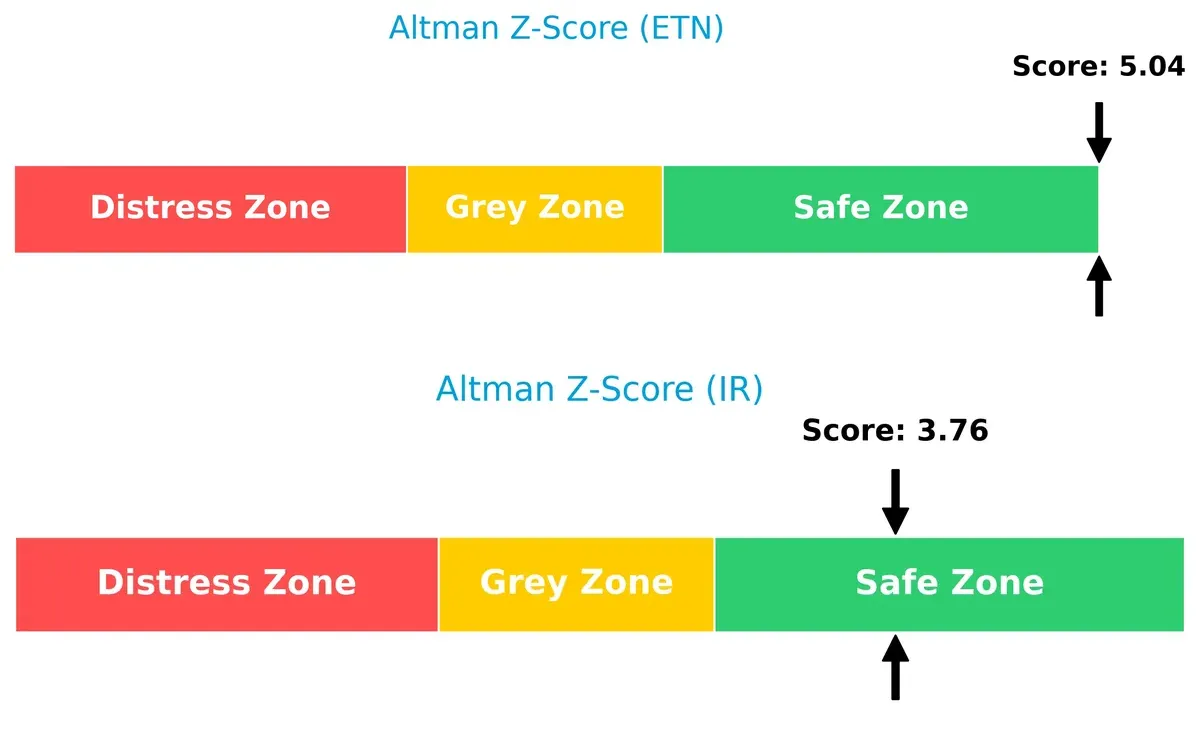
Eaton’s higher score signals a stronger buffer against financial distress, indicating superior solvency and lower bankruptcy risk through this cycle. Ingersoll Rand remains solvent but with less margin for error amid economic headwinds.
Financial Health: Quality of Operations
Eaton scores a 6 on the Piotroski F-Score, slightly ahead of Ingersoll Rand’s 5, both in the “average” range:
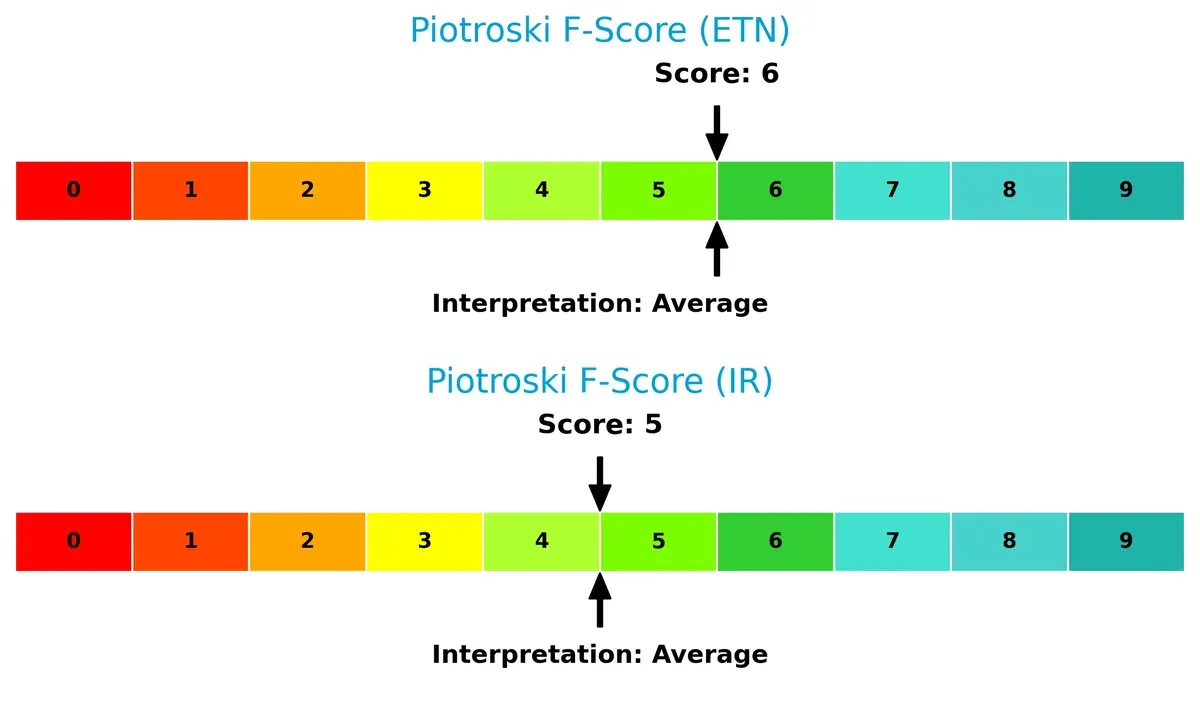
While neither firm hits peak financial health, Eaton’s marginally better score signals steadier internal metrics. Ingersoll Rand’s score flags modest operational concerns that investors should monitor closely.
How are the two companies positioned?
This section dissects Eaton and Ingersoll Rand’s operational DNA by comparing revenue distribution and internal strengths and weaknesses. The goal is to confront their economic moats and determine which model offers the most resilient competitive advantage today.
Revenue Segmentation: The Strategic Mix
This visual comparison dissects how Eaton Corporation plc and Ingersoll Rand Inc. diversify their income streams and where their primary sector bets lie:
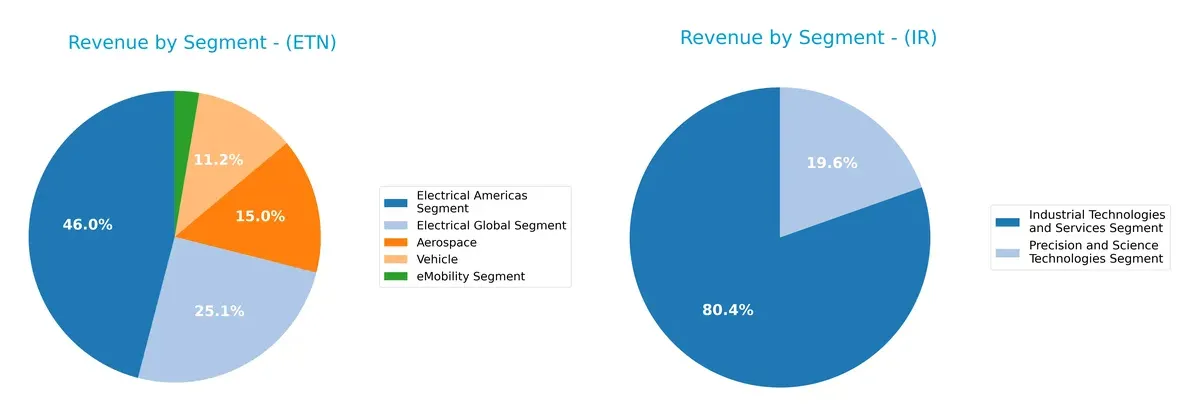
Eaton’s revenue mix spans Aerospace ($3.74B), Electrical Americas ($11.44B), Electrical Global ($6.25B), Vehicle ($2.79B), and eMobility ($669M), showing broad diversification. In contrast, Ingersoll Rand pivots heavily on Industrial Technologies and Services ($5.82B) and a smaller Precision and Science segment ($1.42B), indicating concentrated exposure. Eaton’s diversified portfolio reduces sector risk, while Ingersoll Rand’s focus offers scale advantages but heightens dependence on industrial cycles.
Strengths and Weaknesses Comparison
This table compares the Strengths and Weaknesses of Eaton Corporation plc (ETN) and Ingersoll Rand Inc. (IR):
ETN Strengths
- Diverse product segments including Aerospace, Electrical Americas, Global, Vehicle, and eMobility
- Strong profitability with 14.9% net margin and 21.05% ROE
- Favorable debt-to-assets at 25.53% and high interest coverage of 19.5
- Global geographic presence with strong US and European sales
IR Strengths
- Favorable liquidity ratios with current ratio 2.29 and quick ratio 1.71
- Favorable debt metrics and interest coverage of 6.31
- Good fixed asset turnover at 8.59
- Diversified segments including Industrial Technologies and Precision & Science
- Balanced geographic presence across Americas, Asia Pacific, and EMEA
ETN Weaknesses
- High P/E (30.24) and P/B (6.37) ratios indicate rich valuation
- Moderate liquidity ratios with quick ratio 0.81 and current ratio 1.32
- Asset turnover moderate at 0.67
- Neutral WACC at 8.88%
IR Weaknesses
- Low ROE at 8.24% and moderate ROIC at 6.11%
- High P/E (43.51) and unfavorable P/B (3.58)
- Low net margin 11.59% compared to ETN
- Low dividend yield 0.09%
- Lower asset turnover at 0.4
Both companies show slightly favorable overall financial health but differ in strengths. ETN excels in profitability and product diversification, while IR offers stronger liquidity and asset efficiency. Each faces valuation challenges and operational efficiency concerns influencing strategic priorities.
The Moat Duel: Analyzing Competitive Defensibility
A structural moat is the only reliable defense against long-term profit erosion from rising competition. Let’s examine how Eaton and Ingersoll Rand protect their turf:
Eaton Corporation plc: Powerhouse of Operational Excellence
Eaton’s moat stems from its cost advantage and operational scale, reflected in a strong 18.76% EBIT margin and 4.26% ROIC above WACC. Expanding eMobility and aerospace segments promise deeper moats in 2026.
Ingersoll Rand Inc.: Innovation-Driven Growth Engine
Ingersoll Rand’s intangible assets and innovation fuel rapid ROIC improvement despite a negative spread versus WACC. Its growing EBIT and expansive product portfolio position it for significant market disruption ahead.
Cost Leadership vs. Innovation Momentum
Eaton commands a wider moat with sustainable value creation and margin stability. Ingersoll Rand shows promising ROIC momentum but currently sheds value. Eaton remains better equipped to defend and grow its market share.
Which stock offers better returns?
Over the past 12 months, Eaton Corporation plc and Ingersoll Rand Inc. both showed bullish price trends with accelerating momentum, reflecting strong upward price movements and notable trading volume dynamics.
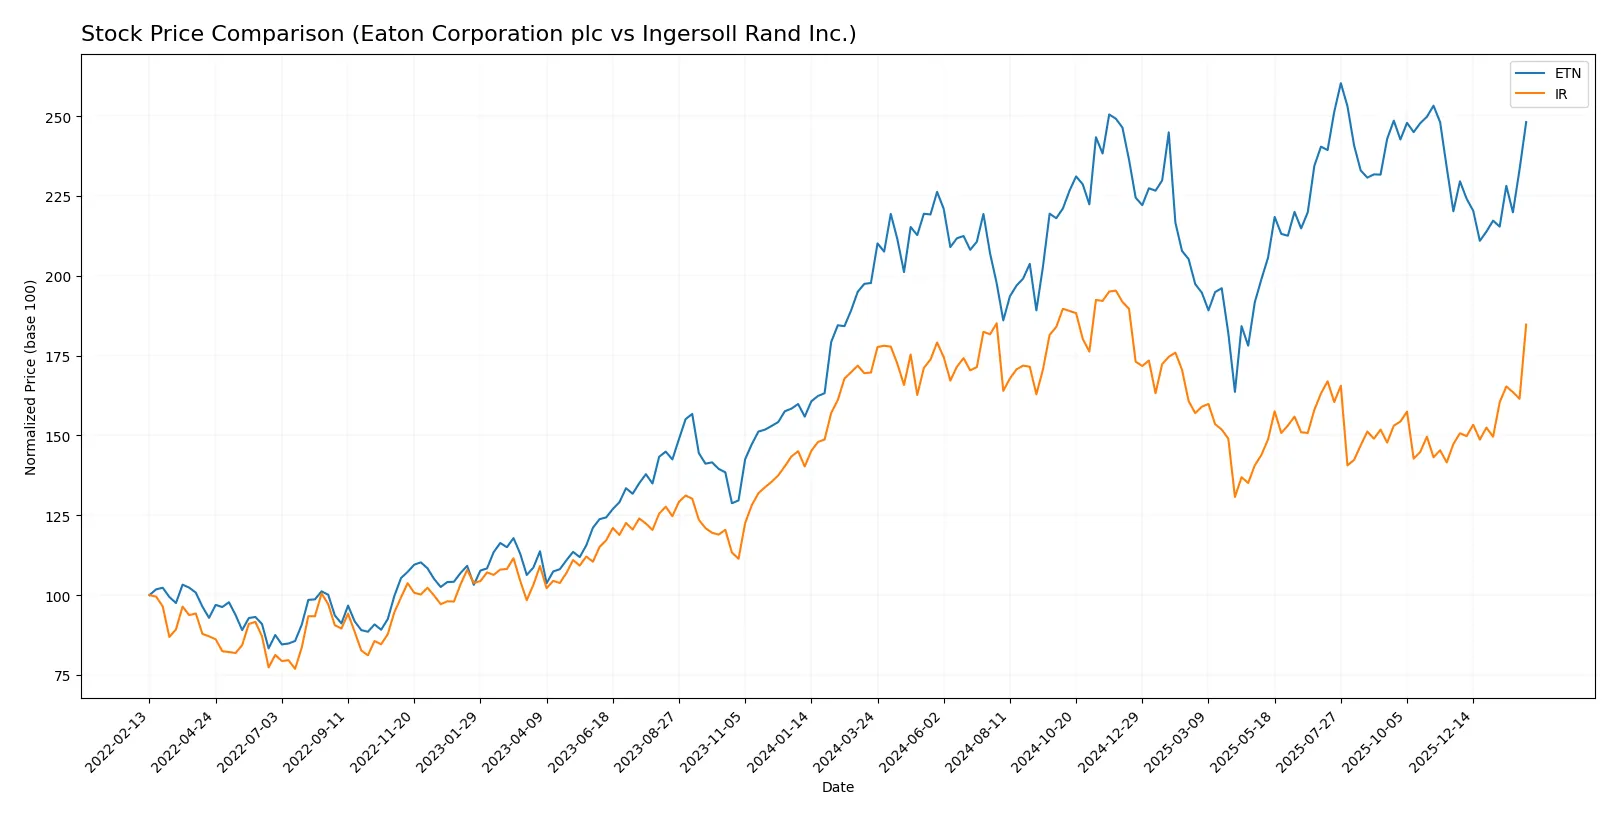
Trend Comparison
Eaton Corporation plc’s stock rose 25.49% over the last year, showing an accelerating bullish trend with a wide price range from 246.52 to 392.17 and high volatility (29.52% std deviation).
Ingersoll Rand Inc.’s stock increased 8.88% over the same period, also accelerating but with lower volatility (8.12% std deviation) and a narrower price range between 69.7 and 104.17.
Eaton’s stock outperformed Ingersoll Rand’s by a wide margin, delivering the highest market gains despite greater price variability.
Target Prices
Analysts present a balanced target price consensus for Eaton Corporation plc and Ingersoll Rand Inc.
| Company | Target Low | Target High | Consensus |
|---|---|---|---|
| Eaton Corporation plc | 295 | 495 | 393.64 |
| Ingersoll Rand Inc. | 87 | 100 | 93 |
The consensus target for Eaton exceeds its current price of 374, indicating moderate upside potential. Ingersoll Rand’s target hovers slightly below its current price of 98.5, signaling cautious optimism.

Don’t Let Luck Decide Your Entry Point
Optimize your entry points with our advanced ProRealTime indicators. You’ll get efficient buy signals with precise price targets for maximum performance. Start outperforming now!
How do institutions grade them?
The following tables summarize recent institutional grades for Eaton Corporation plc and Ingersoll Rand Inc.:
Eaton Corporation plc Grades
Below is a table of recent grades assigned by major institutions to Eaton Corporation plc:
| Grading Company | Action | New Grade | Date |
|---|---|---|---|
| Wells Fargo | maintain | Equal Weight | 2026-02-04 |
| JP Morgan | maintain | Overweight | 2026-01-16 |
| HSBC | upgrade | Buy | 2026-01-16 |
| Morgan Stanley | maintain | Overweight | 2026-01-12 |
| Citigroup | maintain | Buy | 2026-01-12 |
| Barclays | maintain | Equal Weight | 2026-01-07 |
| UBS | downgrade | Neutral | 2026-01-05 |
| Wells Fargo | maintain | Equal Weight | 2025-12-18 |
| Wolfe Research | upgrade | Outperform | 2025-12-09 |
| JP Morgan | maintain | Overweight | 2025-11-06 |
Ingersoll Rand Inc. Grades
Below is a table of recent grades assigned by major institutions to Ingersoll Rand Inc.:
| Grading Company | Action | New Grade | Date |
|---|---|---|---|
| Stifel | maintain | Hold | 2026-01-23 |
| Citigroup | maintain | Buy | 2026-01-12 |
| Wells Fargo | maintain | Overweight | 2026-01-07 |
| Stifel | maintain | Hold | 2025-12-16 |
| Citigroup | maintain | Buy | 2025-12-08 |
| Citigroup | maintain | Buy | 2025-11-03 |
| Baird | maintain | Outperform | 2025-11-03 |
| Stifel | maintain | Hold | 2025-10-20 |
| Wells Fargo | maintain | Overweight | 2025-10-06 |
| Morgan Stanley | maintain | Equal Weight | 2025-08-13 |
Which company has the best grades?
Eaton Corporation plc holds a broader range of Buy and Outperform upgrades, indicating stronger recent institutional enthusiasm. Ingersoll Rand Inc. shows consistent Buy and Overweight ratings but fewer upgrades. Investors might interpret Eaton’s higher frequency of upgrades as a signal of greater analyst conviction.
Risks specific to each company
The following categories identify critical pressure points and systemic threats facing Eaton Corporation plc and Ingersoll Rand Inc. in the 2026 market environment:
1. Market & Competition
Eaton Corporation plc
- Strong global presence in diversified industrial segments; faces intense competition in power management and aerospace sectors.
Ingersoll Rand Inc.
- Focused on mission-critical air and fluid technologies; competes with specialized industrial firms and broader machinery suppliers.
2. Capital Structure & Debt
Eaton Corporation plc
- Moderate debt levels with debt-to-assets at 25.53%, solid interest coverage of 19.5, indicating manageable leverage.
Ingersoll Rand Inc.
- Slightly higher leverage at 27.65% debt-to-assets; interest coverage lower at 6.31, suggesting tighter debt servicing capacity.
3. Stock Volatility
Eaton Corporation plc
- Beta of 1.18 suggests moderate sensitivity to market swings; relatively stable trading range between $232 and $400.
Ingersoll Rand Inc.
- Higher beta at 1.31 indicates greater volatility; trading range $66 to $99 reflects wider price fluctuations.
4. Regulatory & Legal
Eaton Corporation plc
- Global operations expose Eaton to complex regulatory environments, particularly in electrical and aerospace sectors.
Ingersoll Rand Inc.
- Regulatory risks concentrated in US and international industrial technologies; compliance in medical and energy industries critical.
5. Supply Chain & Operations
Eaton Corporation plc
- Extensive global supply chain with potential risks in component sourcing and geopolitical disruptions.
Ingersoll Rand Inc.
- Supply chain focused on specialized air and fluid equipment; operational risks from manufacturing and distribution dependencies.
6. ESG & Climate Transition
Eaton Corporation plc
- Strong emphasis on power management and eMobility solutions aligns with climate transition trends; ESG initiatives significant.
Ingersoll Rand Inc.
- Growing focus on energy-efficient technologies but ESG disclosures less comprehensive; transition risks remain material.
7. Geopolitical Exposure
Eaton Corporation plc
- Headquartered in Ireland with global footprint, exposed to EU, US, and emerging market geopolitical risks.
Ingersoll Rand Inc.
- US-based with diverse international markets; geopolitical tensions could impact supply chains and sales in Asia and Europe.
Which company shows a better risk-adjusted profile?
Eaton faces its largest risk in market competition due to its broad industrial scope and high valuation multiples, increasing vulnerability to cyclical downturns. Ingersoll Rand’s most significant risk lies in capital structure, with tighter interest coverage and higher volatility undermining financial flexibility. Despite slightly higher leverage, Eaton’s robust interest coverage and safer Altman Z-Score suggest a stronger risk-adjusted profile. The recent spike in Eaton’s stock price and sturdy credit metrics reinforce my concern over Ingersoll Rand’s financial resilience under stress.
Final Verdict: Which stock to choose?
Eaton Corporation plc’s superpower lies in its robust value creation, demonstrated by a consistently high ROIC surpassing its WACC. This indicates a sustainable competitive advantage with growing profitability. A point of vigilance is its premium valuation multiples, which may temper near-term upside. Eaton suits portfolios focused on consistent, aggressive growth.
Ingersoll Rand Inc. offers a strategic moat through its strong balance sheet and superior liquidity ratios, supporting operational resilience. It trails Eaton in profitability metrics but compensates with a safer financial profile and steady free cash flow. This positions Ingersoll Rand well for investors seeking Growth at a Reasonable Price (GARP).
If you prioritize durable competitive advantage and superior value creation, Eaton outshines due to its proven ability to generate excess returns. However, if you seek financial stability with moderate growth prospects, Ingersoll Rand offers better stability and a more conservative risk profile. Both present analytical scenarios worth consideration depending on your risk tolerance and growth objectives.
Disclaimer: Investment carries a risk of loss of initial capital. The past performance is not a reliable indicator of future results. Be sure to understand risks before making an investment decision.
Go Further
I encourage you to read the complete analyses of Eaton Corporation plc and Ingersoll Rand Inc. to enhance your investment decisions: