Home > Comparison > Industrials > ETN vs ITW
The strategic rivalry between Eaton Corporation plc and Illinois Tool Works Inc. shapes the Industrials sector’s competitive landscape. Eaton, a diversified power management leader, contrasts with Illinois Tool Works’ specialized industrial equipment and components model. This analysis pits Eaton’s broad industrial reach against ITW’s focused manufacturing expertise. I will evaluate which company’s operational strategy offers superior risk-adjusted returns for a diversified portfolio in today’s evolving industrial environment.
Table of contents
Companies Overview
Eaton Corporation plc and Illinois Tool Works Inc. both anchor the industrial machinery sector with strong global footprints and diversified portfolios.
Eaton Corporation plc: Power Management Leader
Eaton Corporation plc dominates the power management space, generating revenue from electrical components, aerospace systems, and vehicle powertrain products. Its 2026 strategy centers on expanding its eMobility segment and enhancing power distribution technologies. Eaton’s broad product suite supports critical infrastructure and industrial applications worldwide, highlighting its diversified industrial strength.
Illinois Tool Works Inc.: Industrial Equipment Innovator
Illinois Tool Works Inc. excels in manufacturing industrial products across seven segments, including automotive components and food equipment. Its 2026 focus targets growth in specialty products and advanced welding solutions. ITW’s distribution channels serve diverse end markets, emphasizing innovation and reliability in industrial manufacturing systems.
Strategic Collision: Similarities & Divergences
Both companies thrive in industrial machinery but embrace distinct philosophies: Eaton leans toward integrated power and aerospace systems, while ITW pursues diversified, specialized industrial equipment solutions. Their primary battleground lies in supplying industrial manufacturers with reliable, high-tech components. Eaton offers a broad power management portfolio; ITW excels in specialized, segment-focused innovation, shaping unique investment profiles for each.
Income Statement Comparison
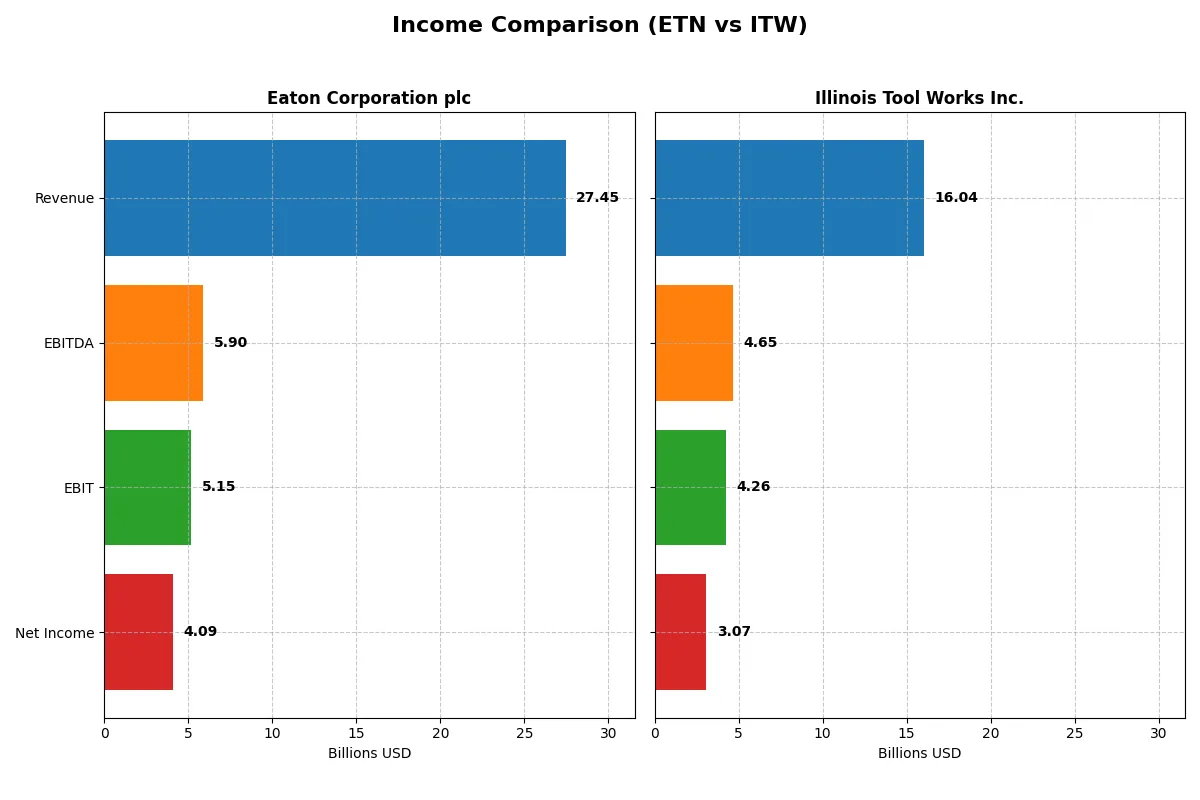
This data dissects the core profitability and scalability of both corporate engines to reveal who dominates the bottom line:
| Metric | Eaton Corporation plc (ETN) | Illinois Tool Works Inc. (ITW) |
|---|---|---|
| Revenue | 27.4B | 16.0B |
| Cost of Revenue | 17.1B | 8.97B |
| Operating Expenses | 5.08B | 2.86B |
| Gross Profit | 10.3B | 7.08B |
| EBITDA | 5.90B | 4.65B |
| EBIT | 5.15B | 4.26B |
| Interest Expense | 264M | 292M |
| Net Income | 4.09B | 3.07B |
| EPS | 10.49 | 10.52 |
| Fiscal Year | 2025 | 2025 |
Income Statement Analysis: The Bottom-Line Duel
This income statement comparison exposes which company runs a more efficient and profitable financial engine through recent years.
Eaton Corporation plc Analysis
Eaton’s revenue climbed steadily from 19.6B in 2021 to 27.4B in 2025, with net income soaring from 2.14B to 4.09B. Its gross margin held firm at 37.6% in 2025, while net margin remained healthy near 15%. Eaton sustained strong momentum with double-digit revenue growth and expanding earnings per share, reflecting operational efficiency.
Illinois Tool Works Inc. Analysis
Illinois Tool Works’ revenue showed modest growth, rising from 14.5B in 2021 to 16B in 2025, while net income increased from 2.69B to 3.07B. The company boasts a robust 44.1% gross margin and a superior 19.1% net margin in 2025. However, its recent one-year growth metrics show declining EBIT and earnings per share, signaling pressure on profitability.
Margin Strength vs. Growth Momentum
Eaton excels in revenue and net income growth, nearly doubling net profits over five years with consistent margin expansion. ITW, meanwhile, delivers stronger margins but faces recent earnings contraction. For investors, Eaton’s profile suits growth-focused strategies, while ITW appeals more to those prioritizing margin resilience.
Financial Ratios Comparison
These vital ratios act as a diagnostic tool to expose the underlying fiscal health, valuation premiums, and capital efficiency of the companies compared here:
| Ratios | Eaton Corporation plc (ETN) | Illinois Tool Works Inc. (ITW) |
|---|---|---|
| ROE | 21.1% | 95.1% |
| ROIC | 13.1% | 24.5% |
| P/E | 30.2 | 23.5 |
| P/B | 6.37 | 22.3 |
| Current Ratio | 1.32 | 1.21 |
| Quick Ratio | 0.81 | 0.89 |
| D/E | 0.54 | 2.78 |
| Debt-to-Assets | 25.5% | 55.5% |
| Interest Coverage | 19.8 | 14.4 |
| Asset Turnover | 0.67 | 0.99 |
| Fixed Asset Turnover | 5.40 | 7.19 |
| Payout Ratio | 39.5% | 58.2% |
| Dividend Yield | 1.31% | 2.48% |
| Fiscal Year | 2025 | 2025 |
Efficiency & Valuation Duel: The Vital Signs
Financial ratios serve as a company’s DNA, uncovering hidden risks and operational strengths that numbers alone cannot reveal.
Eaton Corporation plc
Eaton posts a solid 21.05% ROE and a 14.9% net margin, signaling strong profitability. Its P/E of 30.24 and P/B of 6.37 suggest the stock trades at a premium, somewhat stretched against peers. Eaton balances shareholder returns with a modest 1.31% dividend yield, reinvesting substantially in R&D for growth.
Illinois Tool Works Inc.
Illinois Tool Works shines with an exceptional 95.07% ROE and a 19.11% net margin, demonstrating superior efficiency. Its P/E ratio of 23.48 appears fairly valued, though a high P/B of 22.32 flags overvaluation risks. The company rewards shareholders with a 2.48% dividend yield, supported by robust capital returns despite elevated debt levels.
Premium Valuation vs. Operational Safety
Illinois Tool Works delivers outstanding returns but carries heavier debt and valuation concerns. Eaton offers balanced profitability with more conservative leverage but trades at a stretched premium. Investors seeking growth with moderate risk may prefer Eaton, while those targeting high efficiency amid valuation risks might lean toward Illinois Tool Works.
Which one offers the Superior Shareholder Reward?
I compare Eaton Corporation plc (ETN) and Illinois Tool Works Inc. (ITW) on dividend yield, payout ratios, and buyback intensity. ETN pays a 1.3% dividend yield with a 39% payout ratio, balancing steady dividends and moderate buybacks. ITW offers a higher 2.5% yield with a 58% payout ratio but carries heavier debt leverage, limiting buyback firepower. Historically, ITW’s aggressive dividends and buybacks generate strong total returns but risk sustainability given its 2.8x debt-to-equity. ETN’s conservative payout and robust free cash flow coverage indicate a more durable model. I conclude ITW delivers superior near-term shareholder reward, but ETN’s distribution is more sustainable for long-term value in 2026.
Comparative Score Analysis: The Strategic Profile
The radar chart reveals the fundamental DNA and trade-offs of Eaton Corporation plc and Illinois Tool Works Inc., highlighting their core financial strengths and weaknesses:
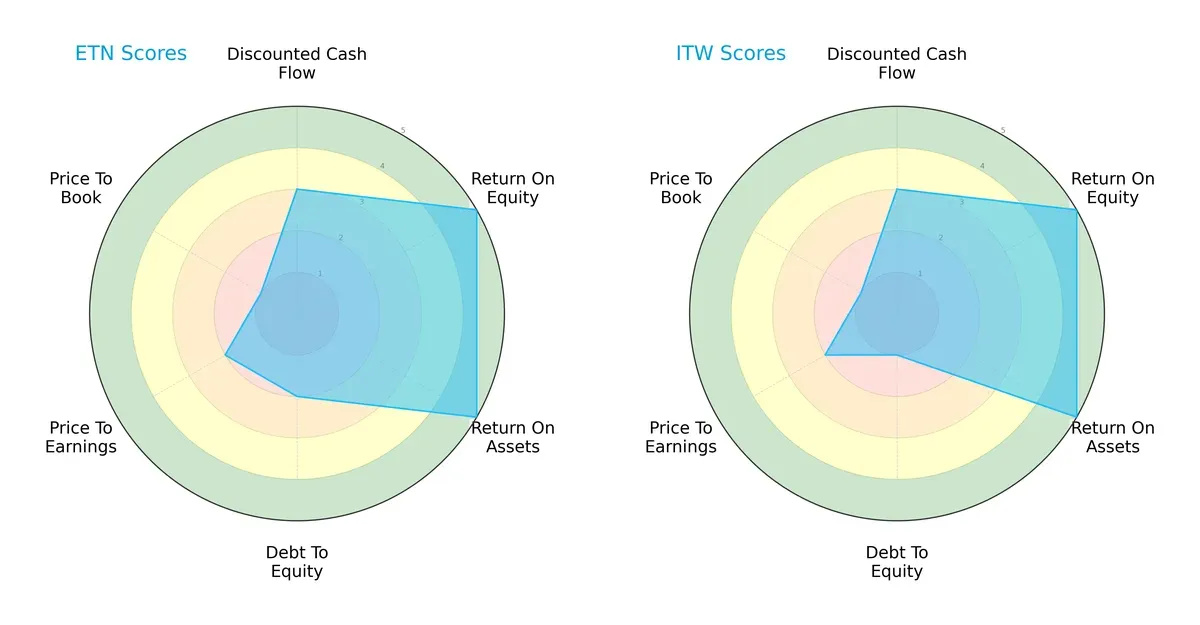
Both companies show strong operational efficiency with top marks in ROE and ROA, signaling excellent asset and equity utilization. Eaton edges Illinois Tool Works with a better debt-to-equity score (2 vs. 1), indicating slightly lower leverage risk. However, both firms face valuation challenges, scoring low on price-to-earnings and price-to-book metrics. Eaton’s profile is more balanced across metrics, while Illinois Tool Works leans heavily on operational excellence despite higher leverage.
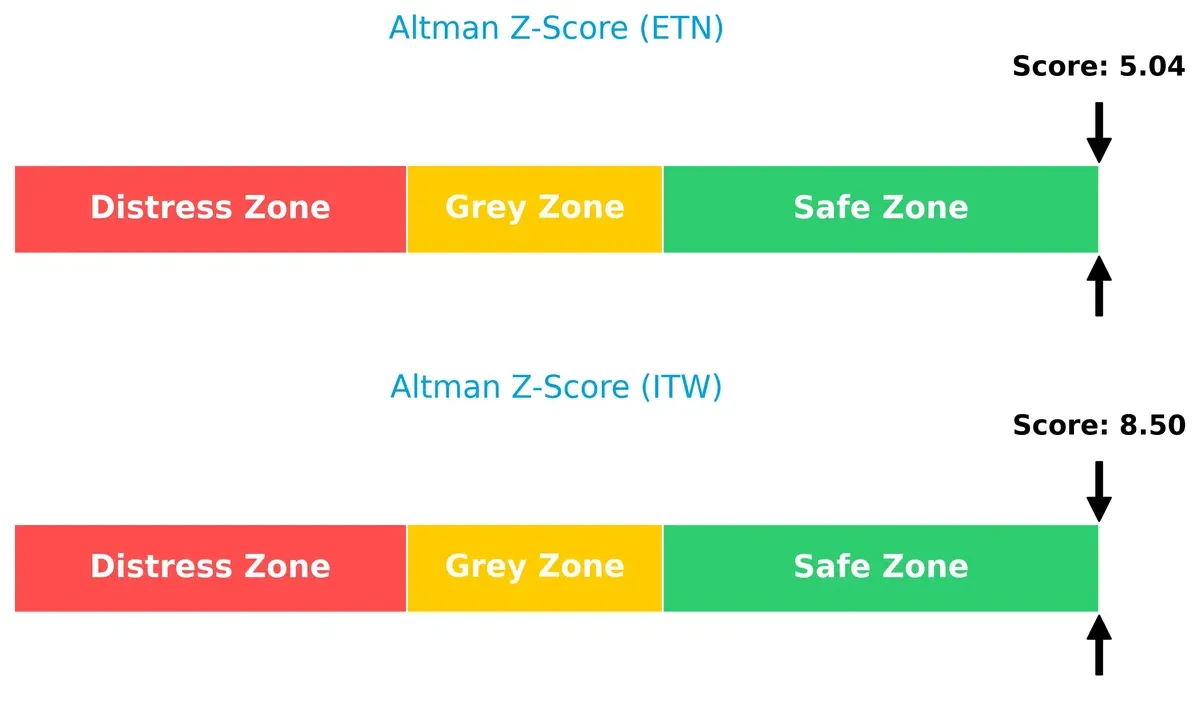
Bankruptcy Risk: Solvency Showdown
Eaton’s Altman Z-Score of 5.0 versus Illinois Tool Works’ 8.5 places both firms comfortably in the safe zone, with Illinois Tool Works holding a stronger cushion against financial distress in this cycle:
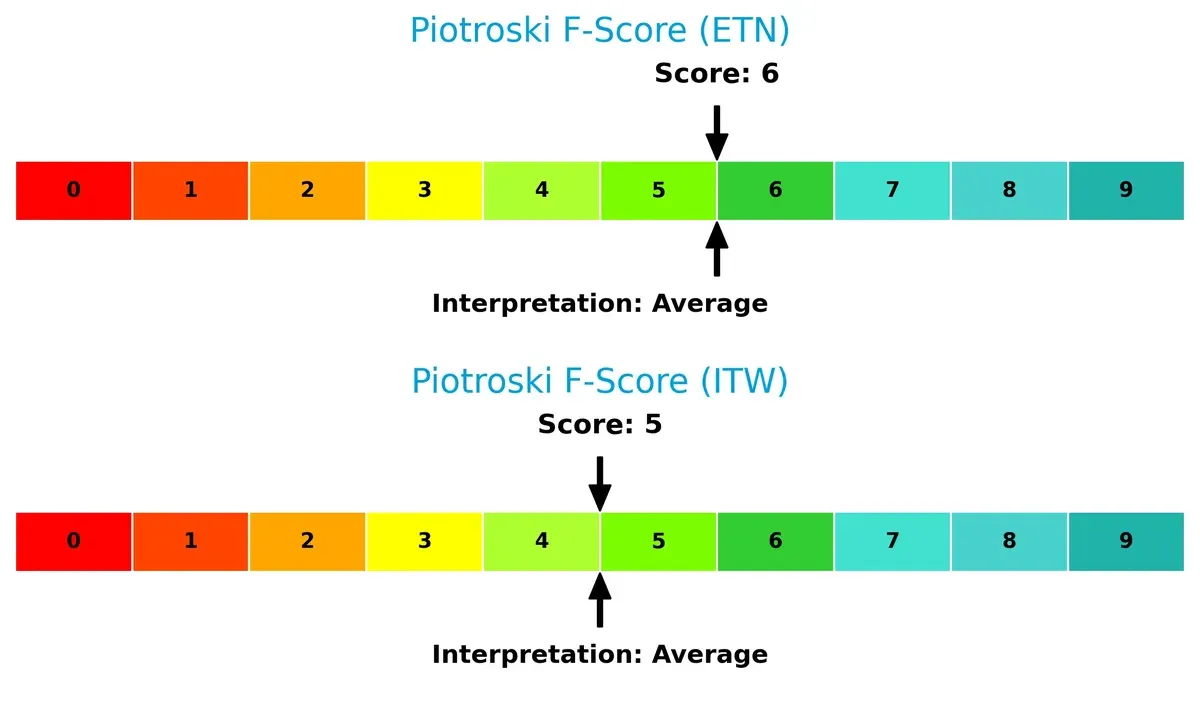
Financial Health: Quality of Operations
Eaton posts a Piotroski F-Score of 6, slightly above Illinois Tool Works’ 5, suggesting marginally better internal financial health and fewer red flags in profitability, liquidity, and efficiency metrics:
How are the two companies positioned?
This section dissects Eaton and Illinois Tool Works’ operational DNA by comparing revenue distribution and internal dynamics. The goal is to confront their economic moats and identify which business model offers the most resilient, sustainable competitive advantage today.
Revenue Segmentation: The Strategic Mix
This visual comparison dissects how Eaton Corporation plc and Illinois Tool Works Inc. diversify their income streams and where their primary sector bets lie:
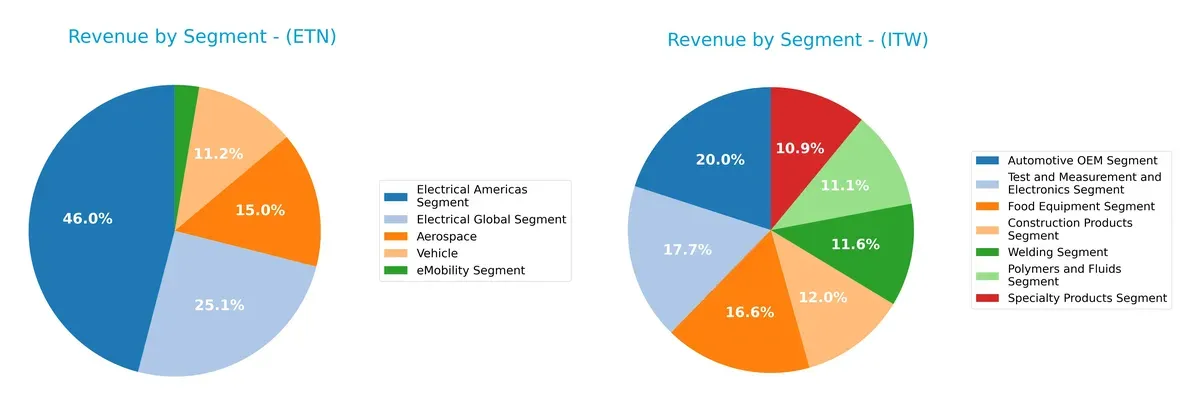
Eaton relies heavily on Electrical Americas ($11.4B) and Electrical Global ($6.2B) segments, anchoring over half its revenue. Aerospace ($3.7B) and Vehicle ($2.8B) add depth but less dominance. ITW presents a more balanced portfolio, with Automotive OEM ($3.2B), Test & Measurement ($2.8B), and Food Equipment ($2.6B) each contributing significant shares. Eaton’s concentration risks contrast with ITW’s diversified exposure, suggesting Eaton depends on infrastructure dominance while ITW pivots across industrial niches.
Strengths and Weaknesses Comparison
This table compares the strengths and weaknesses of Eaton Corporation plc and Illinois Tool Works Inc.:
Eaton Corporation plc Strengths
- Diverse product segments including Aerospace, Electrical, Vehicle, and eMobility
- Strong net margin at 14.9%
- Favorable ROE at 21.05%
- Solid debt-to-assets ratio at 25.53%
- High interest coverage at 19.5
- Global presence with significant U.S. and Europe revenues
Illinois Tool Works Inc. Strengths
- Wide product diversification across Automotive OEM, Construction, Food Equipment, and more
- Higher net margin at 19.11%
- Exceptionally strong ROE at 95.07%
- Favorable ROIC of 24.49% well above WACC
- Higher dividend yield at 2.48%
- Broad geographic reach including Asia Pacific and North America
Eaton Corporation plc Weaknesses
- Unfavorable valuation metrics with PE at 30.24 and PB at 6.37
- Neutral liquidity ratios, quick ratio at 0.81 may limit short-term flexibility
- Asset turnover moderate at 0.67
- Limited eMobility revenue scale at 669M
Illinois Tool Works Inc. Weaknesses
- Unfavorable debt levels with DE at 2.78 and debt-to-assets at 55.54%
- Unfavorable PB at 22.32 indicating valuation concerns
- Slightly lower interest coverage at 14.58
- PE ratio neutral at 23.48 could imply fair valuation
Overall, Eaton shows balanced strength in profitability and conservative leverage with room to improve valuation metrics. Illinois Tool Works excels in profitability and global diversification but carries higher debt and valuation risks. These factors shape each company’s strategic focus on managing financial structure and market positioning.
The Moat Duel: Analyzing Competitive Defensibility
A structural moat is the only true shield protecting long-term profits from relentless competitive erosion in capital-intensive industries:
Eaton Corporation plc: Diversified Industrial Powerhouse with Cost Advantage
Eaton leverages a broad product portfolio and scale-driven cost advantage, reflected in a 4.26% ROIC surplus over WACC and stable 18.8% EBIT margins. Its expanding eMobility segment could deepen this moat in 2026.
Illinois Tool Works Inc.: Precision Niche with Strong Intangible Assets
ITW’s moat stems from specialized engineered fastening systems and brand reputation, delivering a commanding 15.85% ROIC above WACC and superior 26.5% EBIT margins. Challenges in recent growth could be offset by innovation in automotive OEM markets.
Cost Leadership vs. Specialized Engineering Excellence
While both firms create value with growing ROICs, ITW’s wider moat outpaces Eaton’s due to higher capital efficiency and margin strength. ITW is better positioned to defend market share amid evolving industrial demand.
Which stock offers better returns?
Over the past year, Eaton Corporation plc and Illinois Tool Works Inc. both show upward price momentum, with Eaton exhibiting stronger gains amid evolving trading dynamics.
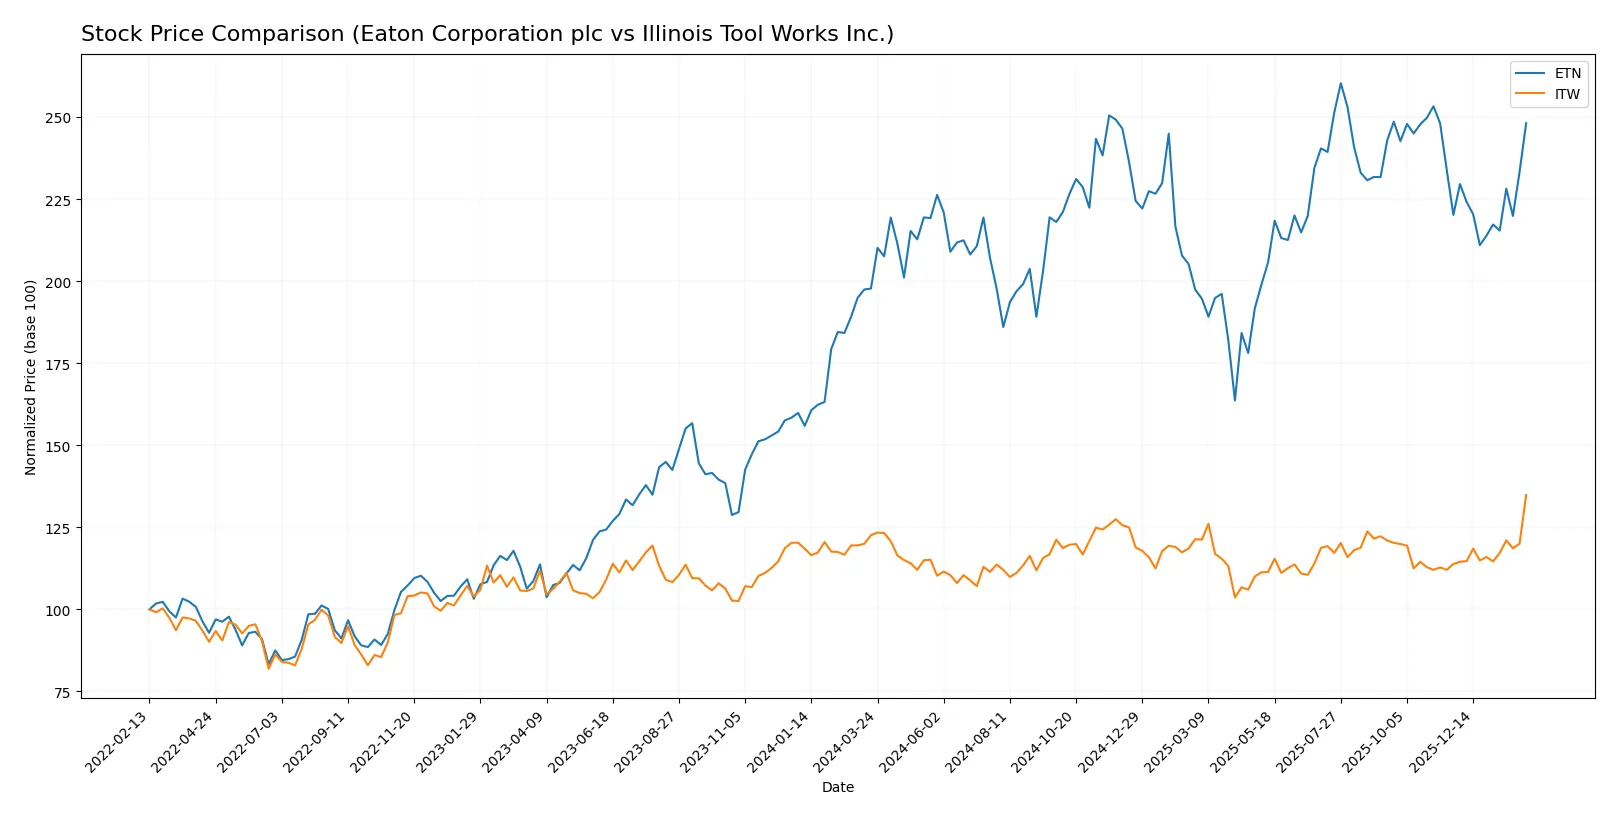
Trend Comparison
Eaton’s stock rose 25.5% over the past 12 months, displaying a bullish trend with accelerating momentum and a high volatility level (std dev 29.52). It peaked at 392.17 and bottomed at 246.52.
Illinois Tool Works gained 10.0% in the same period, also bullish with acceleration but lower volatility (std dev 11.41). Its price ranged between 225.57 and 293.57, showing steadier movement.
Eaton outperformed Illinois Tool Works by a wide margin, delivering the highest market performance while exhibiting greater price variability and acceleration.
Target Prices
Analysts present a mixed but optimistic target consensus for Eaton Corporation plc and Illinois Tool Works Inc.
| Company | Target Low | Target High | Consensus |
|---|---|---|---|
| Eaton Corporation plc | 295 | 495 | 393.64 |
| Illinois Tool Works Inc. | 244 | 285 | 267.86 |
Eaton’s consensus target at 393.64 USD suggests moderate upside from its current 373.82 USD price. Illinois Tool Works’ consensus target of 267.86 USD implies a slight downside from its current 293.57 USD price.

Don’t Let Luck Decide Your Entry Point
Optimize your entry points with our advanced ProRealTime indicators. You’ll get efficient buy signals with precise price targets for maximum performance. Start outperforming now!
How do institutions grade them?
Eaton Corporation plc Grades
Here are the recent grades issued by reputable financial institutions for Eaton Corporation plc:
| Grading Company | Action | New Grade | Date |
|---|---|---|---|
| Wells Fargo | Maintain | Equal Weight | 2026-02-04 |
| JP Morgan | Maintain | Overweight | 2026-01-16 |
| HSBC | Upgrade | Buy | 2026-01-16 |
| Morgan Stanley | Maintain | Overweight | 2026-01-12 |
| Citigroup | Maintain | Buy | 2026-01-12 |
| Barclays | Maintain | Equal Weight | 2026-01-07 |
| UBS | Downgrade | Neutral | 2026-01-05 |
| Wells Fargo | Maintain | Equal Weight | 2025-12-18 |
| Wolfe Research | Upgrade | Outperform | 2025-12-09 |
| JP Morgan | Maintain | Overweight | 2025-11-06 |
Illinois Tool Works Inc. Grades
Below are the recent grades from recognized institutions for Illinois Tool Works Inc.:
| Grading Company | Action | New Grade | Date |
|---|---|---|---|
| Wells Fargo | Maintain | Underweight | 2026-02-04 |
| Citigroup | Maintain | Neutral | 2026-02-04 |
| Wells Fargo | Maintain | Underweight | 2026-01-07 |
| Goldman Sachs | Downgrade | Sell | 2025-12-16 |
| B of A Securities | Upgrade | Neutral | 2025-11-18 |
| Barclays | Maintain | Underweight | 2025-10-27 |
| Wells Fargo | Maintain | Underweight | 2025-10-27 |
| Truist Securities | Maintain | Hold | 2025-10-27 |
| Truist Securities | Maintain | Hold | 2025-10-08 |
| Barclays | Downgrade | Underweight | 2025-08-14 |
Which company has the best grades?
Eaton Corporation plc consistently receives higher grades, including multiple Buy and Overweight ratings. Illinois Tool Works Inc. faces predominantly Underweight and Neutral ratings. This disparity signals stronger institutional confidence in Eaton, which may influence investor sentiment and valuation.
Risks specific to each company
The following categories identify the critical pressure points and systemic threats facing both firms in the 2026 market environment:
1. Market & Competition
Eaton Corporation plc
- Strong presence in power management with diversified segments but faces pricing pressure from global peers.
Illinois Tool Works Inc.
- Broad industrial product range with automotive and construction focus, exposed to cyclical demand shifts.
2. Capital Structure & Debt
Eaton Corporation plc
- Moderate leverage with debt-to-assets at 25.5%, interest coverage strong at 19.5x.
Illinois Tool Works Inc.
- High leverage with debt-to-assets at 55.5%, weaker debt-to-equity profile signals elevated financial risk.
3. Stock Volatility
Eaton Corporation plc
- Beta of 1.18 indicates slightly above-market volatility, typical for industrial machinery.
Illinois Tool Works Inc.
- Beta of 1.16 similarly shows moderate market sensitivity, reflecting cyclical industrial exposure.
4. Regulatory & Legal
Eaton Corporation plc
- Operating globally, faces regulatory scrutiny in multiple jurisdictions, especially on power and aerospace products.
Illinois Tool Works Inc.
- U.S.-based, subject to stringent domestic regulations, particularly in automotive and construction sectors.
5. Supply Chain & Operations
Eaton Corporation plc
- Complex global supply chains for electrical and vehicle components create exposure to disruptions.
Illinois Tool Works Inc.
- Diverse product segments increase operational complexity and vulnerability to raw material cost fluctuations.
6. ESG & Climate Transition
Eaton Corporation plc
- Active in eMobility and power efficiency, aligning well with climate transition demands.
Illinois Tool Works Inc.
- Emerging ESG initiatives but larger carbon footprint from diverse industrial products remains a challenge.
7. Geopolitical Exposure
Eaton Corporation plc
- Headquartered in Ireland, with broad international operations exposed to trade tensions and currency risks.
Illinois Tool Works Inc.
- U.S.-based with significant global sales, facing risks from tariffs and geopolitical uncertainties.
Which company shows a better risk-adjusted profile?
Eaton’s moderate leverage and diversified global footprint mitigate financial and operational risks better than Illinois Tool Works’ high debt levels. However, ITW’s stronger profitability and higher dividend yield support resilience. Eaton’s lower debt-to-assets ratio and higher interest coverage signal a safer balance sheet. Conversely, ITW’s elevated debt-to-equity ratio and unfavorable debt scores raise caution. Both firms operate in cyclical sectors, but Eaton’s exposure to emerging eMobility trends offers strategic risk mitigation. Recent data show Eaton maintains a safer financial zone with an Altman Z-score above 5, compared to ITW’s higher leverage despite a higher Z-score.
In summary, Eaton faces its biggest risk from market competition and pricing pressure, while Illinois Tool Works’ primary risk lies in its capital structure and high financial leverage. Eaton displays a better risk-adjusted profile due to stronger balance sheet metrics and more favorable debt management, justifying a cautious preference despite ITW’s superior profitability metrics.
Final Verdict: Which stock to choose?
Eaton Corporation plc (ETN) stands out for its consistent value creation and growing profitability, fueled by a robust return on invested capital well above its cost of capital. Its main point of vigilance is the relatively elevated price-to-book ratio, which may pressure valuation. ETN fits well in portfolios targeting steady growth with a moderate risk appetite.
Illinois Tool Works Inc. (ITW) impresses with a formidable strategic moat, demonstrated by exceptional returns on equity and invested capital. Its industrial niche and recurring operational efficiency offer a durable competitive edge. While carrying higher financial leverage than ETN, ITW provides a safer income profile with a higher dividend yield, appealing to GARP investors seeking balanced growth and income.
If you prioritize sustainable value creation with moderate valuation risk, ETN is the compelling choice due to its solid income growth and operational efficiency. However, if you seek a stronger moat and superior return metrics combined with income stability, ITW offers better stability and commands a premium for its entrenched competitive advantage.
Disclaimer: Investment carries a risk of loss of initial capital. The past performance is not a reliable indicator of future results. Be sure to understand risks before making an investment decision.
Go Further
I encourage you to read the complete analyses of Eaton Corporation plc and Illinois Tool Works Inc. to enhance your investment decisions: