Home > Comparison > Industrials > ETN vs IEX
The strategic rivalry between Eaton Corporation plc and IDEX Corporation shapes the trajectory of the industrial machinery sector. Eaton, a capital-intensive power management giant, contrasts with IDEX’s diversified applied solutions model focused on fluid and metering technologies. This head-to-head highlights a contest between scale-driven operational breadth and specialized technological innovation. This analysis will determine which corporate strategy offers a superior risk-adjusted return for a diversified portfolio in today’s industrial landscape.
Table of contents
Companies Overview
Eaton Corporation plc and IDEX Corporation stand as key players in the industrial machinery sector, shaping global power and fluid solutions markets.
Eaton Corporation plc: Power Management Giant
Eaton dominates as a power management company, generating revenue from electrical components, aerospace systems, and vehicle power solutions. Its 2026 focus sharpens on eMobility and aerospace segments, driving innovation in hybrid systems and power distribution. The firm leverages its diversified product portfolio to sustain competitive advantage and market reach worldwide.
IDEX Corporation: Specialty Applied Solutions Leader
IDEX excels in applied solutions, earning revenue through fluid metering technologies, health sciences, and fire safety products. Its 2026 strategy emphasizes expanding precision fluidics and firefighting equipment. Serving niche industrial and life science markets, the company builds strength by targeting specialized, high-margin segments with technical innovation and custom solutions.
Strategic Collision: Similarities & Divergences
Both firms operate in industrial machinery but diverge philosophically: Eaton pursues broad power management integration, while IDEX focuses on specialized fluid and safety systems. Their primary battleground lies in industrial fluid control and safety markets. Eaton’s scale contrasts with IDEX’s niche precision, defining distinct investment profiles balancing diversification against specialization.
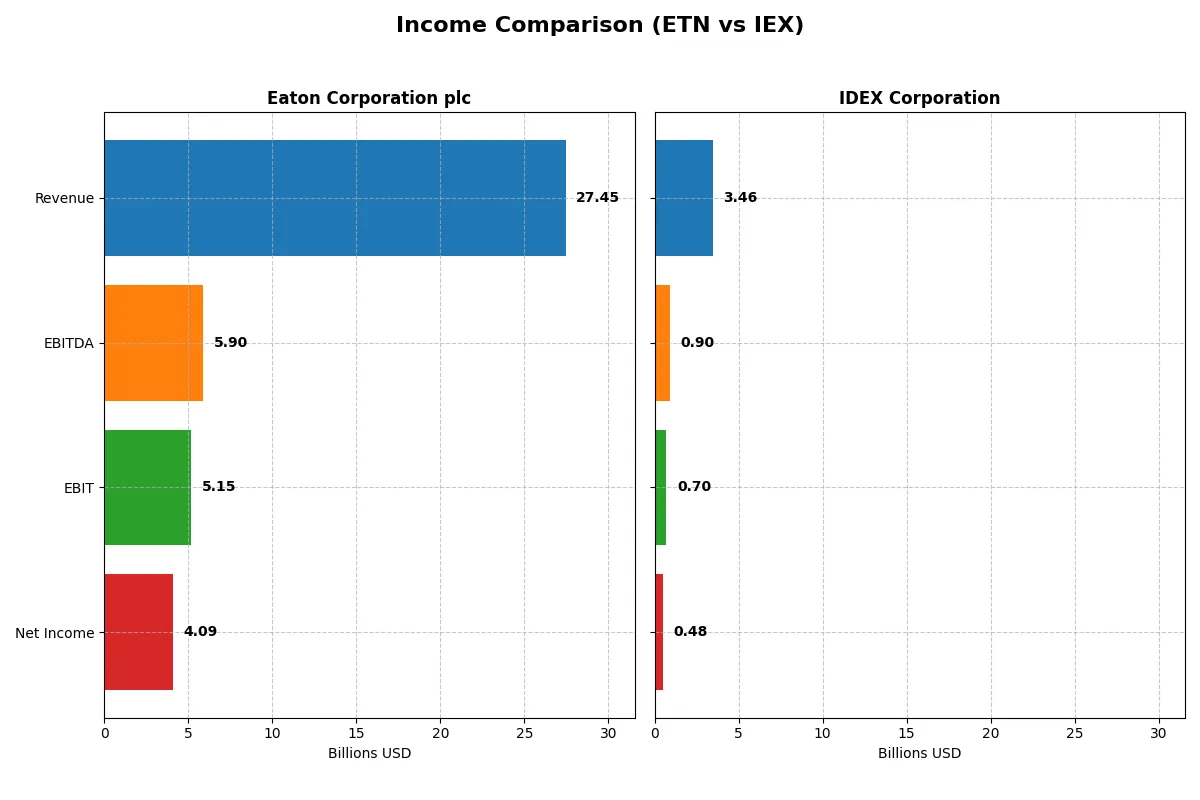
Income Statement Comparison
This data dissects the core profitability and scalability of both corporate engines to reveal who dominates the bottom line:
| Metric | Eaton Corporation plc (ETN) | IDEX Corporation (IEX) |
|---|---|---|
| Revenue | 27.4B | 3.46B |
| Cost of Revenue | 17.1B | 1.92B |
| Operating Expenses | 5.08B | 819M |
| Gross Profit | 10.3B | 1.54B |
| EBITDA | 5.90B | 903M |
| EBIT | 5.15B | 697M |
| Interest Expense | 264M | 64M |
| Net Income | 4.09B | 483M |
| EPS | 10.49 | 6.41 |
| Fiscal Year | 2025 | 2025 |
Income Statement Analysis: The Bottom-Line Duel
This income statement comparison reveals which company converts revenue into profits more efficiently and sustains margin strength over time.
Eaton Corporation plc Analysis
Eaton’s revenue climbed from 19.6B in 2021 to 27.4B in 2025, showing robust growth. Net income surged from 2.1B to 4.1B, nearly doubling across five years. Gross margin stays strong at 37.6%, while net margin holds a healthy 14.9% despite a slight recent dip. In 2025, Eaton accelerates earnings growth with a 10% EPS rise, reflecting solid operational momentum.
IDEX Corporation Analysis
IDEX’s revenue advanced moderately from 2.76B in 2021 to 3.46B in 2025. Net income increased modestly from 449M to 483M, showing slower profit growth. Gross margin leads at 44.5%, with net margin near 14%, but margins contracted in the last year. Earnings per share declined by 3.5% in 2025, signaling pressure on profitability despite stable revenue.
Margin Expansion vs. Growth Dynamism
Eaton delivers stronger revenue and net income growth with expanding margins, evidencing superior scale and efficiency gains. IDEX maintains wider gross margins but struggles with net margin compression and EPS decline. For investors prioritizing sustained profit growth and operational leverage, Eaton’s profile appears more compelling based on current financial trends.
Financial Ratios Comparison
These vital ratios act as a diagnostic tool to expose the underlying fiscal health, valuation premiums, and capital efficiency of Eaton Corporation plc (ETN) and IDEX Corporation (IEX):
| Ratios | Eaton Corporation plc (ETN) | IDEX Corporation (IEX) |
|---|---|---|
| ROE | 21.1% | 12.0% |
| ROIC | 13.1% | 8.6% |
| P/E | 30.2 | 27.7 |
| P/B | 6.37 | 3.33 |
| Current Ratio | 1.32 | 2.86 |
| Quick Ratio | 0.81 | 2.02 |
| D/E | 0.54 | 0.0002 |
| Debt-to-Assets | 25.5% | 0.01% |
| Interest Coverage | 19.8 | 11.2 |
| Asset Turnover | 0.67 | 0.50 |
| Fixed Asset Turnover | 5.40 | 7.39 |
| Payout ratio | 39.5% | 44.0% |
| Dividend yield | 1.31% | 1.59% |
| Fiscal Year | 2025 | 2025 |
Efficiency & Valuation Duel: The Vital Signs
Financial ratios serve as a company’s DNA, uncovering hidden risks and revealing operational strength behind the numbers.
Eaton Corporation plc
Eaton posts a strong 21.05% ROE and a healthy 14.9% net margin, reflecting solid profitability. Its P/E of 30.24 signals a stretched valuation compared to broader markets. Eaton balances this with a modest 1.31% dividend yield, underpinned by efficient capital allocation and a focus on steady shareholder returns.
IDEX Corporation
IDEX offers a moderate 12.0% ROE and a 13.98% net margin, indicating decent profitability but less efficiency than Eaton. Its P/E ratio of 27.73 also suggests a somewhat expensive valuation. IDEX maintains a 1.59% dividend yield and shows strong liquidity and low leverage, emphasizing financial stability in capital management.
Premium Valuation vs. Operational Safety
Eaton delivers higher profitability but at a more stretched valuation, while IDEX offers safer liquidity and lower debt with moderate returns. Investors prioritizing growth might lean toward Eaton; those valuing financial resilience may prefer IDEX’s steadier profile.
Which one offers the Superior Shareholder Reward?
I observe Eaton Corporation (ETN) offers a steady 1.3% dividend yield with a 39% payout ratio, balanced by moderate buybacks. IDEX Corporation (IEX) yields 1.6% with a lighter 44% payout but more aggressive buybacks. IEX’s lower leverage and stronger free cash flow coverage suggest a more sustainable distribution strategy. IEX’s combination of dividends and robust buybacks, supported by a higher operating cash flow ratio (1.18 vs. ETN’s 0.55), points to superior total shareholder returns in 2026. I recommend IEX for investors seeking a more dynamic and sustainable reward profile.
Comparative Score Analysis: The Strategic Profile
The radar chart reveals the fundamental DNA and strategic trade-offs of Eaton Corporation plc and IDEX Corporation, highlighting their financial strengths and vulnerabilities:
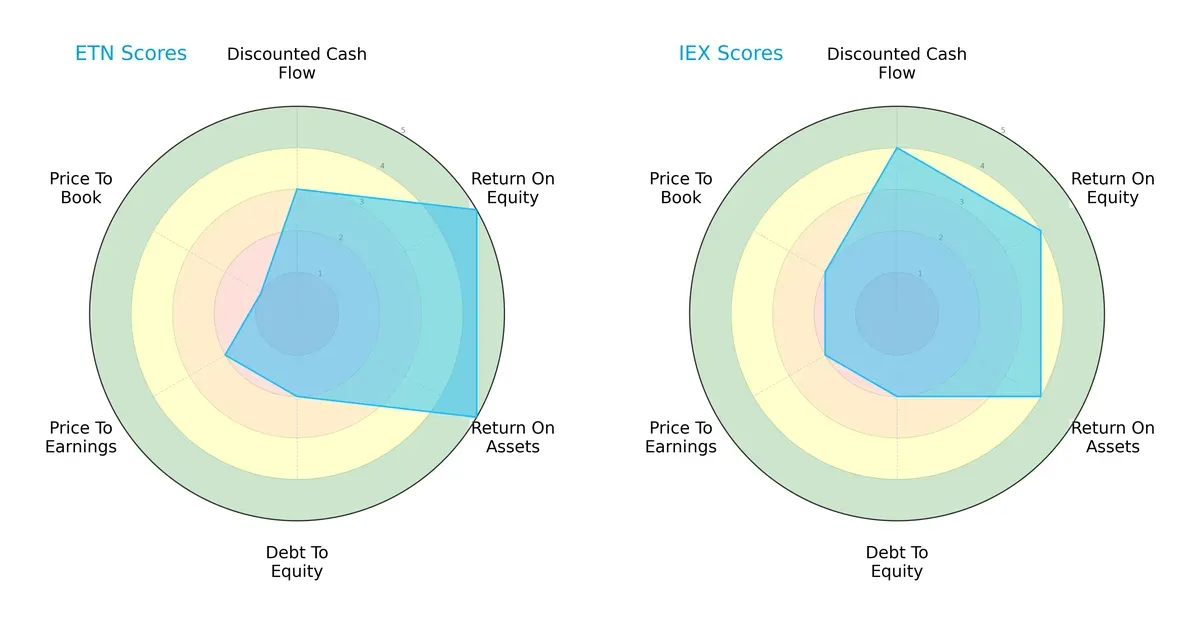
Eaton excels in profitability with top ROE and ROA scores (5 each), showing operational efficiency. However, its valuation scores (PE: 2, PB: 1) and debt profile (2) indicate caution. IDEX presents a more balanced profile with favorable DCF (4), ROE (4), ROA (4), and slightly better valuation metrics, though debt remains a shared weakness. Eaton relies heavily on earning power, while IDEX offers steadier valuation and cash flow appeal.
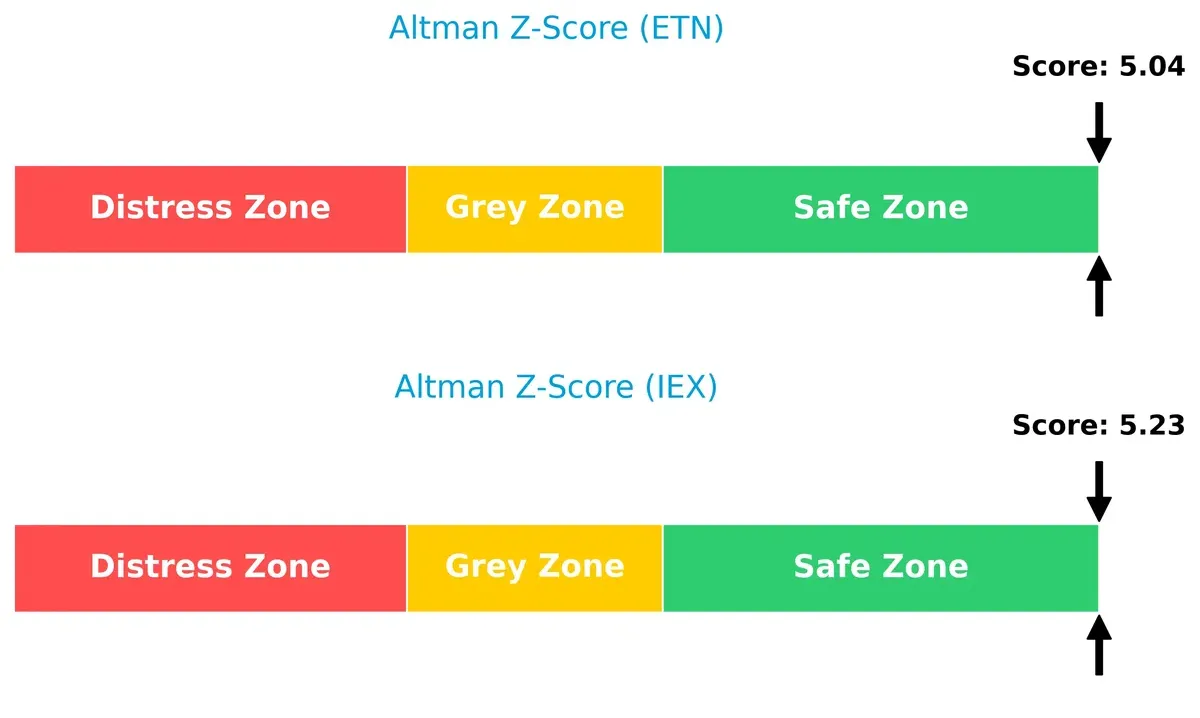
Bankruptcy Risk: Solvency Showdown
The Altman Z-Score comparison shows both firms firmly in the safe zone, with IDEX slightly ahead at 5.23 versus Eaton’s 5.04, implying strong long-term solvency for both in this cycle:
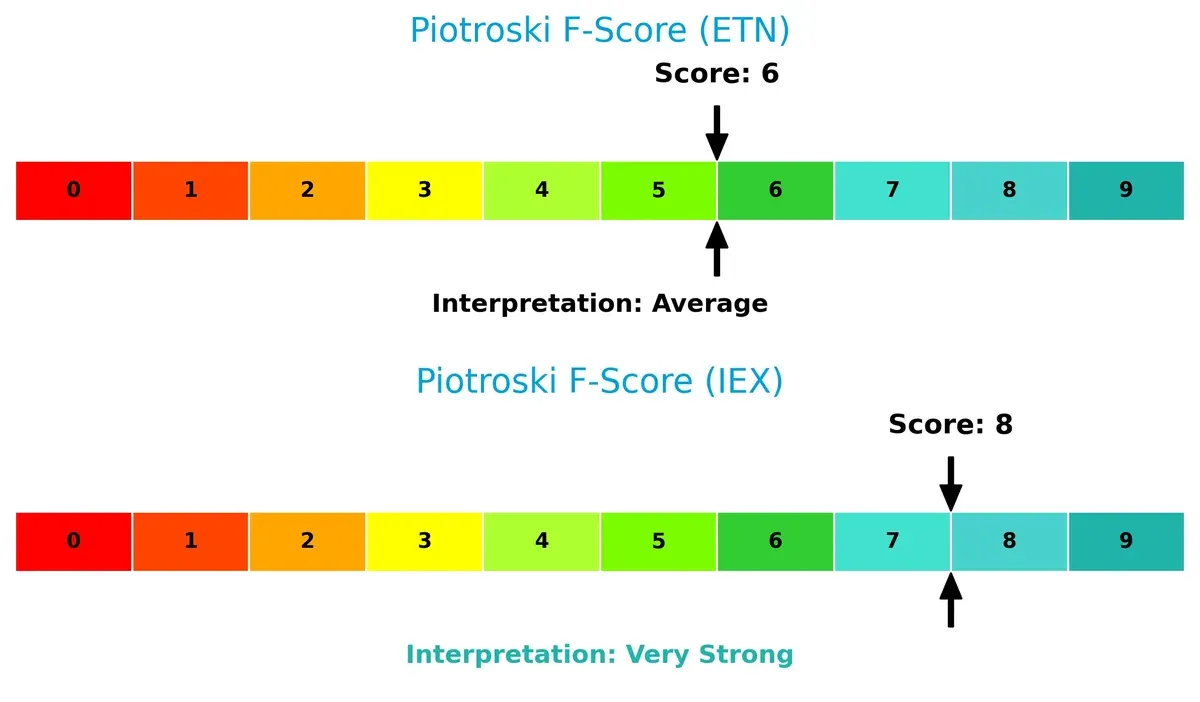
Financial Health: Quality of Operations
IDEX outperforms Eaton on the Piotroski F-Score, scoring 8 (very strong) against Eaton’s 6 (average). This suggests IDEX maintains superior internal financial health and fewer operational red flags:
How are the two companies positioned?
This section dissects the operational DNA of Eaton and IDEX by comparing their revenue distribution and internal dynamics. The final goal is to confront their economic moats to identify the most resilient competitive advantage in today’s market.
Revenue Segmentation: The Strategic Mix
This visual comparison dissects how Eaton Corporation plc and IDEX Corporation diversify their income streams and where their primary sector bets lie:
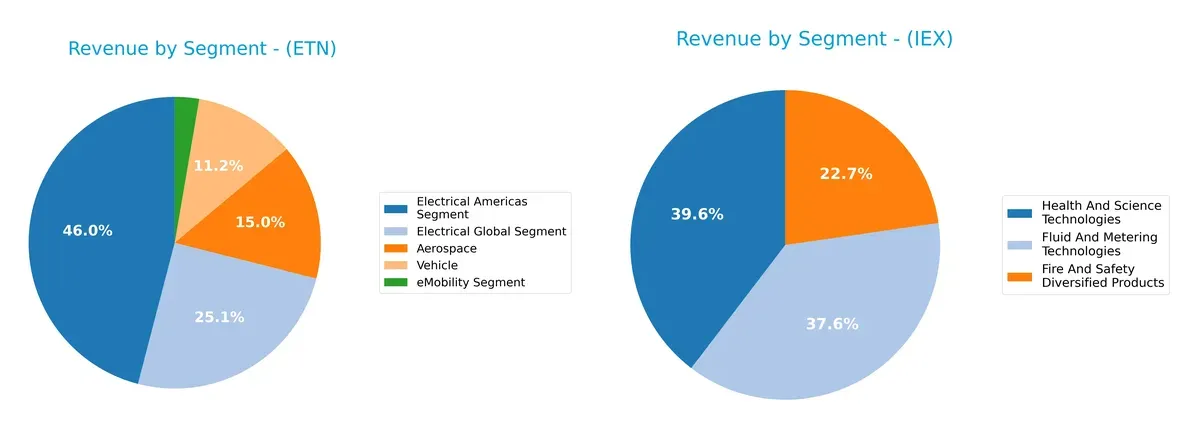
Eaton’s revenue dwarfs IDEX’s with $11.4B in Electrical Americas and $6.2B in Electrical Global segments anchoring its portfolio. Eaton pivots on electrical infrastructure and aerospace, showing some diversification but a clear reliance on electrical segments. IDEX, by contrast, presents a balanced mix across Health And Science ($1.3B), Fluid And Metering ($1.2B), and Fire And Safety ($0.74B), minimizing concentration risk and enhancing resilience in niche industrial markets.
Strengths and Weaknesses Comparison
This table compares the Strengths and Weaknesses of Eaton Corporation plc (ETN) and IDEX Corporation (IEX):
ETN Strengths
- Diverse revenue across Aerospace, Electrical Americas, Electrical Global, Vehicle, eMobility segments
- Strong profitability with 14.9% net margin and 21.05% ROE
- Favorable debt metrics with 25.53% debt-to-assets and high interest coverage 19.5x
- Robust fixed asset turnover at 5.4 indicating efficient use of assets
- Significant global presence with large sales in US, Europe, Asia Pacific regions
IEX Strengths
- Favorable liquidity ratios, current ratio 2.86 and quick ratio 2.02, reflecting strong short-term financial health
- Debt-free capital structure with 0.0 debt-to-equity and minimal debt-to-assets 0.01%
- Favorable interest coverage at 10.82x supports capacity to service debt
- Diverse product segments including Health, Safety, and Fluid Technologies
- Solid fixed asset turnover at 7.39 showing asset efficiency
ETN Weaknesses
- High valuation multiples with P/E at 30.24 and P/B at 6.37 may pressure returns
- Neutral liquidity ratios, current ratio 1.32 and quick ratio 0.81, could limit flexibility
- Moderate asset turnover 0.67 below ideal for capital-intensive industries
- Limited clear market share dominance visible from segmentation data
IEX Weaknesses
- Lower profitability with net margin of 13.98% and ROE at 12.0%, below ETN
- Asset turnover of 0.5, unfavorable compared to ETN, suggesting less efficient use of assets
- Higher unfavorable ratios percentage (21.43%) compared to ETN
- Smaller global footprint with concentrated revenue in US and Europe, less diversification
Both companies exhibit slightly favorable financial profiles but face distinct challenges. ETN’s strengths lie in strong profitability and broad global diversification, offset by high valuation and moderate asset efficiency. IEX benefits from a debt-free balance sheet and superior liquidity but contends with lower profitability and less diversified geographic exposure. These contrasts shape their strategic positioning within their industries.
The Moat Duel: Analyzing Competitive Defensibility
A structural moat is the only true shield protecting long-term profits from relentless competition erosion. Let’s dissect how Eaton and IDEX defend their turf:
Eaton Corporation plc: Wide Moat from Operational Excellence
Eaton leverages a robust cost advantage and diversified industrial portfolio. Its financials reveal a very favorable ROIC trending 76% higher than WACC, signaling strong value creation. New eMobility products could deepen this moat in 2026.
IDEX Corporation: Narrow Moat with Specialized Innovation
IDEX relies on intangible assets and niche product innovation. Unlike Eaton, its ROIC falls below WACC and declines 24%, indicating shrinking profitability. Expansion in health and safety tech offers upside but risks remain.
Cost Leadership vs. Innovation Niche: The Moat Showdown
Eaton’s growing ROIC and broad market reach deliver a wider, deeper moat than IDEX’s weakening returns and narrower focus. Eaton stands better poised to defend and expand market share through 2026.
Which stock offers better returns?
The past year shows Eaton Corporation plc with a clear 25.5% price increase, while IDEX Corporation declines nearly 12%, reflecting divergent trading dynamics and momentum shifts.
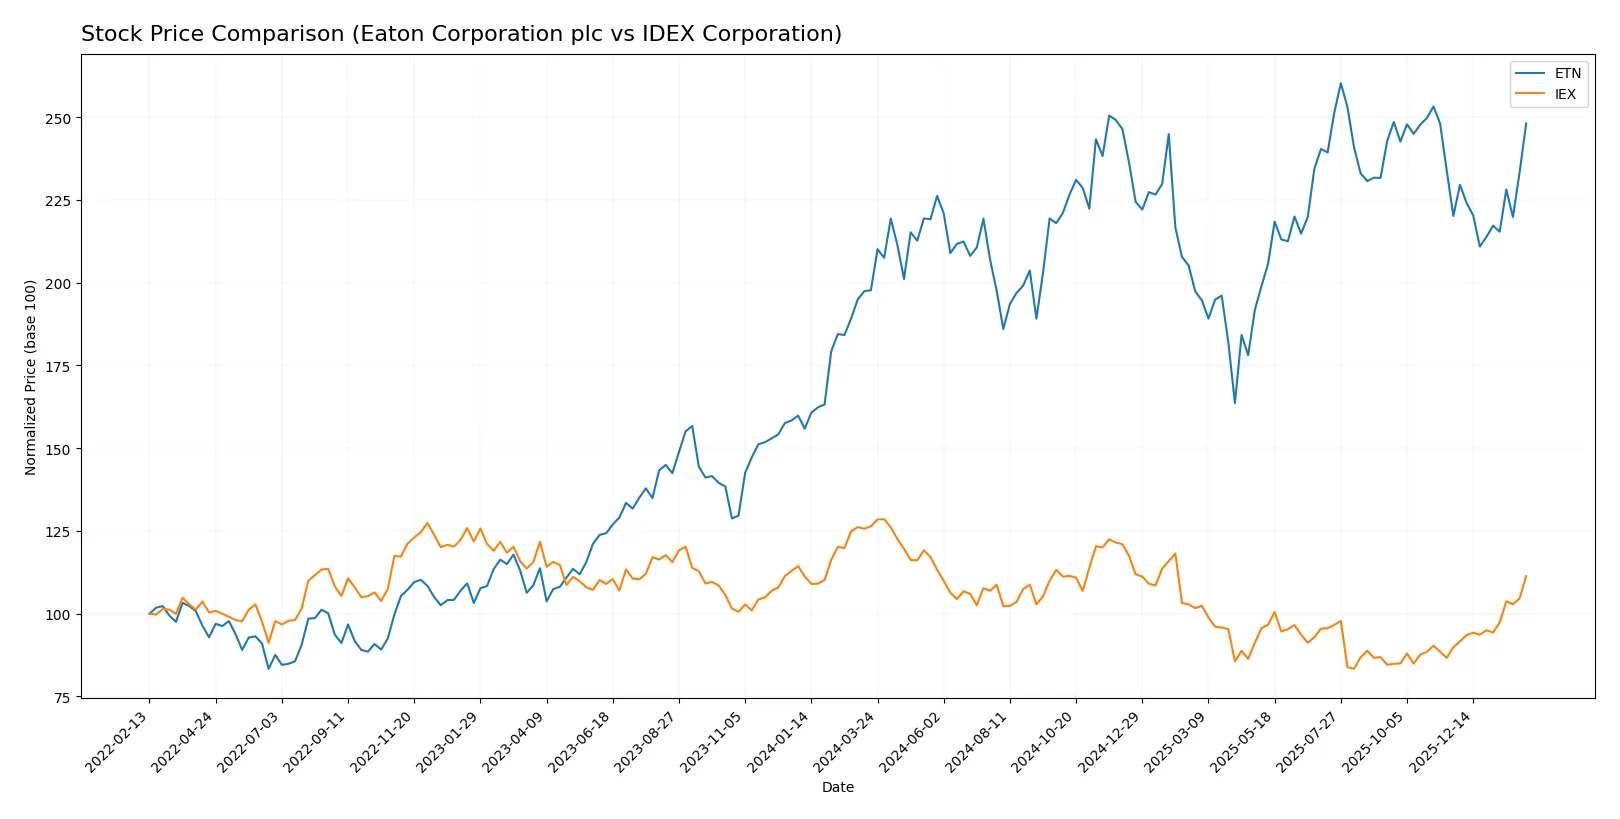
Trend Comparison
Eaton Corporation plc’s stock rose 25.5% over the past year, signaling a bullish trend with accelerating momentum and a high volatility level of 29.52. Its price ranged from 246.52 to 392.17.
IDEX Corporation’s stock fell 11.9%, marking a bearish trend despite recent acceleration. Volatility stands at 22.67, with prices fluctuating between 158.26 and 244.02 over the year.
Eaton outperformed IDEX by a wide margin in market returns over the period, delivering the highest price appreciation and stronger long-term momentum.
Target Prices
Analysts present a solid target consensus for Eaton Corporation plc and IDEX Corporation, reflecting confidence in their industrial machinery segments.
| Company | Target Low | Target High | Consensus |
|---|---|---|---|
| Eaton Corporation plc | 295 | 495 | 394 |
| IDEX Corporation | 220 | 247 | 236 |
Eaton’s consensus target of 394 exceeds its current price of 374, signaling upside potential. IDEX’s target of 236 also surpasses its current 211, indicating analyst optimism across both stocks.

Don’t Let Luck Decide Your Entry Point
Optimize your entry points with our advanced ProRealTime indicators. You’ll get efficient buy signals with precise price targets for maximum performance. Start outperforming now!
How do institutions grade them?
The following tables summarize recent institutional grades for Eaton Corporation plc and IDEX Corporation:
Eaton Corporation plc Grades
This table lists the latest grades issued by major financial institutions for Eaton Corporation plc.
| Grading Company | Action | New Grade | Date |
|---|---|---|---|
| Wells Fargo | Maintain | Equal Weight | 2026-02-04 |
| JP Morgan | Maintain | Overweight | 2026-01-16 |
| HSBC | Upgrade | Buy | 2026-01-16 |
| Morgan Stanley | Maintain | Overweight | 2026-01-12 |
| Citigroup | Maintain | Buy | 2026-01-12 |
| Barclays | Maintain | Equal Weight | 2026-01-07 |
| UBS | Downgrade | Neutral | 2026-01-05 |
| Wells Fargo | Maintain | Equal Weight | 2025-12-18 |
| Wolfe Research | Upgrade | Outperform | 2025-12-09 |
| JP Morgan | Maintain | Overweight | 2025-11-06 |
IDEX Corporation Grades
This table lists the latest grades issued by major financial institutions for IDEX Corporation.
| Grading Company | Action | New Grade | Date |
|---|---|---|---|
| Argus Research | Upgrade | Buy | 2026-02-06 |
| TD Cowen | Maintain | Buy | 2026-02-05 |
| Citigroup | Maintain | Buy | 2026-02-05 |
| DA Davidson | Maintain | Neutral | 2026-02-05 |
| RBC Capital | Maintain | Outperform | 2026-02-05 |
| Stifel | Maintain | Buy | 2026-01-23 |
| Citigroup | Maintain | Buy | 2025-12-08 |
| RBC Capital | Maintain | Outperform | 2025-10-30 |
| Stifel | Maintain | Buy | 2025-10-20 |
| Oppenheimer | Maintain | Outperform | 2025-10-07 |
Which company has the best grades?
IDEX Corporation consistently receives buy and outperform ratings from institutions, signaling higher confidence. Eaton shows a mix of equal weight, overweight, and some downgrades, indicating more cautious sentiment. Investors may view IDEX’s grades as a stronger endorsement.
Risks specific to each company
The following categories identify the critical pressure points and systemic threats facing both firms in the 2026 market environment:
1. Market & Competition
Eaton Corporation plc (ETN)
- Large market cap of $145B supports scale advantages but faces intense industrial machinery competition.
IDEX Corporation (IEX)
- Smaller market cap at $16B limits scale; niche markets expose IEX to specialized competitors.
2. Capital Structure & Debt
Eaton Corporation plc (ETN)
- Moderate debt-to-assets at 25.5%; interest coverage strong at 19.5x, signaling manageable leverage risk.
IDEX Corporation (IEX)
- Virtually debt-free with debt-to-assets near zero; excellent liquidity but potentially limited leverage benefits.
3. Stock Volatility
Eaton Corporation plc (ETN)
- Beta at 1.18 indicates above-market volatility, increasing exposure in turbulent markets.
IDEX Corporation (IEX)
- Beta near 0.98 shows lower volatility, offering more stability to investors in uncertain periods.
4. Regulatory & Legal
Eaton Corporation plc (ETN)
- Global operations expose ETN to diverse regulatory regimes, increasing compliance complexity and risk.
IDEX Corporation (IEX)
- US-centric focus reduces regulatory complexity but increases sensitivity to domestic policy shifts.
5. Supply Chain & Operations
Eaton Corporation plc (ETN)
- Large global supply chain may face disruption risks but benefits from diversified sourcing.
IDEX Corporation (IEX)
- Smaller scale could lead to supply bottlenecks but allows more agile operational adjustments.
6. ESG & Climate Transition
Eaton Corporation plc (ETN)
- Power management focus aligns with energy transition trends but requires continual ESG investment.
IDEX Corporation (IEX)
- Applied solutions in fluid and safety tech offer ESG growth potential with less exposure to energy transition risks.
7. Geopolitical Exposure
Eaton Corporation plc (ETN)
- Headquarters in Ireland and global footprint create exposure to EU and international geopolitical risks.
IDEX Corporation (IEX)
- US headquarters and focus reduce geopolitical complexity but tie fortunes to domestic economic policy.
Which company shows a better risk-adjusted profile?
IDEX’s low debt and stable beta underpin a more conservative risk stance compared to Eaton’s higher leverage and elevated volatility. Eaton’s scale and global diversity offer growth but increase exposure to geopolitical and regulatory risks. IDEX’s stronger liquidity ratios and very strong Piotroski score reinforce its financial resilience. Eaton’s price-to-book ratio and debt-to-equity score raise caution despite solid profitability. The dominant risk for Eaton lies in its valuation and leverage. For IDEX, operational scale and market niche competition remain key concerns. Overall, IEX presents a better risk-adjusted profile supported by its stronger balance sheet and lower volatility in 2026 conditions.
Final Verdict: Which stock to choose?
Eaton Corporation plc (ETN) stands out for its robust capital allocation and steadily growing ROIC well above its cost of capital. This company’s superpower lies in its durable operational efficiency and value creation over recent years. A point of vigilance remains its elevated valuation multiples, which could pressure future returns. ETN suits investors targeting aggressive growth with a tolerance for premium pricing.
IDEX Corporation (IEX) offers a strategic moat rooted in its strong balance sheet and recurring cash flow reliability, boosting its safety profile relative to ETN. Despite a declining ROIC trend signaling caution, IEX benefits from a conservative financial structure and a very strong Piotroski score. This makes it a candidate for portfolios favoring growth at a reasonable price (GARP) and capital preservation.
If you prioritize sustained value creation and operational excellence, Eaton (ETN) is the compelling choice due to its growing profitability and market leadership. However, if you seek better financial stability and a conservative risk profile, IDEX (IEX) offers superior balance sheet strength and cash flow consistency despite recent profitability headwinds. Both present distinct strategic scenarios fitting different investor objectives.
Disclaimer: Investment carries a risk of loss of initial capital. The past performance is not a reliable indicator of future results. Be sure to understand risks before making an investment decision.
Go Further
I encourage you to read the complete analyses of Eaton Corporation plc and IDEX Corporation to enhance your investment decisions: