Home > Comparison > Industrials > ETN vs HWM
The strategic rivalry between Eaton Corporation plc and Howmet Aerospace Inc. shapes the Industrials sector’s competitive landscape. Eaton operates as a diversified power management and electrical components giant, while Howmet Aerospace focuses on engineered aerospace and transportation solutions. This analysis pits Eaton’s broad industrial footprint against Howmet’s specialized aerospace expertise. I will determine which company offers a superior risk-adjusted return for a portfolio seeking balanced exposure in this vital industrial machinery industry.
Table of contents
Companies Overview
Eaton Corporation and Howmet Aerospace stand as pivotal forces in industrial machinery, shaping global markets.
Eaton Corporation plc: Power Management Leader
Eaton Corporation is a power management company delivering electrical components, aerospace systems, and vehicle power solutions. Its revenue stems from diversified segments including electrical distribution, aerospace hydraulic products, and eMobility technology. In 2026, Eaton focuses on expanding its power reliability and hybrid systems to address evolving energy demands and sustainability trends.
Howmet Aerospace Inc.: Advanced Engineered Solutions Specialist
Howmet Aerospace specializes in engineered aerospace and transportation components, producing airfoils, fasteners, and forged wheels. It generates revenue through four segments targeting aerospace engines, fastening systems, and commercial transport markets. In 2026, Howmet emphasizes innovation in lightweight titanium and aluminum forgings to enhance performance and fuel efficiency in aerospace and defense.
Strategic Collision: Similarities & Divergences
Both companies operate within industrial machinery but adopt different philosophies. Eaton pursues a broad power management ecosystem, while Howmet focuses on high precision aerospace and transportation components. Their primary battleground lies in aerospace innovation and materials technology. Eaton offers a diversified, stability-oriented profile; Howmet presents a more specialized, growth-driven investment character.
Income Statement Comparison
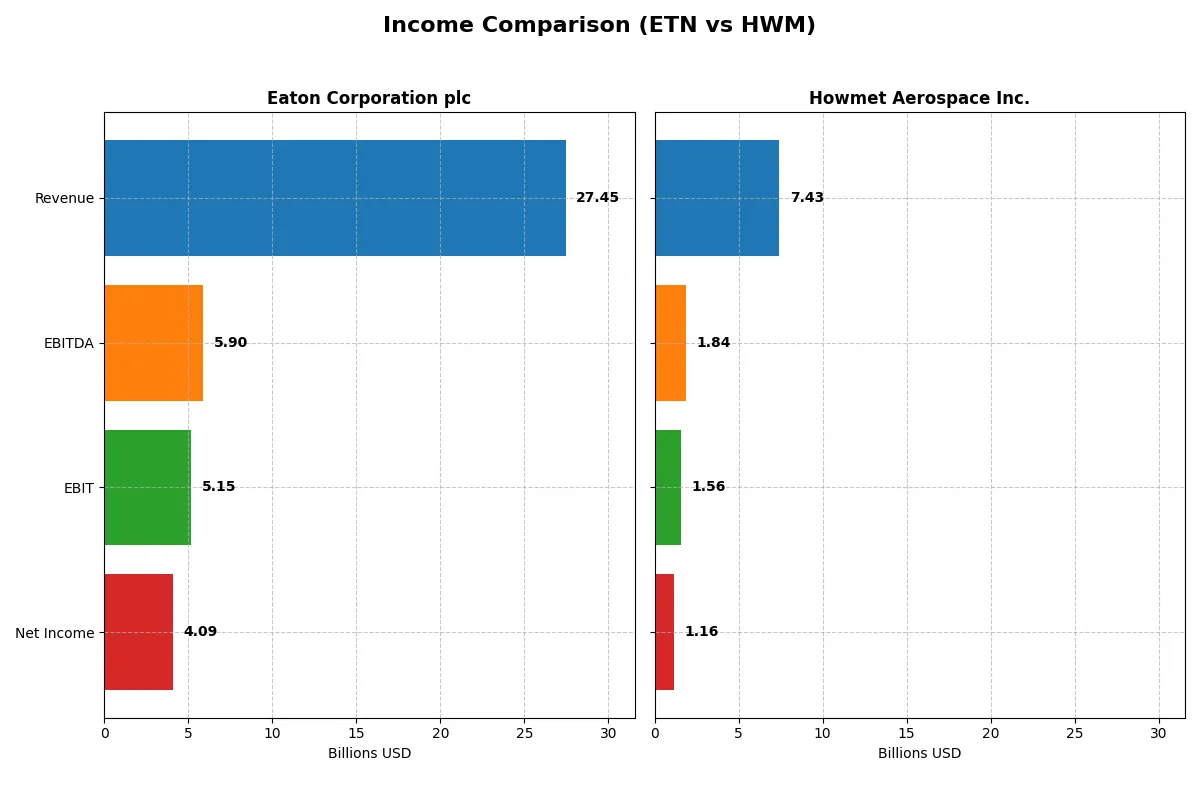
This data dissects the core profitability and scalability of both corporate engines to reveal who dominates the bottom line:
| Metric | Eaton Corporation plc (ETN) | Howmet Aerospace Inc. (HWM) |
|---|---|---|
| Revenue | 27.4B | 7.43B |
| Cost of Revenue | 17.1B | 5.38B |
| Operating Expenses | 5.08B | 380M |
| Gross Profit | 10.3B | 2.05B |
| EBITDA | 5.90B | 1.84B |
| EBIT | 5.15B | 1.57B |
| Interest Expense | 264M | 182M |
| Net Income | 4.09B | 1.16B |
| EPS | 10.49 | 2.83 |
| Fiscal Year | 2025 | 2024 |
Income Statement Analysis: The Bottom-Line Duel
This income statement comparison reveals which company manages its resources more efficiently to drive sustainable profit growth.
Eaton Corporation plc Analysis
Eaton’s revenue climbed steadily from 19.6B in 2021 to 27.4B in 2025, with net income nearly doubling from 2.1B to 4.1B. Gross margin holds strong at 37.6%, supporting a healthy 14.9% net margin. The 2025 results show consistent operational efficiency and robust margin expansion, signaling solid momentum.
Howmet Aerospace Inc. Analysis
Howmet’s revenue grew from 5.0B in 2021 to 7.4B in 2024, with net income surging over fourfold from 258M to 1.15B. Gross margin stands at 27.6%, while net margin impresses at 15.5%. The 2024 figures highlight rapid profitability gains and excellent margin improvement, reflecting agile capital deployment.
Margin Strength vs. Explosive Earnings Growth
Eaton delivers scale with stable, improving margins and nearly 40% revenue growth over five years. Howmet posts superior net margin growth and a spectacular 447% net income increase despite smaller size. Eaton appeals as a steady profit engine; Howmet attracts with aggressive earnings momentum and margin expansion.
Financial Ratios Comparison
These vital ratios act as a diagnostic tool to expose the underlying fiscal health, valuation premiums, and capital efficiency of the companies compared below:
| Ratios | Eaton Corporation plc (ETN) | Howmet Aerospace Inc. (HWM) |
|---|---|---|
| ROE | 21.1% | 25.4% |
| ROIC | 13.1% | 15.5% |
| P/E | 30.2 | 38.6 |
| P/B | 6.37 | 9.80 |
| Current Ratio | 1.32 | 2.17 |
| Quick Ratio | 0.81 | 0.98 |
| D/E (Debt-to-Equity) | 0.54 | 0.76 |
| Debt-to-Assets | 25.5% | 33.0% |
| Interest Coverage | 19.8 | 9.19 |
| Asset Turnover | 0.67 | 0.71 |
| Fixed Asset Turnover | 5.40 | 2.92 |
| Payout Ratio | 39.5% | 9.4% |
| Dividend Yield | 1.31% | 0.24% |
| Fiscal Year | 2025 | 2024 |
Efficiency & Valuation Duel: The Vital Signs
Financial ratios act like a company’s DNA, revealing hidden risks and operational excellence behind headline numbers.
Eaton Corporation plc
Eaton shows strong profitability with a 21.05% ROE and a solid 14.9% net margin, signaling efficient operations. Its P/E at 30.24 and P/B at 6.37 suggest the stock trades at a premium. Eaton balances shareholder returns with a 1.31% dividend yield, reflecting steady income alongside reinvestment in R&D (around 3% of revenue).
Howmet Aerospace Inc.
Howmet delivers higher profitability, posting a 25.36% ROE and a 15.55% net margin, indicating operational strength. However, its valuation is more stretched, with a P/E of 38.63 and P/B of 9.8. Dividend yield is low at 0.24%, implying that most capital is likely reinvested to fuel growth rather than returning cash to shareholders.
Premium Valuation vs. Operational Safety
Howmet commands a higher valuation but also achieves superior profitability metrics, reflecting growth expectations. Eaton offers a more moderate valuation with a reliable dividend and solid efficiency. Investors seeking growth may lean towards Howmet, while those valuing income and steadier risk prefer Eaton’s balanced profile.
Which one offers the Superior Shareholder Reward?
I see Eaton (ETN) pays a steady 1.3% dividend yield with a ~40% payout ratio, balancing income and reinvestment. Eaton’s free cash flow supports this dividend and buybacks, enhancing shareholder value sustainably. Howmet (HWM) yields just 0.24% with under 10% payout, favoring aggressive reinvestment and modest buybacks to fuel growth. Eaton’s distribution model is more balanced and sustainable in 2026. I judge Eaton offers a superior total return profile due to its blend of income, buybacks, and solid cash flow coverage.
Comparative Score Analysis: The Strategic Profile
The radar chart reveals the fundamental DNA and trade-offs of Eaton Corporation plc and Howmet Aerospace Inc.:
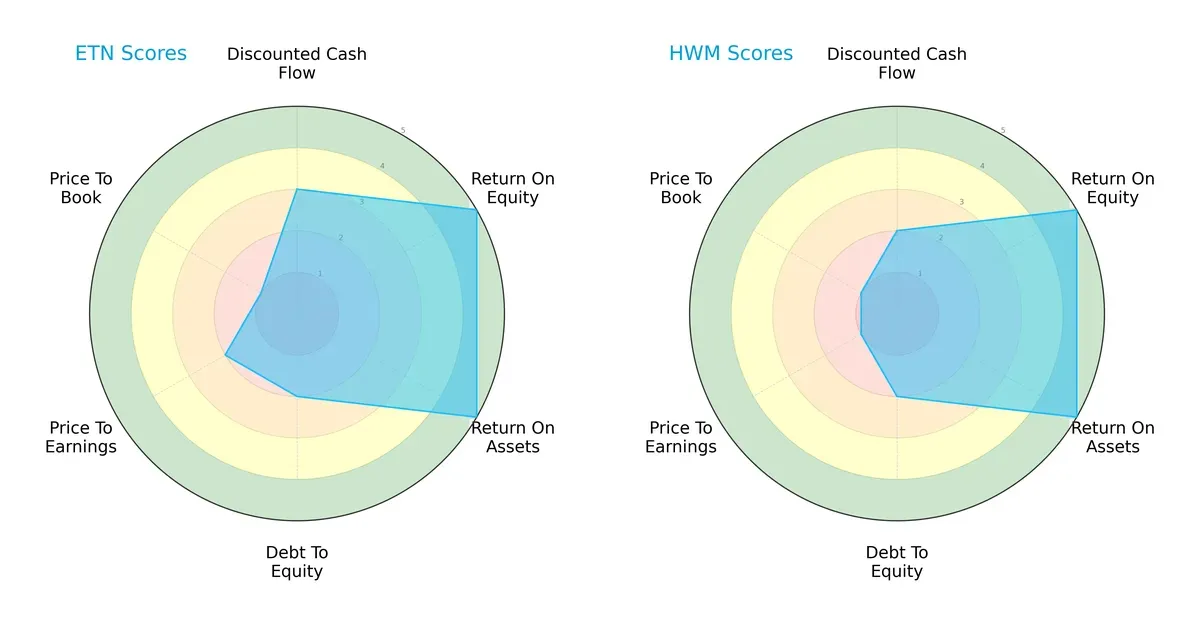
Eaton and Howmet both score well on ROE and ROA, reflecting strong operational efficiency. Eaton holds an edge in discounted cash flow with a moderate score of 3 versus Howmet’s 2, suggesting a more balanced valuation approach. However, both struggle with debt-to-equity (score 2) and valuation metrics, where Eaton slightly outperforms Howmet in P/E (2 vs. 1) and both are weak on P/B (1). Eaton’s profile is more balanced, while Howmet relies heavily on operational strength but shows vulnerability in valuation.
Bankruptcy Risk: Solvency Showdown
The Altman Z-Score comparison highlights Howmet’s superior solvency position (10.3) versus Eaton’s (5.0), both safely distant from distress but with a clear margin:
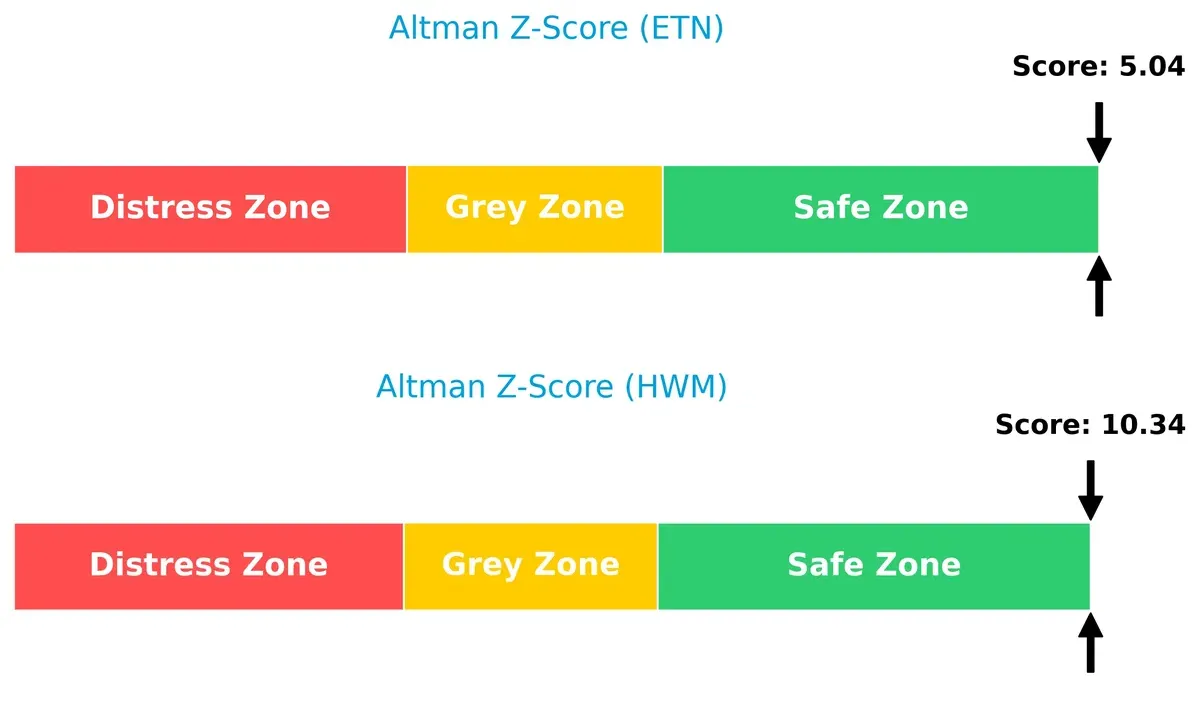
Howmet’s higher Z-Score signals robust financial stability and a stronger buffer against economic downturns. Eaton remains safe but with less cushion, which warrants cautious monitoring given sector cyclicality.
Financial Health: Quality of Operations
The Piotroski F-Score analysis reveals Howmet in peak financial health with a strong 9, while Eaton’s 6 suggests average performance and some internal weaknesses:
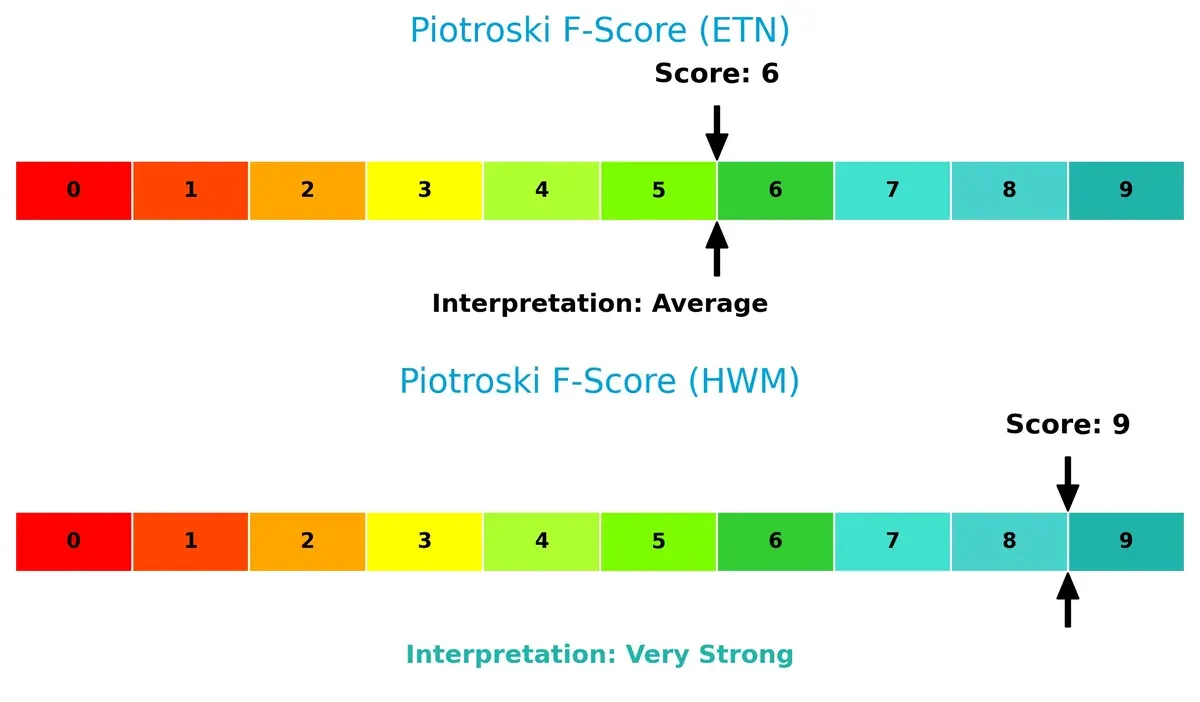
Howmet’s score indicates superior profitability, liquidity, and operational efficiency. Eaton’s lower score implies potential red flags in internal metrics, urging investors to scrutinize its financial quality more closely.
How are the two companies positioned?
This section dissects the operational DNA of Eaton and Howmet by comparing their revenue distribution by segment alongside their internal strengths and weaknesses. The goal is to confront their economic moats and reveal which business model delivers the most resilient, sustainable competitive advantage today.
Revenue Segmentation: The Strategic Mix
This comparison dissects how Eaton Corporation plc and Howmet Aerospace Inc. diversify their income streams and where their primary sector bets lie:
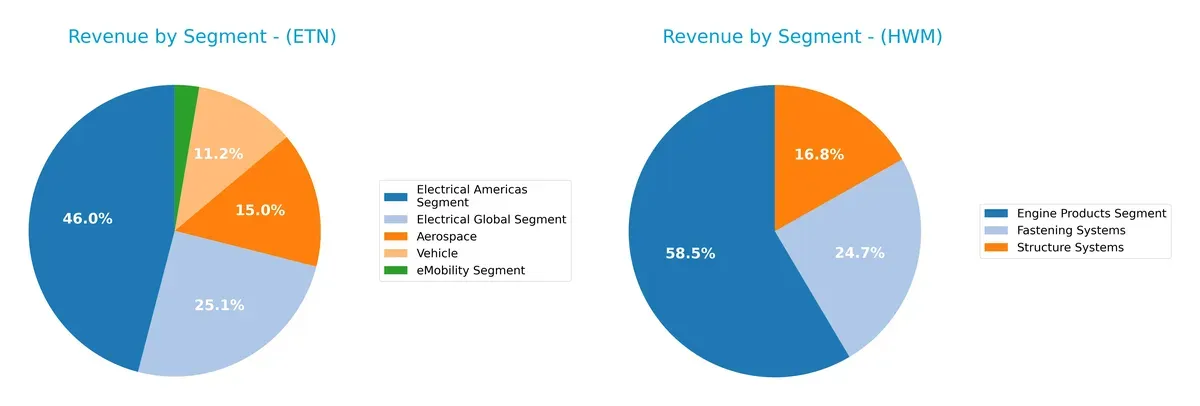
Eaton’s revenue is broadly diversified, with Electrical Americas at $11.4B leading, followed by Electrical Global at $6.2B and Aerospace at $3.7B. In contrast, Howmet depends heavily on Engine Products at $3.7B, with smaller contributions from Fastening Systems ($1.6B) and Structure Systems ($1.1B). Eaton’s mix anchors it in infrastructure and mobility, reducing concentration risk. Howmet pivots on aerospace engine dominance, exposing it to sector cyclicality.
Strengths and Weaknesses Comparison
This table compares the Strengths and Weaknesses of Eaton Corporation plc (ETN) and Howmet Aerospace Inc. (HWM):
ETN Strengths
- Diverse revenue streams across aerospace, electrical, vehicle, and eMobility segments
- Strong profitability with 14.9% net margin and 21.05% ROE
- Favorable debt-to-assets ratio at 25.53%
- High fixed asset turnover at 5.4 indicating efficient asset use
- Solid global presence with significant revenue from U.S., Europe, and Asia Pacific
HWM Strengths
- High profitability with 15.55% net margin and 25.36% ROE
- Favorable interest coverage ratio at 8.6 supports debt servicing
- Strong current ratio at 2.17 signals liquidity
- Focused segments in engine products and fastening systems with steady revenue growth
- Global footprint includes diversified markets like U.S., Europe, and Asia
ETN Weaknesses
- High P/E ratio at 30.24 and P/B at 6.37 reflect possibly overvalued stock
- Neutral liquidity ratios with quick ratio at 0.81
- Moderate asset turnover at 0.67 limits sales efficiency
- Heavy U.S. revenue concentration may reduce geographic diversification
HWM Weaknesses
- Elevated P/E ratio at 38.63 and P/B at 9.8 indicate high valuation risk
- Low dividend yield at 0.24% may deter income-focused investors
- Debt-to-assets ratio at 33% is neutral but higher than ETN
- Moderate fixed asset turnover at 2.92 suggests less asset efficiency
Both companies show strong profitability and global reach but differ in diversification and valuation. ETN’s broader segment mix and efficient asset use contrast with HWM’s liquidity strength and higher profitability metrics. Valuation and geographic concentration remain key challenges for both.
The Moat Duel: Analyzing Competitive Defensibility
A structural moat is the only reliable shield protecting long-term profits from relentless competitive pressures. Here’s how Eaton and Howmet stack up:
Eaton Corporation plc: Diversified Industrial Powerhouse with Cost Advantage
Eaton leverages scale and operational efficiency to maintain cost advantages visible in stable 18.8% EBIT margins. Its expanding eMobility segment could deepen this moat in 2026 but faces rising raw material costs.
Howmet Aerospace Inc.: Precision Engineering with Intangible Asset Moat
Howmet’s moat centers on specialized aerospace engineering and proprietary titanium forging. It commands superior 21.1% EBIT margins and accelerating ROIC growth, positioning it well for aerospace market expansion and green aviation trends.
Verdict: Cost Efficiency vs. Specialized Expertise
Howmet’s focused intangible asset moat appears deeper, driven by superior ROIC and margin expansion. Eaton’s broader cost advantage offers resilience but faces margin pressure. Howmet is better equipped to defend complex aerospace niches amid evolving industry demands.
Which stock offers better returns?
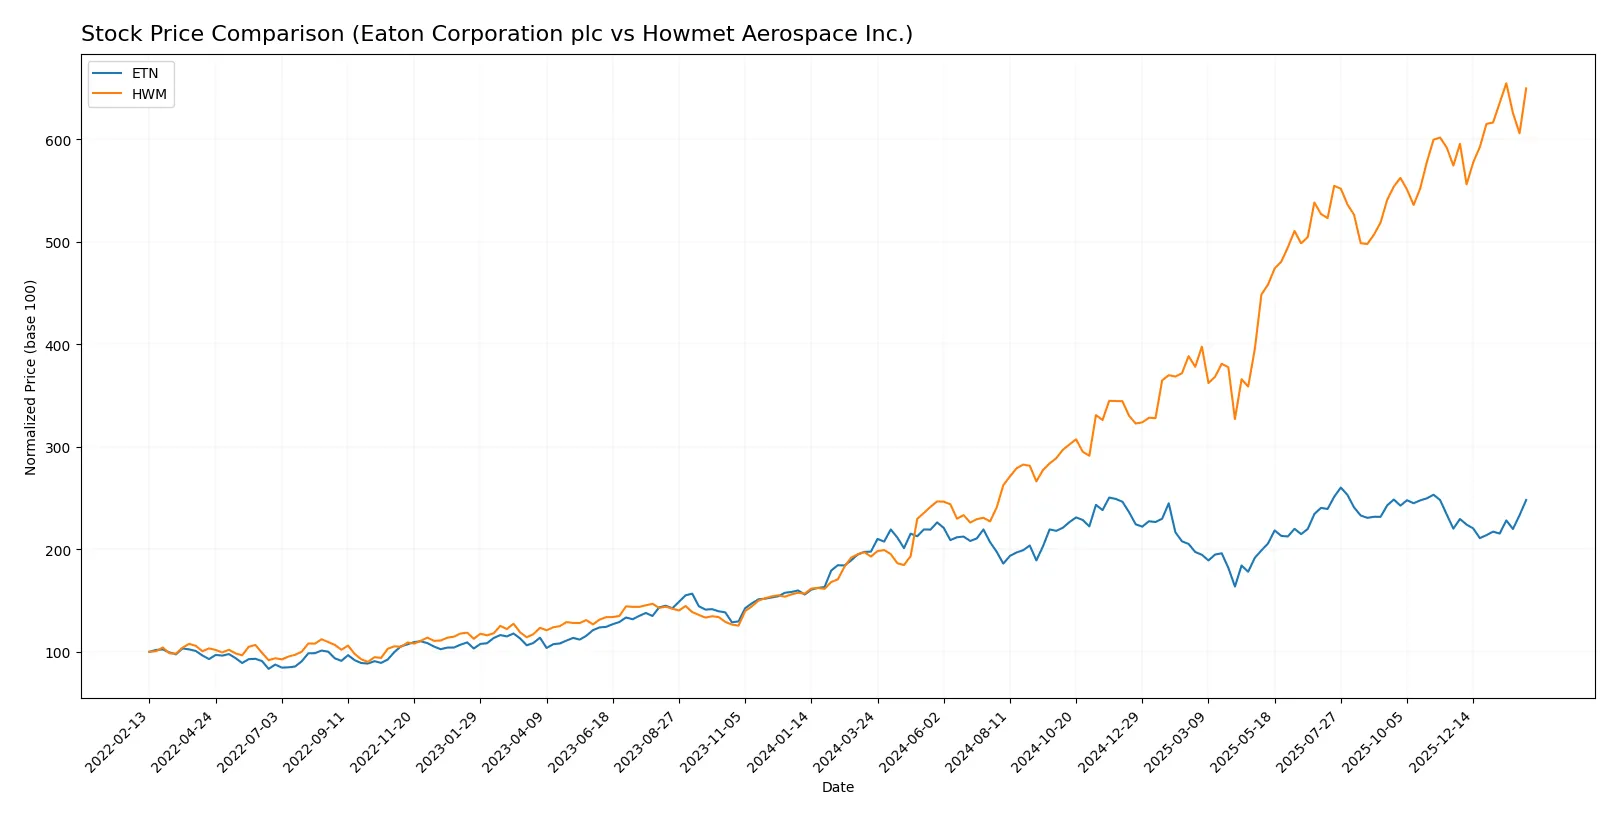
Over the past year, Eaton Corporation plc and Howmet Aerospace Inc. showed strong price gains with accelerating bullish trends, reflecting dynamic trading activity and notable price appreciation.
Trend Comparison
Eaton Corporation plc’s stock rose 25.49% over the past 12 months, showing a bullish trend with accelerating momentum and a high price range between 246.52 and 392.17.
Howmet Aerospace Inc. surged 236.9% over the same period, also accelerating bullishly, with a wider price range from 63.41 to 224.89 and higher volatility than Eaton.
Howmet Aerospace clearly outperformed Eaton in market returns, delivering substantially stronger price appreciation and sustained bullish momentum over the past year.
Target Prices
Analysts present a moderately bullish consensus on Eaton Corporation plc and Howmet Aerospace Inc. for 2026.
| Company | Target Low | Target High | Consensus |
|---|---|---|---|
| Eaton Corporation plc | 295 | 495 | 393.64 |
| Howmet Aerospace Inc. | 209 | 258 | 238.43 |
The consensus target prices for both companies exceed current market prices, signaling analyst expectations for moderate upside potential. Eaton’s target consensus is about 5% above its current price of 374, while Howmet’s consensus stands roughly 7% higher than its current 223.

Don’t Let Luck Decide Your Entry Point
Optimize your entry points with our advanced ProRealTime indicators. You’ll get efficient buy signals with precise price targets for maximum performance. Start outperforming now!
How do institutions grade them?
The following tables summarize recent ratings from reputable grading companies for Eaton Corporation plc and Howmet Aerospace Inc.:
Eaton Corporation plc Grades
This table presents the latest institutional grades for Eaton Corporation plc:
| Grading Company | Action | New Grade | Date |
|---|---|---|---|
| Wells Fargo | maintain | Equal Weight | 2026-02-04 |
| JP Morgan | maintain | Overweight | 2026-01-16 |
| HSBC | upgrade | Buy | 2026-01-16 |
| Morgan Stanley | maintain | Overweight | 2026-01-12 |
| Citigroup | maintain | Buy | 2026-01-12 |
| Barclays | maintain | Equal Weight | 2026-01-07 |
| UBS | downgrade | Neutral | 2026-01-05 |
| Wells Fargo | maintain | Equal Weight | 2025-12-18 |
| Wolfe Research | upgrade | Outperform | 2025-12-09 |
| JP Morgan | maintain | Overweight | 2025-11-06 |
Howmet Aerospace Inc. Grades
This table presents the latest institutional grades for Howmet Aerospace Inc.:
| Grading Company | Action | New Grade | Date |
|---|---|---|---|
| Citigroup | maintain | Buy | 2026-01-13 |
| B of A Securities | maintain | Buy | 2025-11-14 |
| JP Morgan | maintain | Overweight | 2025-11-10 |
| Goldman Sachs | maintain | Buy | 2025-11-03 |
| BTIG | maintain | Buy | 2025-11-03 |
| UBS | maintain | Neutral | 2025-10-31 |
| TD Cowen | maintain | Buy | 2025-10-31 |
| RBC Capital | maintain | Outperform | 2025-10-31 |
| Truist Securities | maintain | Buy | 2025-10-15 |
| Susquehanna | maintain | Positive | 2025-10-09 |
Which company has the best grades?
Howmet Aerospace Inc. consistently receives “Buy” and “Outperform” ratings, reflecting stronger institutional confidence. Eaton Corporation plc shows a mix from “Neutral” to “Outperform,” suggesting more varied views. Investors may interpret Howmet’s steadier positive ratings as a sign of higher conviction among analysts.
Risks specific to each company
The following categories identify the critical pressure points and systemic threats facing both firms in the 2026 market environment:
1. Market & Competition
Eaton Corporation plc
- Faces intense competition in power management and eMobility segments; market cycles pressure margin expansion.
Howmet Aerospace Inc.
- Competes in aerospace and transportation sectors with reliance on advanced engineered solutions; cyclical aerospace demand impacts growth.
2. Capital Structure & Debt
Eaton Corporation plc
- Moderate debt-to-assets at 25.5%, interest coverage strong at 19.5x; balance sheet stable but with some leverage risk.
Howmet Aerospace Inc.
- Higher debt-to-assets at 33%, interest coverage lower at 8.6x; balance sheet carries more financial risk amid cyclical aerospace exposure.
3. Stock Volatility
Eaton Corporation plc
- Beta of 1.18 indicates moderate volatility relative to market; price range stable with recent positive momentum.
Howmet Aerospace Inc.
- Beta of 1.25 signals higher volatility; wider price range with increased trading volume suggests greater market sensitivity.
4. Regulatory & Legal
Eaton Corporation plc
- Operates globally with exposure to electrical and vehicle regulations; compliance costs may rise with evolving standards.
Howmet Aerospace Inc.
- Aerospace focus exposes firm to strict safety and export controls; regulatory changes could increase compliance costs significantly.
5. Supply Chain & Operations
Eaton Corporation plc
- Diverse global supply chain supports multiple segments but vulnerable to raw material cost inflation and logistics disruptions.
Howmet Aerospace Inc.
- Supply chain complexity in aerospace materials and forgings poses risks; disruptions could affect production schedules and margins.
6. ESG & Climate Transition
Eaton Corporation plc
- Power management and eMobility segments align well with climate transition trends; ESG initiatives support long-term growth.
Howmet Aerospace Inc.
- Aerospace and transportation sectors face pressure to reduce emissions; ESG compliance may require costly technological shifts.
7. Geopolitical Exposure
Eaton Corporation plc
- Based in Ireland with global operations; geopolitical tensions in trade and energy markets could affect supply chains.
Howmet Aerospace Inc.
- Headquartered in the US with extensive international footprint; sensitive to geopolitical risks impacting aerospace defense contracts.
Which company shows a better risk-adjusted profile?
Eaton faces its largest risk in competitive pressures within diversified industrial markets, balanced by strong interest coverage and ESG alignment. Howmet’s most significant threat lies in higher leverage and greater regulatory burdens in aerospace. Eaton’s moderate leverage and safer financial zone give it a better risk-adjusted profile despite similar valuation concerns. Notably, Howmet’s superior Altman Z-score and very strong Piotroski score indicate financial strength but are offset by higher debt and volatility risks that caution investors.
Final Verdict: Which stock to choose?
Eaton Corporation’s superpower lies in its consistent value creation, demonstrated by a growing ROIC well above its cost of capital. Its operational efficiency and solid profitability stand out. The point of vigilance is its elevated valuation multiples, which might temper upside. Eaton suits portfolios seeking steady, long-term industrial growth.
Howmet Aerospace commands a strategic moat through strong return on equity and rapid earnings growth, fueled by aerospace sector tailwinds. It offers a higher safety cushion in liquidity and a robust financial health profile relative to Eaton. Howmet fits well in a growth-at-a-reasonable-price (GARP) portfolio aiming for dynamic expansion.
If you prioritize stable value creation with proven capital efficiency, Eaton outshines due to its sustainable competitive advantage and operational discipline. However, if you seek aggressive growth backed by accelerating earnings and a resilient balance sheet, Howmet offers better growth potential and financial strength. Both present compelling but distinct analytical scenarios for investors aligned with their risk tolerance and strategy.
Disclaimer: Investment carries a risk of loss of initial capital. The past performance is not a reliable indicator of future results. Be sure to understand risks before making an investment decision.
Go Further
I encourage you to read the complete analyses of Eaton Corporation plc and Howmet Aerospace Inc. to enhance your investment decisions: