Home > Comparison > Industrials > ETN vs GNRC
The strategic rivalry between Eaton Corporation plc and Generac Holdings Inc. shapes the industrial machinery landscape. Eaton, a diversified global power management leader, contrasts sharply with Generac’s focused power generation and energy storage niche. This head-to-head pits a capital-intensive multinational giant against a high-growth specialist. This analysis aims to identify which company’s trajectory offers superior risk-adjusted returns for a diversified portfolio in today’s evolving industrial sector.
Table of contents
Companies Overview
Eaton Corporation plc and Generac Holdings Inc. anchor critical sectors within industrial machinery and power solutions.
Eaton Corporation plc: Global Power Management Leader
Eaton Corporation plc dominates as a power management company worldwide. Its core revenue derives from electrical components, aerospace systems, and vehicle powertrains. In 2026, the strategic focus sharpens on eMobility and advanced power distribution, targeting growth in hybrid and electric vehicle systems alongside industrial power reliability.
Generac Holdings Inc.: Residential and Commercial Power Innovator
Generac Holdings Inc. leads in power generation equipment for residential, commercial, and industrial clients. It earns revenue through generators, energy storage, and clean energy solutions. The latest strategic priority is expanding its footprint in clean energy and remote monitoring technologies, supporting residential standby systems and portable power markets.
Strategic Collision: Similarities & Divergences
Eaton pursues a diversified, global industrial approach, while Generac focuses on specialized power generation for localized markets. They compete primarily in power reliability and backup solutions, but Eaton’s broad portfolio contrasts with Generac’s niche innovation. Their investment profiles differ sharply: Eaton offers stability through scale; Generac offers growth potential through focused market disruption.
Income Statement Comparison
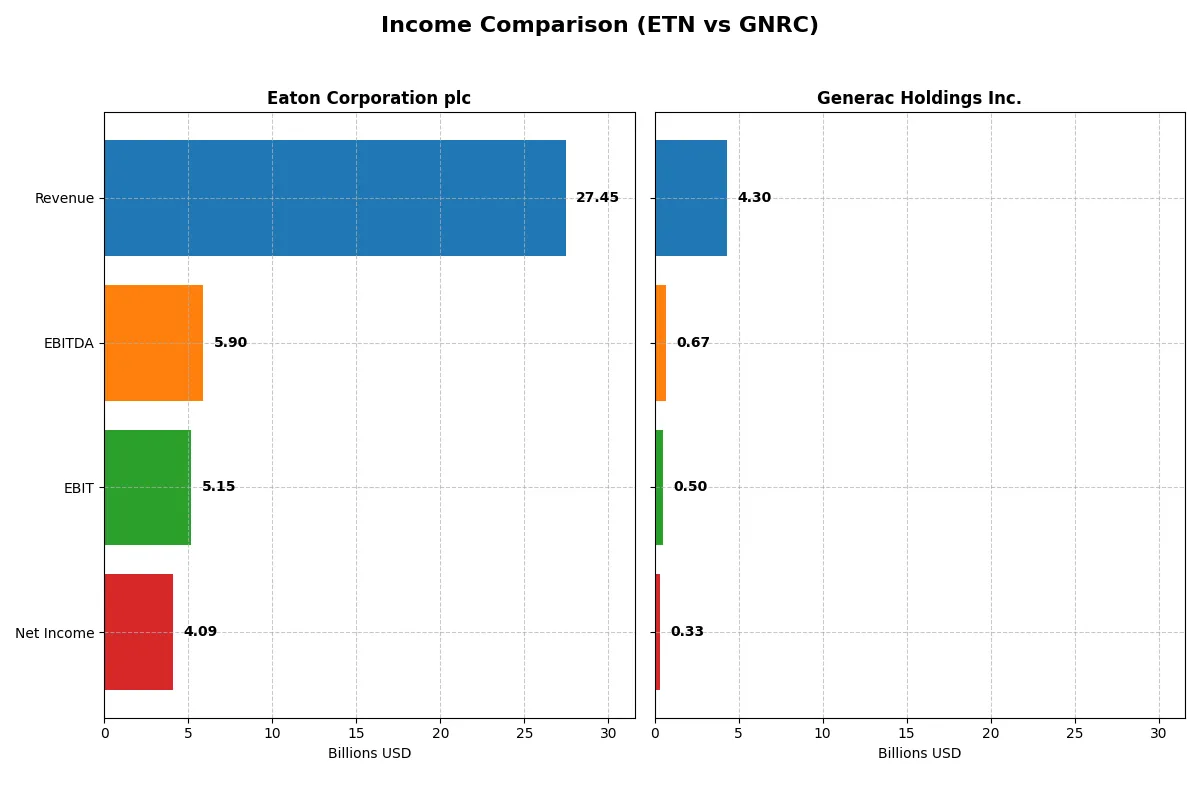
The following data dissects the core profitability and scalability of both corporate engines to reveal who dominates the bottom line:
| Metric | Eaton Corporation plc (ETN) | Generac Holdings Inc. (GNRC) |
|---|---|---|
| Revenue | 27.4B | 4.3B |
| Cost of Revenue | 17.1B | 2.6B |
| Operating Expenses | 5.1B | 1.1B |
| Gross Profit | 10.3B | 1.7B |
| EBITDA | 5.9B | 671M |
| EBIT | 5.1B | 499M |
| Interest Expense | 264M | 90M |
| Net Income | 4.1B | 325M |
| EPS | 10.49 | 5.46 |
| Fiscal Year | 2025 | 2024 |
Income Statement Analysis: The Bottom-Line Duel
This income statement comparison reveals which company runs its business with superior efficiency and profit generation in their respective markets.
Eaton Corporation plc Analysis
Eaton’s revenue climbed steadily from 19.6B in 2021 to 27.4B in 2025, with net income rising sharply from 2.14B to 4.09B. The company sustains robust gross margins near 37.6% and healthy net margins around 14.9%. In 2025, Eaton demonstrated strong momentum, growing revenue 10.3% and net income by nearly 8.0%, highlighting operational efficiency and disciplined cost control.
Generac Holdings Inc. Analysis
Generac’s revenue grew from 2.5B in 2020 to 4.3B in 2024, though net income dipped from 349M to 325M over the period. Gross margins remain solid at 38.8%, but net margins lag at 7.6%. Recent year growth is mixed: revenue rose 6.8%, but operating expenses grew at the same pace, limiting margin expansion. The sharp 64.8% EPS growth in 2024 signals improving profitability momentum despite margin pressures.
Margin Strength vs. Growth Trajectory
Eaton outperforms Generac with a superior net margin (14.9% vs. 7.6%) and more consistent earnings growth, nearly doubling net income over five years. Generac’s higher gross margin does not translate into bottom-line strength due to elevated operating costs. Eaton’s profile suits investors prioritizing stable profitability, while Generac appeals to those focused on rapid top-line expansion and improving earnings momentum.
Financial Ratios Comparison
These vital ratios act as a diagnostic tool to expose the underlying fiscal health, valuation premiums, and capital efficiency of the companies analyzed:
| Ratios | Eaton Corporation plc (ETN) | Generac Holdings Inc. (GNRC) |
|---|---|---|
| ROE | 21.1% | 13.0% |
| ROIC | 13.1% | 9.9% |
| P/E | 30.2 | 28.4 |
| P/B | 6.37 | 3.70 |
| Current Ratio | 1.32 | 1.97 |
| Quick Ratio | 0.81 | 0.97 |
| D/E | 0.54 | 0.59 |
| Debt-to-Assets | 25.5% | 28.9% |
| Interest Coverage | 19.8 | 6.0 |
| Asset Turnover | 0.67 | 0.84 |
| Fixed Asset Turnover | 5.40 | 5.01 |
| Payout Ratio | 39.5% | 0.08% |
| Dividend Yield | 1.31% | 0.003% |
| Fiscal Year | 2025 | 2024 |
Efficiency & Valuation Duel: The Vital Signs
Ratios act as a company’s DNA, exposing hidden risks and operational strengths essential for thorough investment analysis.
Eaton Corporation plc
Eaton delivers strong profitability with a 21.05% ROE and a solid 14.9% net margin, signaling operational efficiency. Its valuation appears stretched, reflected by a 30.24 P/E and 6.37 P/B, above sector norms. Eaton supports shareholders with a 1.31% dividend yield, balancing returns with ongoing R&D investment near 3% of revenue.
Generac Holdings Inc.
Generac shows moderate profitability, posting a 13.04% ROE and 7.57% net margin, indicating average operational effectiveness. Valuation is high but slightly more attractive than Eaton, with a 28.39 P/E and 3.7 P/B. The company pays no dividend, instead channeling cash into growth and innovation, spending over 5% of revenue on R&D.
Premium Valuation vs. Balanced Growth
Eaton’s superior profitability and shareholder dividend offer a robust risk-reward profile despite its stretched valuation. Generac trades cheaper but with lower margins and no income return. Investors seeking income and operational strength may prefer Eaton; those prioritizing growth reinvestment might find Generac a fitting choice.
Which one offers the Superior Shareholder Reward?
I compare Eaton Corporation plc (ETN) and Generac Holdings Inc. (GNRC) on their shareholder return strategies. ETN yields 1.3% with a steady 39% payout ratio and consistently allocates free cash flow to dividends and buybacks. GNRC pays a negligible dividend, focusing on aggressive reinvestment and share buybacks, supporting high free cash flow conversion (~81%). ETN’s balanced model ensures dividend sustainability amid moderate leverage (D/E ~0.54). GNRC’s growth-oriented reinvestment suits risk-tolerant investors but lacks immediate income. Considering 2026’s market environment favoring income and stability, I find ETN’s total return profile superior for long-term shareholders.
Comparative Score Analysis: The Strategic Profile
The radar chart reveals the fundamental DNA and trade-offs of Eaton Corporation plc and Generac Holdings Inc., highlighting their financial strengths and vulnerabilities:
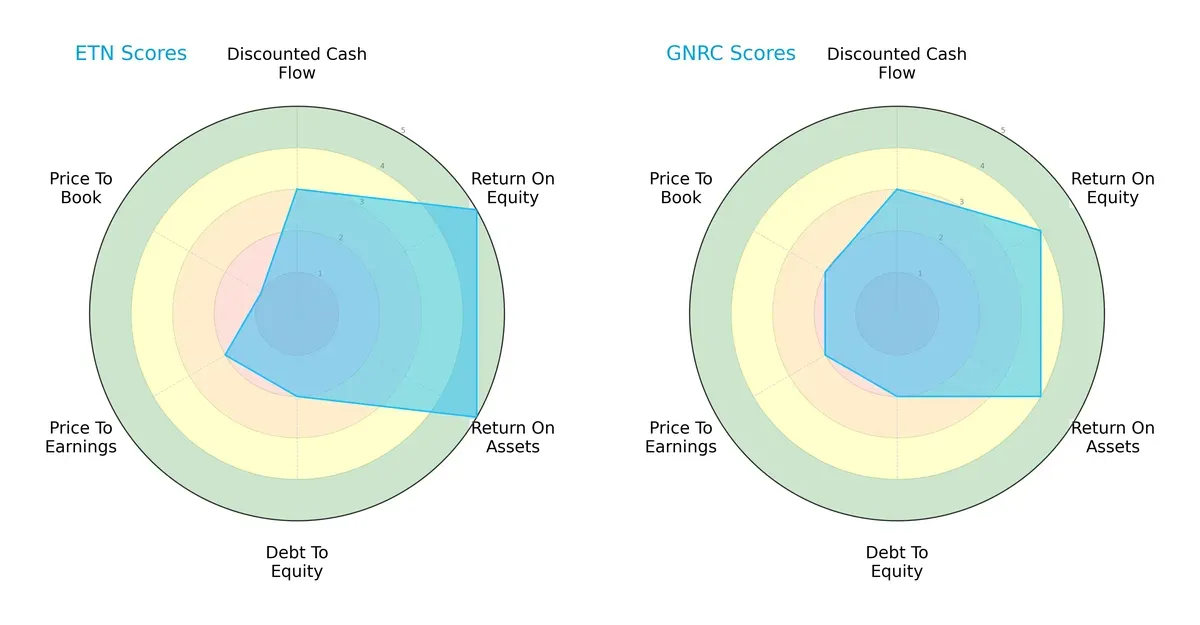
Eaton exhibits superior operational efficiency, with top scores in ROE (5) and ROA (5), signaling strong asset and equity utilization. Generac maintains a balanced profile but slightly lags in profitability metrics (ROE 4, ROA 4). Both share moderate DCF scores (3) and equally unfavorable debt-to-equity scores (2), reflecting leverage risks. Valuation metrics show Eaton’s price-to-book is notably weak (1), while Generac fares marginally better (2). Overall, Eaton relies on operational excellence, whereas Generac presents a more balanced but less potent financial stance.
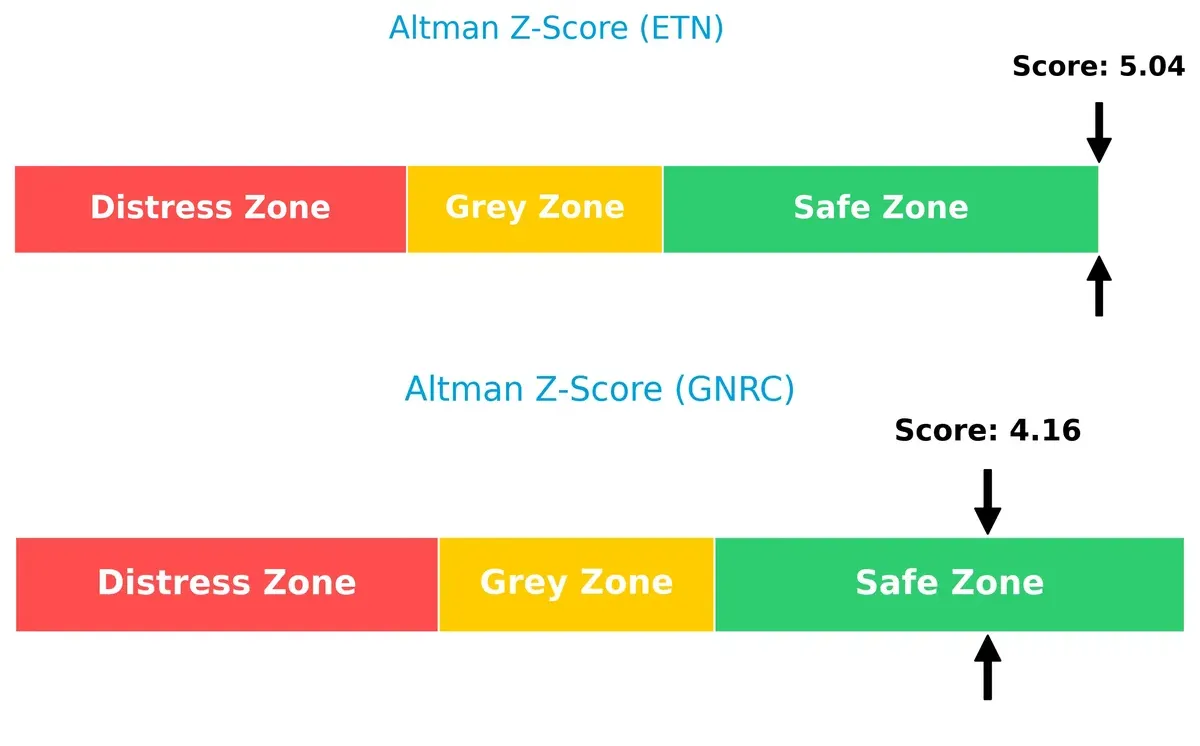
Bankruptcy Risk: Solvency Showdown
Eaton’s Altman Z-Score of 5.04 surpasses Generac’s 4.16, positioning both comfortably in the safe zone for bankruptcy risk. This gap underscores Eaton’s stronger cushion against financial distress in this cycle:
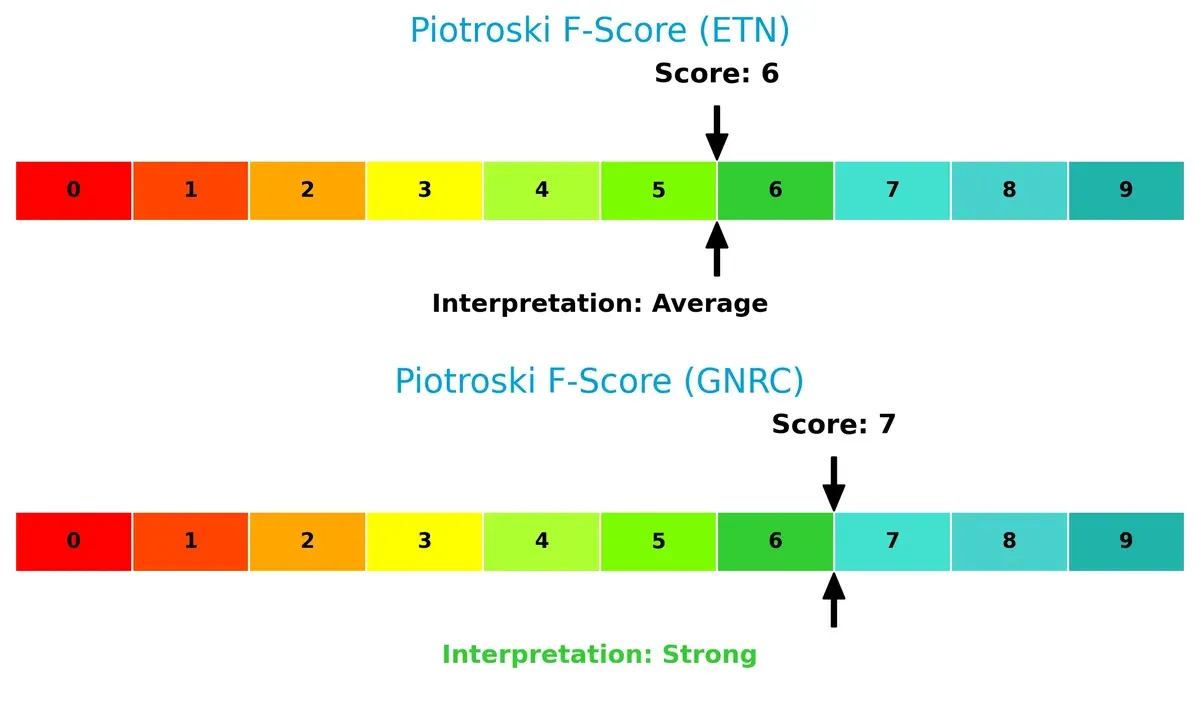
Financial Health: Quality of Operations
Generac edges Eaton with a Piotroski F-Score of 7 versus 6, signaling slightly stronger financial health and operational quality. Eaton’s average score suggests mild caution, while Generac’s rating points to robust internal metrics and fewer red flags:
How are the two companies positioned?
This section dissects the operational DNA of Eaton and Generac by comparing their revenue distribution and internal dynamics of strengths and weaknesses. The goal is to confront their economic moats and identify which business model offers the most resilient competitive advantage today.
Revenue Segmentation: The Strategic Mix
This visual comparison dissects how Eaton Corporation plc and Generac Holdings Inc. diversify their income streams and where their primary sector bets lie:
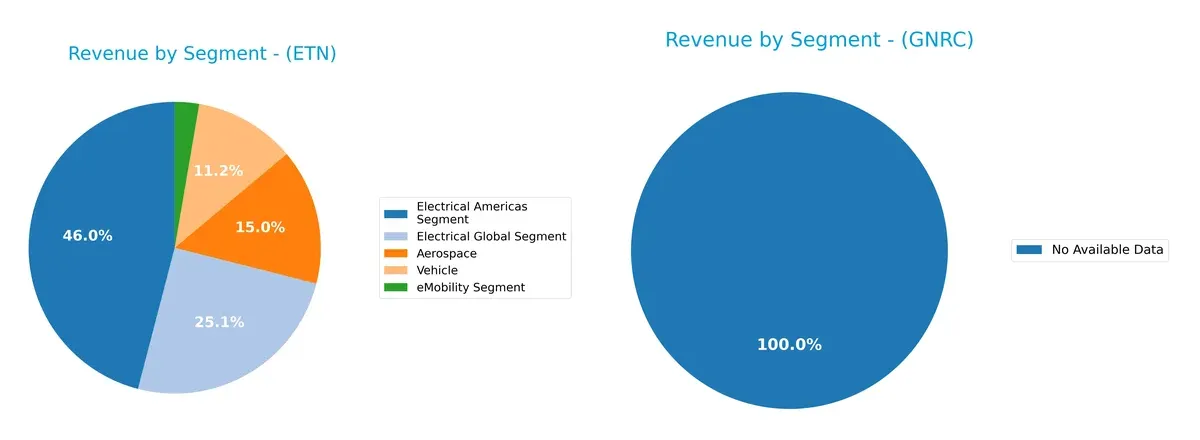
Eaton’s revenue spans multiple segments, with Electrical Americas leading at $11.4B, followed by Electrical Global at $6.2B and Aerospace at $3.7B in 2024. This diversified mix anchors Eaton’s resilience across infrastructure and aerospace sectors. Generac lacks available data, so assessing its revenue concentration or strategic focus is impossible. Eaton’s broad footprint reduces concentration risk and highlights its ecosystem lock-in in electrical infrastructure.
Strengths and Weaknesses Comparison
This table compares the Strengths and Weaknesses of Eaton Corporation plc and Generac Holdings Inc.:
Eaton Strengths
- Diversified revenue streams across Aerospace, Electrical Americas, Global, Vehicle, and eMobility segments
- Strong profitability with 14.9% net margin and 21.05% ROE
- Favorable debt-to-assets at 25.53% and high interest coverage of 19.5x
- Global presence with significant revenues in the US, Europe, Asia Pacific, and Latin America
- Efficient asset use with fixed asset turnover at 5.4x
Generac Strengths
- Favorable current ratio of 1.97 indicating solid short-term liquidity
- Favorable debt-to-assets at 28.88% supports manageable leverage
- Interest coverage of 5.56x shows ability to meet debt costs
- Reasonable fixed asset turnover at 5.01x
- Neutral profitability metrics but maintains operational efficiency
Eaton Weaknesses
- Elevated valuation multiples with P/E of 30.24 and P/B of 6.37
- Neutral liquidity ratios quick ratio 0.81 and current ratio 1.32 suggest moderate short-term risk
- WACC close to 8.88%, limiting ROIC spread advantage
- Limited dividend yield of 1.31% may deter income-focused investors
Generac Weaknesses
- Lower profitability with net margin at 7.57%, ROE at 13.04%, and ROIC at 9.89%
- Unfavorable WACC at 11.41% erodes capital efficiency
- Unfavorable valuation multiples P/E 28.39 and P/B 3.7
- No dividend yield reduces shareholder income
- Interest coverage lower at 5.56x signals tighter debt service capacity
Eaton exhibits robust profitability and global diversification, but high valuation multiples and moderate liquidity ratios pose risks. Generac shows solid liquidity and manageable leverage but faces challenges with profitability, capital costs, and valuation metrics. Each company’s financial profile suggests different strategic priorities regarding growth, risk management, and capital allocation.
The Moat Duel: Analyzing Competitive Defensibility
A structural moat protects long-term profits from relentless competitive erosion. Without it, advantages quickly dissolve under market pressure:
Eaton Corporation plc: Diversified Industrial Powerhouse with Durable Cost Advantage
Eaton’s moat stems from a broad product portfolio and scale-driven cost advantages. Its 4.3% ROIC premium over WACC signals efficient capital use and margin stability. Expanding eMobility and aerospace segments could deepen its moat in 2026.
Generac Holdings Inc.: Niche Leader Facing Margin Pressure
Generac depends on brand recognition and product innovation in home and light commercial power solutions. Unlike Eaton, its ROIC lags WACC by 1.5%, reflecting shrinking profitability and rising costs. Growth in clean energy products offers potential but uncertain moat sustainability.
Eaton’s Scale vs. Generac’s Innovation: Who Defends Better?
Eaton holds a wider and deeper moat, demonstrated by its growing ROIC and value creation. Generac’s declining returns expose vulnerability despite product innovation. Eaton is better positioned to defend and expand its market share in 2026.
Which stock offers better returns?
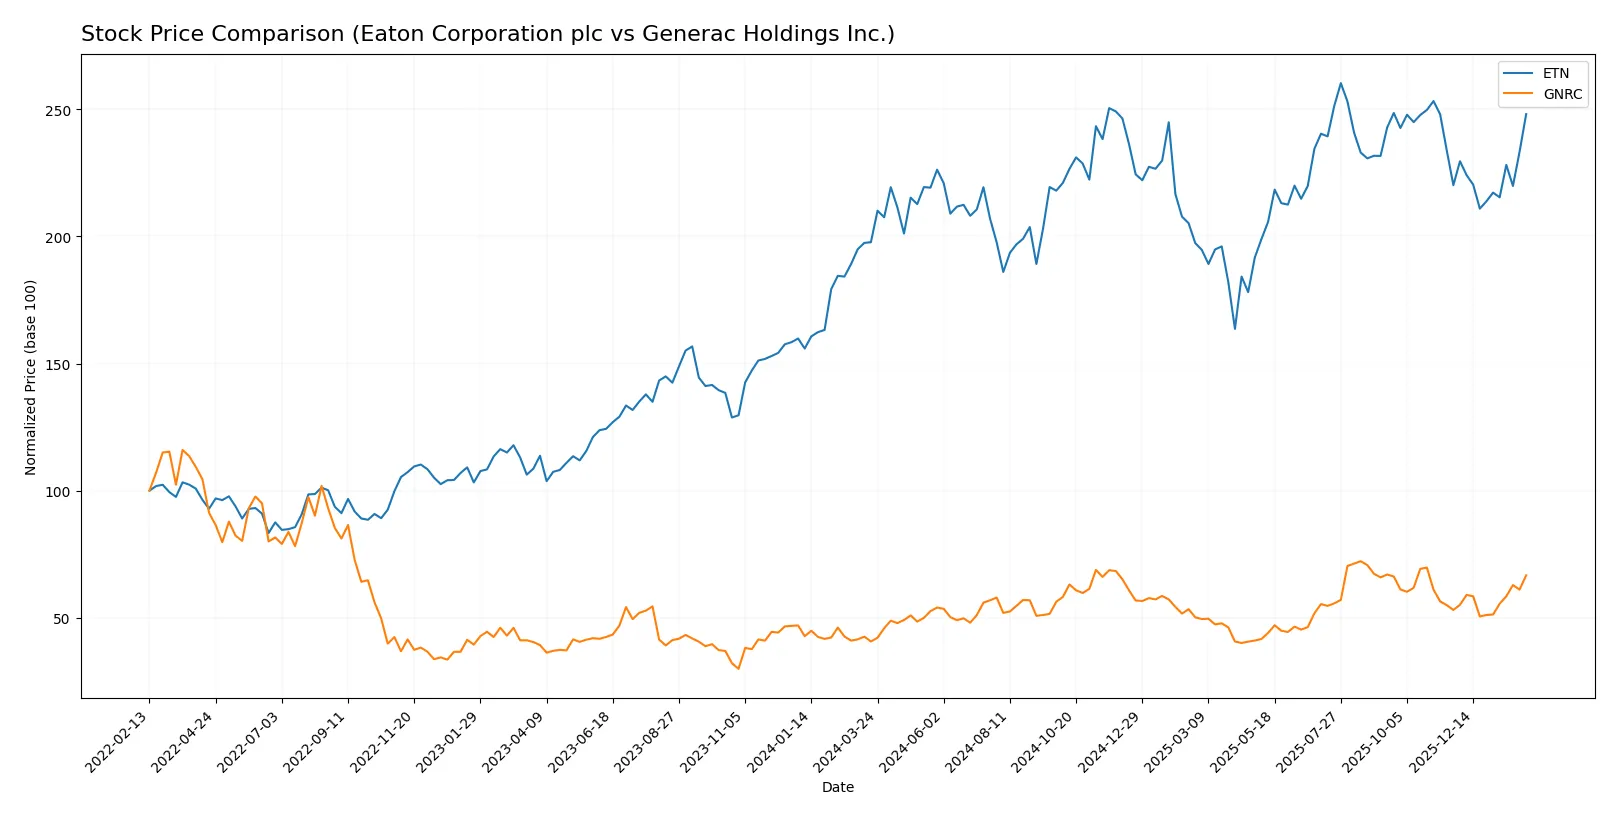
The past year reveals strong upward momentum in both Eaton Corporation plc and Generac Holdings Inc., with marked price gains and distinct trading volume patterns shaping their trajectories.
Trend Comparison
Eaton Corporation plc shows a 25.49% price increase over the past 12 months, marking a bullish trend with accelerating gains. The price ranged from 246.52 to 392.17, and recent months continued upward with a 12.69% gain.
Generac Holdings Inc. outperformed with a 64.04% rise in the same period, also bullish and accelerating. Its price fluctuated between 110.25 and 198.8. Recent gains accelerated further, reaching 25.67% over the last quarter.
Generac Holdings Inc. delivered the highest market performance, outpacing Eaton by nearly 39 percentage points and maintaining stronger recent momentum.
Target Prices
Analysts present a balanced target price consensus for Eaton Corporation plc and Generac Holdings Inc.
| Company | Target Low | Target High | Consensus |
|---|---|---|---|
| Eaton Corporation plc | 295 | 495 | 394 |
| Generac Holdings Inc. | 184 | 248 | 208 |
Eaton’s consensus target price stands roughly 5% above its current price of $374, signaling moderate upside potential. Generac’s target consensus at $208 exceeds its current $184 price by about 13%, indicating stronger analyst optimism.

Don’t Let Luck Decide Your Entry Point
Optimize your entry points with our advanced ProRealTime indicators. You’ll get efficient buy signals with precise price targets for maximum performance. Start outperforming now!
How do institutions grade them?
The following tables summarize recent institutional grades for Eaton Corporation plc and Generac Holdings Inc.:
Eaton Corporation plc Grades
Below are the latest grades assigned by reputable financial institutions:
| Grading Company | Action | New Grade | Date |
|---|---|---|---|
| Wells Fargo | Maintain | Equal Weight | 2026-02-04 |
| JP Morgan | Maintain | Overweight | 2026-01-16 |
| HSBC | Upgrade | Buy | 2026-01-16 |
| Morgan Stanley | Maintain | Overweight | 2026-01-12 |
| Citigroup | Maintain | Buy | 2026-01-12 |
| Barclays | Maintain | Equal Weight | 2026-01-07 |
| UBS | Downgrade | Neutral | 2026-01-05 |
| Wells Fargo | Maintain | Equal Weight | 2025-12-18 |
| Wolfe Research | Upgrade | Outperform | 2025-12-09 |
| JP Morgan | Maintain | Overweight | 2025-11-06 |
Generac Holdings Inc. Grades
The table below shows recent grades from established financial firms:
| Grading Company | Action | New Grade | Date |
|---|---|---|---|
| Barclays | Maintain | Equal Weight | 2026-01-20 |
| Canaccord Genuity | Maintain | Buy | 2026-01-13 |
| Baird | Upgrade | Outperform | 2026-01-09 |
| Citigroup | Upgrade | Buy | 2026-01-08 |
| B of A Securities | Maintain | Buy | 2026-01-07 |
| Wells Fargo | Upgrade | Overweight | 2025-12-19 |
| JP Morgan | Upgrade | Overweight | 2025-12-08 |
| Citigroup | Maintain | Neutral | 2025-11-03 |
| Barclays | Maintain | Equal Weight | 2025-10-31 |
| UBS | Maintain | Buy | 2025-10-30 |
Which company has the best grades?
Generac Holdings Inc. has received more upgrades and consistently higher ratings such as Buy and Outperform. Eaton Corporation shows mixed ratings with several Equal Weight and Overweight grades. These differences could influence investor confidence and portfolio allocation decisions.
Risks specific to each company
The following categories identify critical pressure points and systemic threats facing Eaton Corporation plc and Generac Holdings Inc. in the 2026 market environment:
1. Market & Competition
Eaton Corporation plc
- Large industrial machinery player with broad product lines faces intense competition from diversified global firms.
Generac Holdings Inc.
- Focused on power generation equipment; faces strong competition from both legacy and emerging renewable energy firms.
2. Capital Structure & Debt
Eaton Corporation plc
- Moderate leverage with debt-to-assets at 25.53%; interest coverage very strong at 19.5x.
Generac Holdings Inc.
- Slightly higher leverage at 28.88% debt-to-assets; interest coverage weaker at 5.56x, increasing refinancing risk.
3. Stock Volatility
Eaton Corporation plc
- Beta of 1.18 indicates moderate volatility, more stable than tech-heavy indices.
Generac Holdings Inc.
- Higher beta at 1.81 suggests elevated stock price swings and market sensitivity.
4. Regulatory & Legal
Eaton Corporation plc
- Global operations expose it to varied regulatory regimes, especially in power management and aerospace sectors.
Generac Holdings Inc.
- Primarily US market focus reduces complexity, but evolving energy regulations could impact product demand.
5. Supply Chain & Operations
Eaton Corporation plc
- Complex global supply chain in electrical and vehicle segments vulnerable to geopolitical disruptions.
Generac Holdings Inc.
- Supply chain risks concentrated in manufacturing power generation and energy storage components.
6. ESG & Climate Transition
Eaton Corporation plc
- Strong focus on power management efficiency supports climate transition; pressure to meet expanding ESG mandates.
Generac Holdings Inc.
- Increasing demand for clean energy solutions aligns with climate goals, but transition risk remains as legacy products persist.
7. Geopolitical Exposure
Eaton Corporation plc
- Irish headquarters and global footprint increase exposure to EU regulatory and geopolitical tensions.
Generac Holdings Inc.
- US-based with less direct exposure, but vulnerable to trade policy shifts affecting component imports.
Which company shows a better risk-adjusted profile?
Eaton faces its largest risk from complex global supply chains and regulatory breadth, while Generac’s greatest risk lies in higher financial leverage and stock volatility. Eaton’s safer Altman Z-score (5.04 vs. 4.16) and stronger interest coverage signal a more robust risk-adjusted profile. Generac’s rising beta and thinner coverage ratio heighten financial vulnerability. Eaton’s 19.5x interest coverage versus Generac’s 5.56x underlines the concern over Generac’s refinancing risk amid market uncertainty.
Final Verdict: Which stock to choose?
Eaton Corporation plc’s superpower lies in its proven ability to create value through a robust and growing return on invested capital. Its consistent profitability and operational efficiency make it a dependable cash generator. The main point of vigilance is its premium valuation metrics, which might limit near-term upside. Eaton suits investors targeting stable, slightly favorable growth with moderate risk tolerance.
Generac Holdings Inc. benefits from a strategic moat centered on its recurring revenue streams and strong income quality, supporting resilient cash flow. It offers a more conservative safety profile with a healthy current ratio and solid interest coverage compared to Eaton. Generac fits investors seeking growth at a reasonable price, willing to trade some growth momentum for better balance sheet stability.
If you prioritize sustainable value creation and operational excellence, Eaton outshines due to its strong economic moat and superior returns on capital. However, if you seek growth backed by recurring revenue safety and a more conservative liquidity position, Generac offers better stability and a compelling growth-at-a-reasonable-price profile. Both present interesting analytical scenarios depending on your portfolio strategy and risk appetite.
Disclaimer: Investment carries a risk of loss of initial capital. The past performance is not a reliable indicator of future results. Be sure to understand risks before making an investment decision.
Go Further
I encourage you to read the complete analyses of Eaton Corporation plc and Generac Holdings Inc. to enhance your investment decisions: