Home > Comparison > Technology > WIT vs DXC
The strategic rivalry between Wipro Limited and DXC Technology Company shapes the trajectory of the global information technology services sector. Wipro operates as a diversified IT services and products provider with a strong presence in India and government sectors. DXC focuses on digital transformation and cloud infrastructure services, primarily across North America and Europe. This analysis evaluates which firm’s business model offers superior risk-adjusted returns for a diversified portfolio amid evolving technology demands.
Table of contents
Companies Overview
Wipro Limited and DXC Technology Company are pivotal players in the global information technology services market.
Wipro Limited: Global IT Services and Consulting Powerhouse
Wipro stands as a leading IT services and consulting firm with a broad revenue base from IT services, IT products, and India State Run Enterprise services. Its core business generates revenue through digital strategy, technology consulting, cloud, and business process services. In 2026, Wipro emphasizes expanding its digital transformation capabilities across diverse industries worldwide, leveraging its strong foothold in India’s government and enterprise sectors.
DXC Technology Company: Digital Transformation and Infrastructure Specialist
DXC Technology operates as a specialist in IT services and solutions focused on North America, Europe, Asia, and Australia. It earns revenue mainly via its Global Business Services and Global Infrastructure Services segments, offering analytics, cloud migration, and IT outsourcing. DXC’s 2026 strategy centers on accelerating enterprise digital transformation with automation, security solutions, and multi-cloud management to optimize mission-critical operations.
Strategic Collision: Similarities & Divergences
Both companies compete in the IT services sector but diverge in approach. Wipro embraces a broad, integrated services model with strong government ties, while DXC pursues a focused, technology-driven transformation strategy emphasizing cloud and infrastructure. Their primary battleground lies in digital transformation services for enterprises. Wipro offers a diversified portfolio with scale advantages, whereas DXC presents a specialized, infrastructure-heavy profile attracting clients seeking modernization expertise.
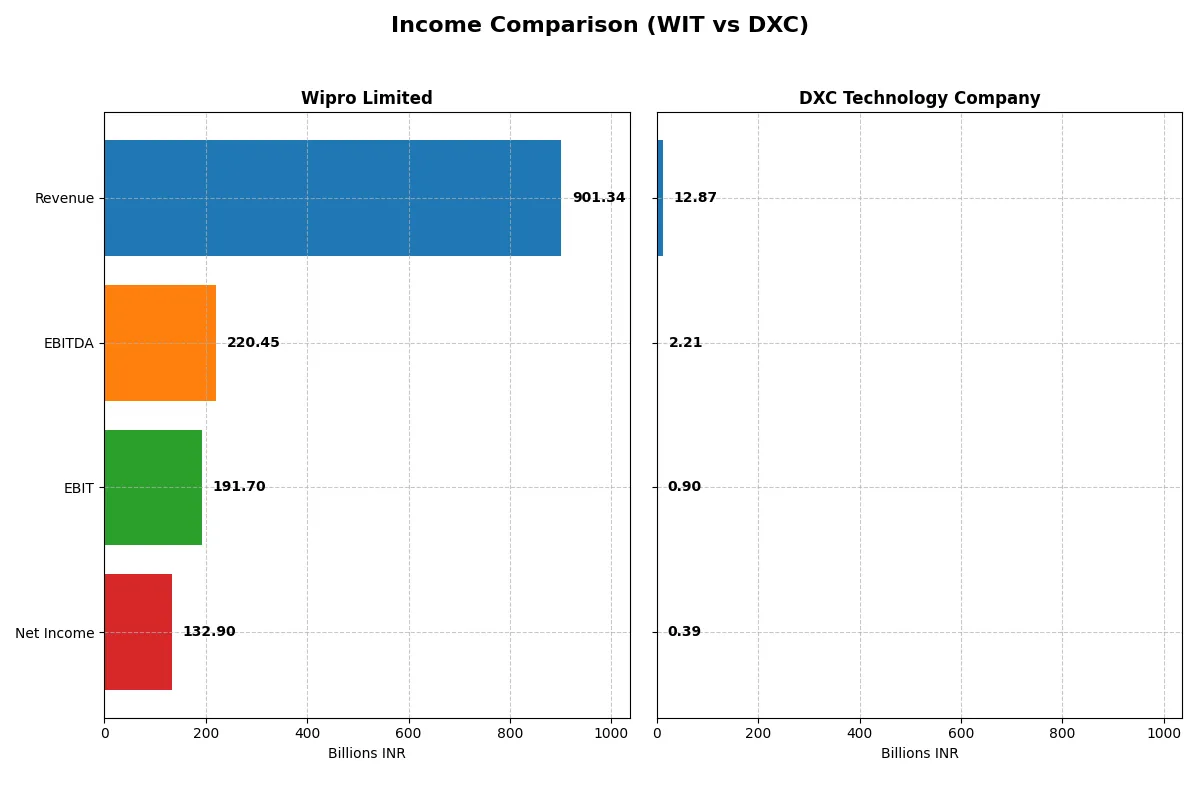
Income Statement Comparison
This data dissects the core profitability and scalability of both corporate engines to reveal who dominates the bottom line:
| Metric | Wipro Limited (WIT) | DXC Technology Company (DXC) |
|---|---|---|
| Revenue | 901.3B INR | 12.87B USD |
| Cost of Revenue | 625.1B INR | 9.77B USD |
| Operating Expenses | 122.7B INR | 2.40B USD |
| Gross Profit | 276.3B INR | 3.10B USD |
| EBITDA | 220.5B INR | 2.21B USD |
| EBIT | 191.7B INR | 895M USD |
| Interest Expense | 14.9B INR | 265M USD |
| Net Income | 132.9B INR | 389M USD |
| EPS | 12.56 INR | 2.15 USD |
| Fiscal Year | 2025 | 2025 |
Income Statement Analysis: The Bottom-Line Duel
This income statement comparison reveals which company drives profitability more efficiently through revenue and cost management over recent years.
Wipro Limited Analysis
Wipro’s revenue hovered near 900B INR from 2021 to 2025, with a 47% growth over the full period. Net income rose steadily to 133B INR in 2025, reflecting strong margin expansion. Gross margin stabilizes around 30.6%, while net margin improved to 14.7%, indicating robust operational efficiency and favorable cost control in the latest year.
DXC Technology Company Analysis
DXC’s revenue declined 21% over the five years, dropping to $12.9B in 2025. Despite this, net income rebounded sharply from a loss to $389M, driven by a near 120% EBIT increase and net margin rising to 3%. Gross margin remains healthy at 24%, but net margin and overall profitability stay modest, reflecting ongoing challenges in top-line growth.
Margin Strength vs. Revenue Resilience
Wipro outperforms with superior margin profiles and consistent net income growth, while DXC shows volatile revenue and slower top-line recovery. Wipro’s stable and expanding margins offer a clearer path to sustainable profitability. Investors seeking steady earnings and margin quality will find Wipro’s profile more compelling than DXC’s uneven momentum.
Financial Ratios Comparison
These vital ratios act as a diagnostic tool to expose the underlying fiscal health, valuation premiums, and capital efficiency of the companies compared below:
| Ratios | Wipro Limited (WIT) | DXC Technology Company (DXC) |
|---|---|---|
| ROE | 16.0% | 12.0% |
| ROIC | 10.5% | 4.4% |
| P/E | 20.6 | 7.9 |
| P/B | 3.30 | 0.95 |
| Current Ratio | 2.72 | 1.22 |
| Quick Ratio | 2.71 | 1.22 |
| D/E | 0.23 | 1.41 |
| Debt-to-Assets | 14.9% | 34.4% |
| Interest Coverage | 10.3 | 2.63 |
| Asset Turnover | 0.70 | 0.97 |
| Fixed Asset Turnover | 8.48 | 6.82 |
| Payout ratio | 47.2% | 0% |
| Dividend yield | 2.29% | 0% |
| Fiscal Year | 2025 | 2025 |
Efficiency & Valuation Duel: The Vital Signs
Financial ratios act as a company’s DNA, unveiling hidden risks and operational strengths that raw numbers alone cannot show.
Wipro Limited
Wipro demonstrates strong profitability with a 16.04% ROE and efficient margins at 14.74%. Its P/E at 20.6 signals a fairly valued stock, though a 3.3 PB ratio appears stretched. Wipro supports shareholders with a 2.29% dividend yield, reflecting steady cash returns alongside ongoing investments in growth and innovation.
DXC Technology Company
DXC shows weaker profitability, with a 12.05% ROE and a low 3.02% net margin, indicating operational challenges. The stock trades at a low P/E of 7.92 and PB of 0.95, marking it as inexpensive. DXC pays no dividend, likely funneling cash toward debt reduction and restructuring efforts amid financial headwinds.
Balanced Strength vs. Value Opportunity
Wipro offers a well-rounded profile with strong profitability and shareholder returns, though its valuation is somewhat stretched. DXC provides deep value but carries operational risks and no dividend support. Investors prioritizing stability may prefer Wipro; those seeking turnaround potential might consider DXC.
Which one offers the Superior Shareholder Reward?
I observe Wipro Limited (WIT) pays a steady dividend with a 2.29% yield and a payout ratio near 47%, well-covered by free cash flow (FCF). Its buyback efforts are moderate but consistent, supporting shareholder returns sustainably. Conversely, DXC Technology (DXC) pays no dividends and carries high leverage (debt-to-equity 1.41), limiting its distribution capacity. DXC’s buybacks are negligible, relying instead on reinvestment to revive margins. Historically, WIT’s balanced distribution, low leverage, and consistent FCF coverage create a more reliable total return profile in 2026. I conclude Wipro offers superior shareholder reward over DXC.
Comparative Score Analysis: The Strategic Profile
The radar chart reveals the fundamental DNA and trade-offs of Wipro Limited and DXC Technology Company, highlighting their financial strengths and valuation nuances:
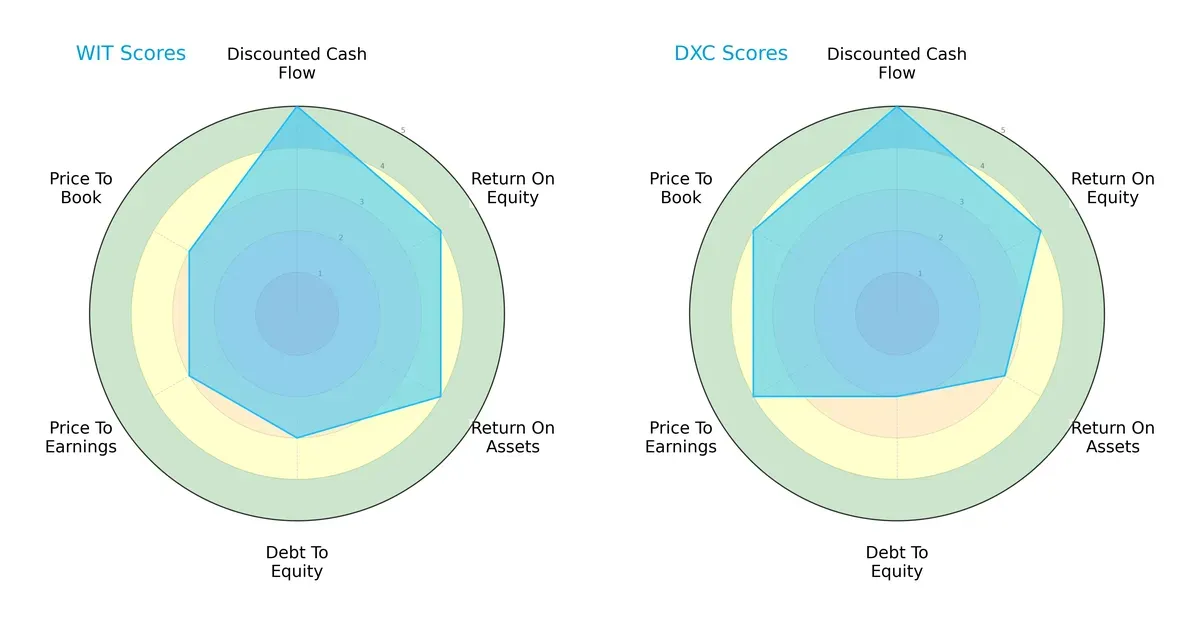
Wipro shows a balanced profile with very favorable DCF and solid ROE and ROA scores, coupled with moderate leverage and valuation metrics. DXC relies more on valuation strengths (PE/PB scores) and lower debt levels but lags slightly in asset efficiency (ROA). Wipro’s consistent operational returns contrast with DXC’s more valuation-driven edge.
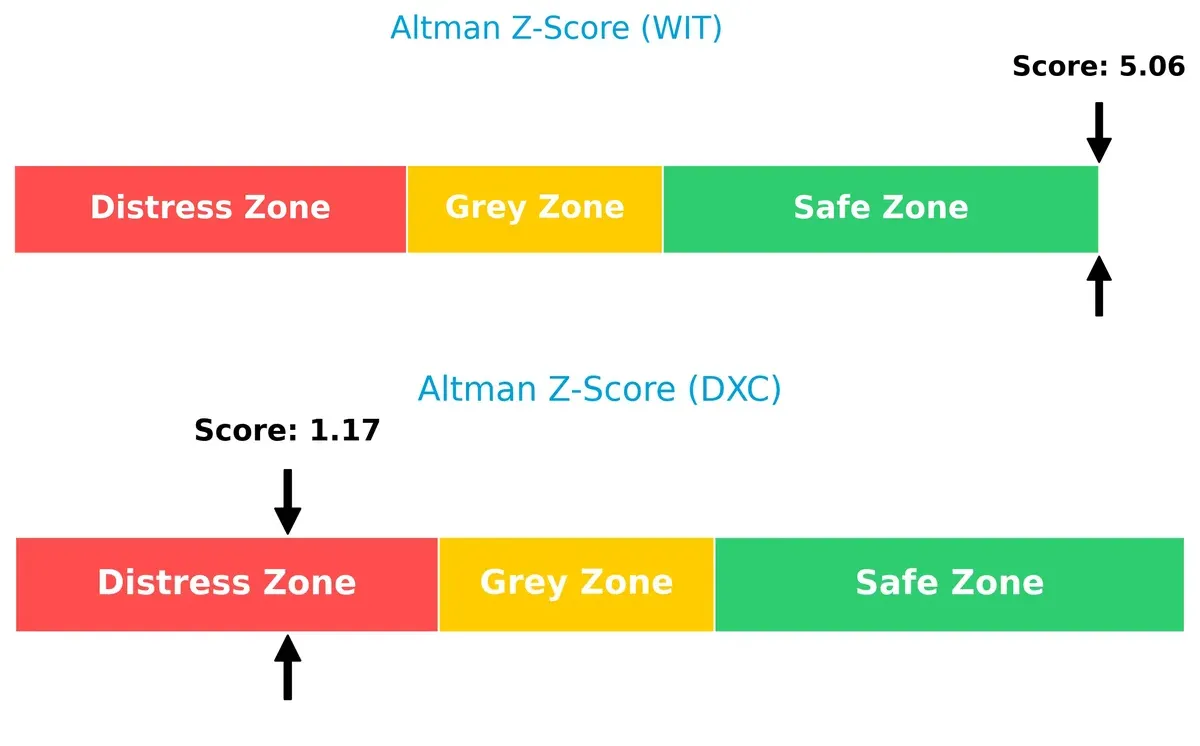
Bankruptcy Risk: Solvency Showdown
Wipro’s Altman Z-Score of 5.06 places it firmly in the safe zone, signaling strong solvency and low bankruptcy risk. DXC’s score of 1.17 signals distress, indicating significant long-term survival challenges in this cycle:
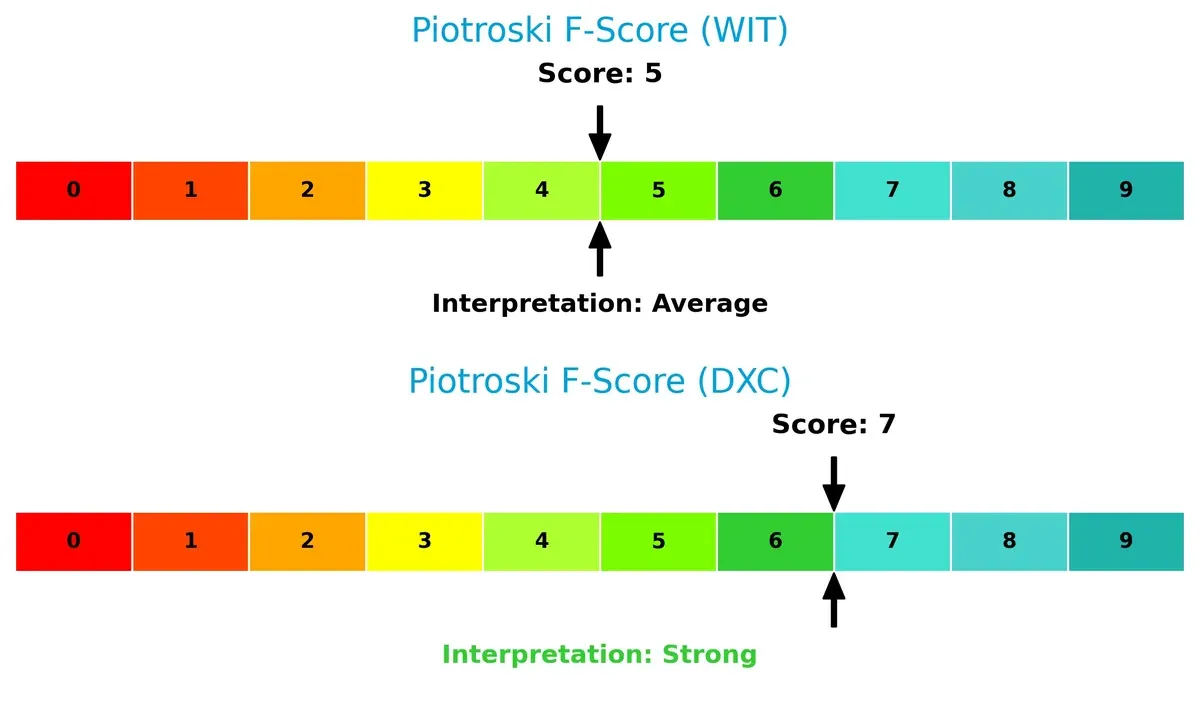
Financial Health: Quality of Operations
DXC scores a stronger 7 on the Piotroski scale, reflecting healthier internal operations and financial quality. Wipro’s average 5 suggests moderate operational strength with potential red flags in efficiency or liquidity:
How are the two companies positioned?
This section dissects Wipro and DXC’s operational DNA by comparing their revenue distribution and internal dynamics of strengths and weaknesses. The goal is to confront their economic moats to reveal which model offers the most resilient, sustainable competitive advantage today.
Strengths and Weaknesses Comparison
This table compares the strengths and weaknesses of Wipro Limited and DXC Technology Company:
Wipro Limited Strengths
- Strong profitability with 14.74% net margin and 16.04% ROE
- High ROIC of 10.49% well above WACC of 6.38%
- Solid liquidity ratios: current 2.72 and quick 2.71
- Low debt levels: debt-to-equity 0.23 and debt-to-assets 14.93%
- Favorable interest coverage at 12.83
- Consistent dividend yield of 2.29%
DXC Technology Company Strengths
- Attractive valuation with PE at 7.92 and PB at 0.95
- Favorable WACC at 5.69%
- Quick ratio favorable at 1.22
- Fixed asset turnover strong at 6.82
- Neutral asset turnover near 0.97
Wipro Limited Weaknesses
- Price-to-book ratio unfavorable at 3.3
- Neutral PE at 20.6
- Asset turnover moderate at 0.7
DXC Technology Company Weaknesses
- Low net margin at 3.02% and ROIC at 4.43% below WACC
- Higher leverage with debt-to-equity 1.41
- Dividend yield zero
- Interest coverage only neutral at 3.38
- Debt-to-assets elevated at 34.43%
Wipro shows robust profitability and strong financial health, supporting stability and dividend payments. DXC faces profitability and leverage challenges, though valuation metrics appear attractive. These contrasts highlight differing strategic positions and risk profiles.
The Moat Duel: Analyzing Competitive Defensibility
A structural moat is the only reliable shield preserving long-term profits from relentless competitive erosion. Let’s dissect the moat dynamics for Wipro and DXC Technology:
Wipro Limited: Diversified IT Services with Operational Efficiency
Wipro’s moat stems from broad IT service offerings and long-standing client relationships creating switching costs. Its 21% EBIT margin and ROIC comfortably above WACC reflect solid value creation, though a declining ROIC signals margin pressures. Expansion into cloud and digital consulting in 2026 could deepen Wipro’s competitive edge.
DXC Technology Company: Legacy Integration with Cost Challenges
DXC relies on complex infrastructure management and legacy system integration, a moat of operational complexity, unlike Wipro’s client diversity. Yet, its negative ROIC versus WACC reveals value destruction and profitability struggles despite recent EBIT growth. DXC’s 2026 outlook hinges on cloud migration success and service modernization to halt margin erosion.
Operational Complexity vs. Diversified Digital Services
Wipro’s wider moat derives from consistently positive economic profits and diversified services driving stable margins. DXC’s narrowing moat reflects operational inefficiencies and shrinking profitability. Wipro stands better positioned to defend market share amid digital transformation pressures in 2026.
Which stock offers better returns?
Wipro Limited and DXC Technology Company show contrasting stock price dynamics over the past year, marked by significant declines and varied recent momentum.
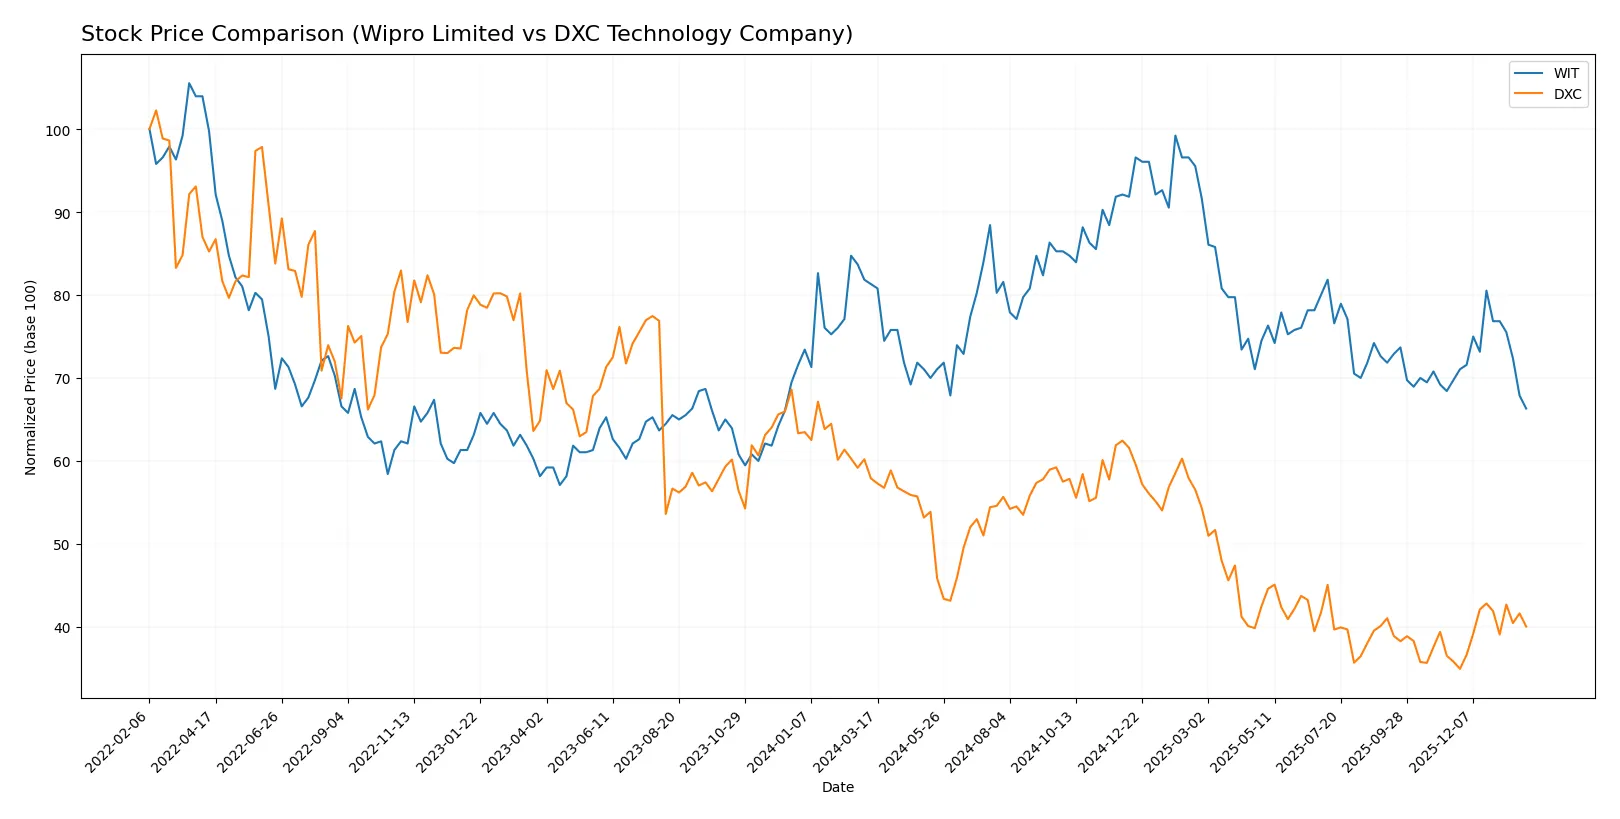
Trend Comparison
Wipro Limited’s stock fell 18.45% over the past year, reflecting a bearish trend with deceleration. Prices ranged between 2.52 and 3.77, with moderate volatility (0.31 std deviation).
DXC Technology’s stock declined 30.82% over the past year, showing a bearish trend but with accelerating losses. It had wider price swings (std deviation 3.0) between 12.59 and 22.5.
DXC’s recent 11.77% gain contrasts Wipro’s 4.91% loss, making DXC’s recent performance stronger despite its worse annual decline. Overall, Wipro outperforms DXC for the full year.
Target Prices
Analysts set clear target price ranges for Wipro Limited and DXC Technology Company, showing moderate upside potential.
| Company | Target Low | Target High | Consensus |
|---|---|---|---|
| Wipro Limited | 7.0 | 7.7 | 7.35 |
| DXC Technology Company | 13.0 | 14.0 | 13.5 |
Wipro’s target consensus at 7.35 suggests strong upside from its current 2.52 price. DXC’s target consensus of 13.5 is slightly below the current 14.43, signaling limited near-term gains.
How do institutions grade them?
The following tables summarize the latest grades assigned by reputable institutions for both companies:
Wipro Limited Grades
This table lists recent grading actions by established financial firms for Wipro Limited.
| Grading Company | Action | New Grade | Date |
|---|---|---|---|
| UBS | Upgrade | Neutral | 2025-01-02 |
| Wedbush | Maintain | Underperform | 2024-01-16 |
| JP Morgan | Maintain | Underweight | 2023-05-24 |
| Bernstein | Downgrade | Underperform | 2023-03-22 |
| Bernstein | Downgrade | Underperform | 2023-03-21 |
| Goldman Sachs | Upgrade | Buy | 2022-09-13 |
| Goldman Sachs | Upgrade | Buy | 2022-09-12 |
| Morgan Stanley | Downgrade | Underweight | 2022-07-14 |
| Morgan Stanley | Downgrade | Underweight | 2022-07-13 |
| Macquarie | Upgrade | Outperform | 2022-06-02 |
DXC Technology Company Grades
This table details the latest grades from recognized grading firms for DXC Technology Company.
| Grading Company | Action | New Grade | Date |
|---|---|---|---|
| Stifel | Maintain | Hold | 2025-10-31 |
| JP Morgan | Maintain | Underweight | 2025-08-20 |
| Morgan Stanley | Maintain | Equal Weight | 2025-08-01 |
| RBC Capital | Maintain | Sector Perform | 2025-08-01 |
| JP Morgan | Maintain | Underweight | 2025-05-21 |
| RBC Capital | Maintain | Sector Perform | 2025-05-15 |
| BMO Capital | Maintain | Market Perform | 2025-05-15 |
| Morgan Stanley | Maintain | Equal Weight | 2025-05-15 |
| Guggenheim | Maintain | Neutral | 2025-05-12 |
| Susquehanna | Maintain | Neutral | 2025-04-23 |
Which company has the best grades?
Wipro Limited’s grades show a mix of upgrades and downgrades, including Buy and Outperform ratings. DXC Technology’s grades consistently maintain Hold or Neutral equivalents. Wipro’s higher ratings suggest more positive institutional sentiment, potentially influencing investor confidence more favorably.

Don’t Let Luck Decide Your Entry Point
Optimize your entry points with our advanced ProRealTime indicators. You’ll get efficient buy signals with precise price targets for maximum performance. Start outperforming now!
Risks specific to each company
The following categories identify critical pressure points and systemic threats facing both firms in the 2026 market environment:
1. Market & Competition
Wipro Limited
- Operates globally with diversified IT services, strong presence in India; faces intense competition in digital and cloud segments.
DXC Technology Company
- Focused on North America, Europe, Asia; competes in legacy IT and cloud migration markets with pressure from larger tech players.
2. Capital Structure & Debt
Wipro Limited
- Low debt-to-equity (0.23), strong interest coverage (12.83), indicating healthy financial leverage and risk control.
DXC Technology Company
- High debt-to-equity (1.41), moderate interest coverage (3.38), raising concerns on financial flexibility and refinancing risk.
3. Stock Volatility
Wipro Limited
- Low beta (0.555) signals lower stock volatility, attractive for risk-averse investors.
DXC Technology Company
- Beta near 1 (1.045) suggests market-level volatility, more exposure to macro risks and sentiment swings.
4. Regulatory & Legal
Wipro Limited
- Operates under Indian regulatory environment with government contracts; potential policy shifts could impact revenues.
DXC Technology Company
- Exposure to U.S. and EU regulations, including data security and privacy laws, poses compliance cost risks.
5. Supply Chain & Operations
Wipro Limited
- Strong operational base in India with extensive employee network; risks include talent retention and geopolitical tensions.
DXC Technology Company
- Relies on multi-region infrastructure services; supply chain disruptions or tech resource shortages could affect service delivery.
6. ESG & Climate Transition
Wipro Limited
- Increasing focus on sustainability initiatives; faces pressure to meet global ESG standards amidst India’s evolving regulations.
DXC Technology Company
- Actively invests in green IT solutions; ESG integration critical given client demands and regulatory scrutiny in developed markets.
7. Geopolitical Exposure
Wipro Limited
- Significant India-centric operations; geopolitical tensions in Asia could affect government and enterprise contracts.
DXC Technology Company
- Broad exposure across US, Europe, Asia; vulnerable to trade tensions, regulatory shifts, and international policy risks.
Which company shows a better risk-adjusted profile?
Wipro Limited’s most impactful risk lies in geopolitical exposure tied to Indian government contracts and regional tensions. DXC faces its largest risk from its elevated debt burden and refinancing challenges. Wipro’s strong balance sheet, low leverage, and lower volatility create a better risk-adjusted profile. DXC’s financial distress signals, including a distress-zone Altman Z-score, heighten caution despite its strong Piotroski score. The recent data underscore Wipro’s resilience in capital structure and market stability as key competitive advantages.
Final Verdict: Which stock to choose?
Wipro Limited’s superpower lies in its robust capital efficiency and consistent value creation. It manages to generate returns well above its cost of capital, signaling a durable competitive edge. A point of vigilance is its slightly declining ROIC trend, which could test future profitability. This stock fits well in an Aggressive Growth portfolio seeking quality with some margin for patience.
DXC Technology Company’s strategic moat centers on its compelling valuation and improving earnings momentum. Its lower price multiples and strong free cash flow yield offer a margin of safety compared to Wipro. However, DXC’s elevated debt levels and value destruction trend warrant caution. It suits a GARP (Growth at a Reasonable Price) investor looking for turnaround potential with moderate risk tolerance.
If you prioritize sustained profitability and operational excellence, Wipro outshines with better stability and capital discipline. However, if you seek undervalued opportunities with a potential rebound, DXC offers a more attractive entry point but with higher financial risk. Both present distinct analytical scenarios tailored to different investor profiles.
Disclaimer: Investment carries a risk of loss of initial capital. The past performance is not a reliable indicator of future results. Be sure to understand risks before making an investment decision.
Go Further
I encourage you to read the complete analyses of Wipro Limited and DXC Technology Company to enhance your investment decisions: