Home > Comparison > Technology > LDOS vs DXC
The strategic rivalry between Leidos Holdings, Inc. and DXC Technology Company defines the current trajectory of the Technology sector’s IT services industry. Leidos operates as a diversified defense and civil solutions provider with a strong government focus, while DXC emphasizes global business and infrastructure services targeting digital transformation. This analysis contrasts their operational models to determine which offers superior risk-adjusted returns for a diversified portfolio navigating evolving tech demands.
Table of contents
Companies Overview
Leidos Holdings and DXC Technology represent significant players in the global information technology services market.
Leidos Holdings, Inc.: Defense and Government IT Leader
Leidos primarily serves the defense, intelligence, civil, and health sectors, leveraging its national security solutions as the core revenue engine. Its 2026 strategy centers on expanding advanced technology systems, cybersecurity, and data analytics to support critical government and allied missions globally.
DXC Technology Company: Enterprise IT and Digital Transformation Expert
DXC focuses on providing IT services through its Global Business Services and Global Infrastructure Services segments. It generates revenue by enabling clients’ digital transformation via analytics, cloud migration, security, and application modernization. In 2026, DXC prioritizes accelerating secure cloud adoption and optimizing mission-critical systems for enterprise customers worldwide.
Strategic Collision: Similarities & Divergences
Both companies compete in IT services but diverge in approach: Leidos emphasizes a defense-oriented, mission-critical solutions model, while DXC targets broad enterprise digital transformation with cloud-centric services. Their battleground lies in government versus commercial IT contracts. Leidos offers a specialized, high-barrier moat; DXC presents a diversified, scale-driven investment profile.
Income Statement Comparison
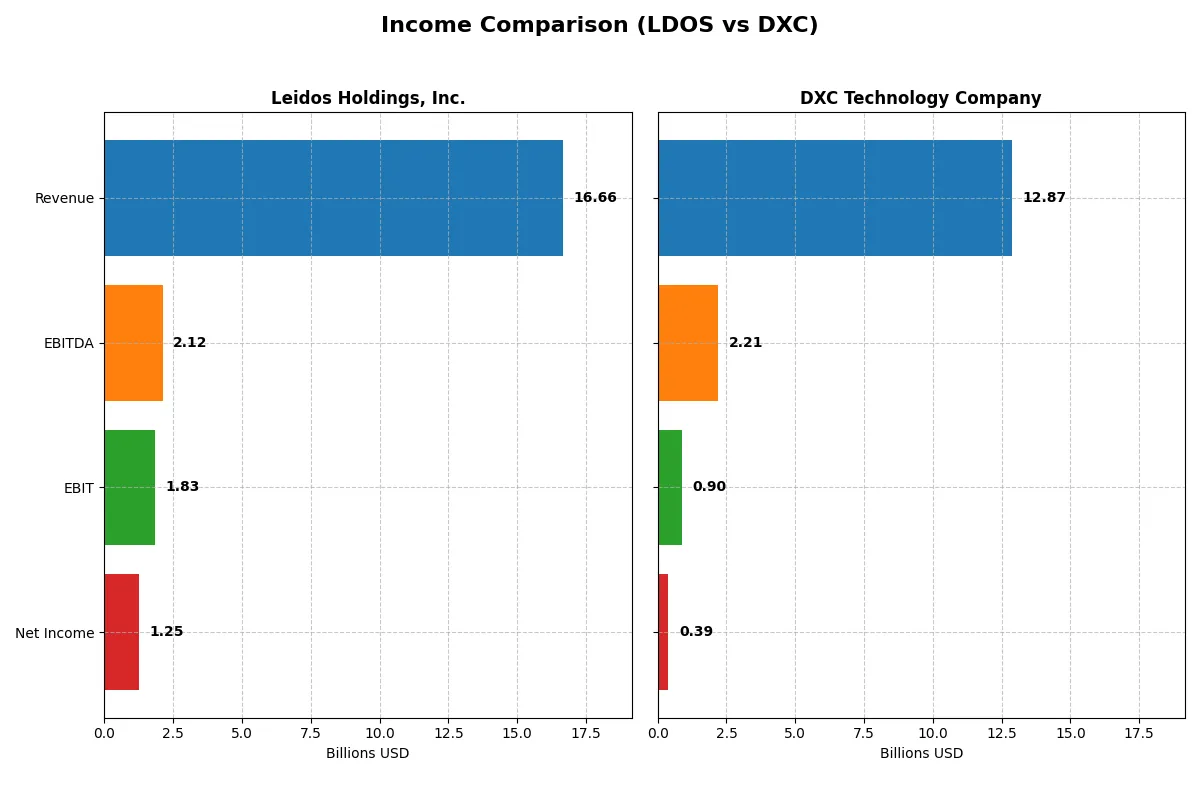
This data dissects the core profitability and scalability of both corporate engines to reveal who dominates the bottom line:
| Metric | Leidos Holdings, Inc. (LDOS) | DXC Technology Company (DXC) |
|---|---|---|
| Revenue | 16.7B | 12.9B |
| Cost of Revenue | 13.9B | 9.8B |
| Operating Expenses | 971M | 2.4B |
| Gross Profit | 2.8B | 3.1B |
| EBITDA | 2.1B | 2.2B |
| EBIT | 1.8B | 895M |
| Interest Expense | 193M | 265M |
| Net Income | 1.25B | 389M |
| EPS | 9.36 | 2.15 |
| Fiscal Year | 2024 | 2025 |
Income Statement Analysis: The Bottom-Line Duel
This income statement comparison reveals which company runs a more efficient and profitable corporate engine through recent financial performance.
Leidos Holdings, Inc. Analysis
Leidos grew revenue steadily from $12.3B in 2020 to $16.7B in 2024, nearly doubling net income from $628M to $1.25B. Gross margin hovered around 16.8%, while net margin expanded to 7.5%, signaling strong cost control. The 2024 surge in EBIT and EPS reflects impressive operational momentum and margin improvement.
DXC Technology Company Analysis
DXC’s revenue declined from $16.3B in 2021 to $12.9B in 2025, with net income falling from $718M to $389M. Despite a superior gross margin of 24.1%, net margin remained modest at 3.0%. The recent rebound in EBIT and EPS signals potential recovery, but overall revenue and net income trends remain under pressure.
Margin Efficiency vs. Revenue Growth
Leidos clearly outperforms DXC with robust revenue growth and margin expansion, doubling net income over five years. DXC shows stronger gross margins but struggles with shrinking top-line and bottom-line results. For investors, Leidos offers a more attractive profile combining scale, margin improvement, and consistent profitability.
Financial Ratios Comparison
These vital ratios act as a diagnostic tool to expose the underlying fiscal health, valuation premiums, and capital efficiency of the companies compared below:
| Ratios | Leidos Holdings, Inc. (LDOS) | DXC Technology Company (DXC) |
|---|---|---|
| ROE | 28.4% | 12.0% |
| ROIC | 13.9% | 4.4% |
| P/E | 15.7 | 7.9 |
| P/B | 4.47 | 0.95 |
| Current Ratio | 1.21 | 1.22 |
| Quick Ratio | 1.13 | 1.22 |
| D/E (Debt-to-Equity) | 1.20 | 1.41 |
| Debt-to-Assets | 40.4% | 34.4% |
| Interest Coverage | 9.47 | 2.63 |
| Asset Turnover | 1.27 | 0.97 |
| Fixed Asset Turnover | 10.7 | 6.82 |
| Payout ratio | 16.6% | 0% |
| Dividend yield | 1.05% | 0% |
| Fiscal Year | 2024 | 2025 |
Efficiency & Valuation Duel: The Vital Signs
Financial ratios serve as a company’s DNA, unveiling hidden risks and highlighting operational strengths critical for investment insights.
Leidos Holdings, Inc.
Leidos shows strong profitability with a 28.4% ROE and a solid 7.53% net margin, reflecting efficient core operations. Its P/E of 15.7 signals fair valuation, though a high P/B of 4.47 indicates some premium pricing. The company returns value via a 1.05% dividend yield, balancing shareholder payouts with growth investments.
DXC Technology Company
DXC posts a modest 12.1% ROE and a weak 3.02% net margin, signaling operational challenges. The P/E of 7.9 suggests undervaluation, supported by a low P/B of 0.95, indicating a potentially cheaper stock. However, the company pays no dividend, likely reinvesting cash for turnaround and growth efforts amid margin pressures.
Balanced Efficiency vs. Value Opportunity
Leidos delivers stronger profitability and moderate valuation, offering operational safety for investors seeking steady returns. DXC’s lower multiples and no dividend hint at riskier value play with turnaround potential. Investors favoring stability lean toward Leidos; those seeking undervalued growth may consider DXC’s contrarian profile.
Which one offers the Superior Shareholder Reward?
Leidos Holdings, Inc. (LDOS) and DXC Technology Company (DXC) differ sharply in shareholder reward strategies. LDOS pays a modest 1.05%-1.58% dividend yield with conservative payout ratios near 16%-31%, covered comfortably by free cash flow (~82%-89%). It complements dividends with steady buybacks, balancing income and capital return sustainably. DXC pays no dividends, reinvesting aggressively in operations and acquisitions, reflected in higher capex per share (up to 3.2). Its buyback activity is limited, relying on growth to boost returns. DXC’s price-to-free-cash-flow ratio near 3.7 signals undervaluation, but weaker margin stability and higher leverage elevate risk. I see LDOS’s balanced dividend-plus-buyback model as more reliable for long-term total return in 2026, while DXC’s reinvestment approach suits risk-tolerant growth seekers. Overall, LDOS offers the more attractive and sustainable shareholder reward profile today.
Comparative Score Analysis: The Strategic Profile
The radar chart reveals the fundamental DNA and trade-offs of Leidos Holdings, Inc. and DXC Technology Company, highlighting their financial strengths and vulnerabilities:
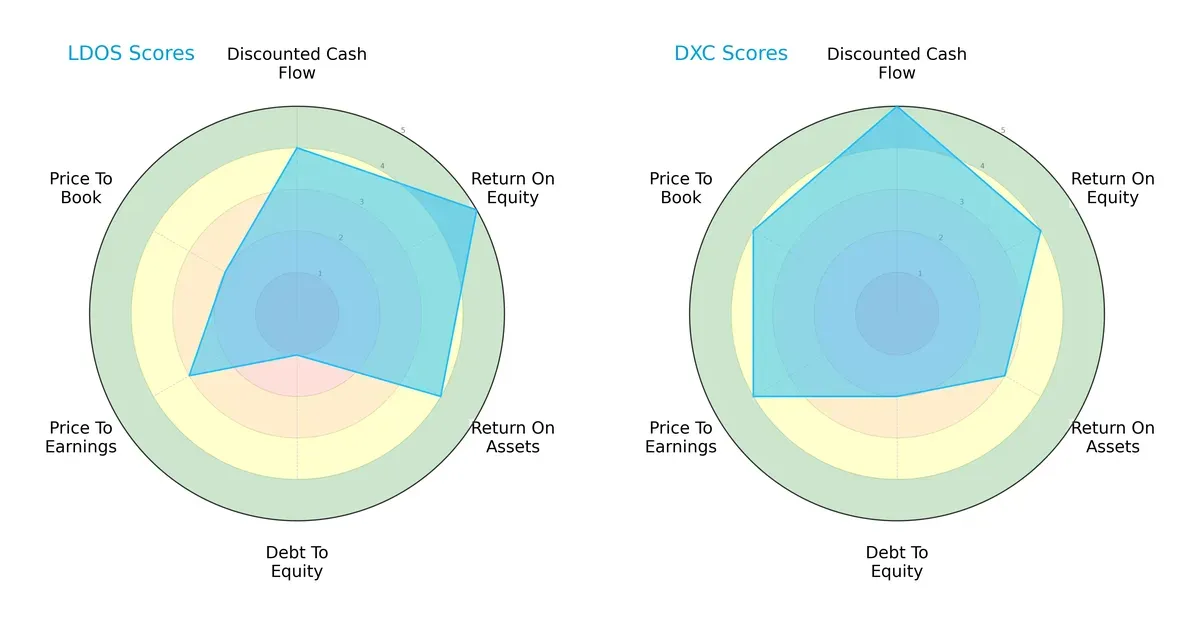
Leidos shows a very favorable ROE (5) and strong ROA (4), indicating efficient capital use. However, its debt-to-equity score is very unfavorable (1), signaling high leverage risk. DXC offers a more balanced profile with very favorable DCF (5) and solid valuation metrics (P/E and P/B scores of 4), but slightly weaker returns (ROE 4, ROA 3). DXC’s moderate debt-to-equity score (2) suggests better financial stability. Overall, DXC balances growth and risk better, while Leidos leans heavily on operational efficiency but carries significant leverage risk.
Bankruptcy Risk: Solvency Showdown
The Altman Z-Score delta signals a stark contrast in bankruptcy risk between the two firms:
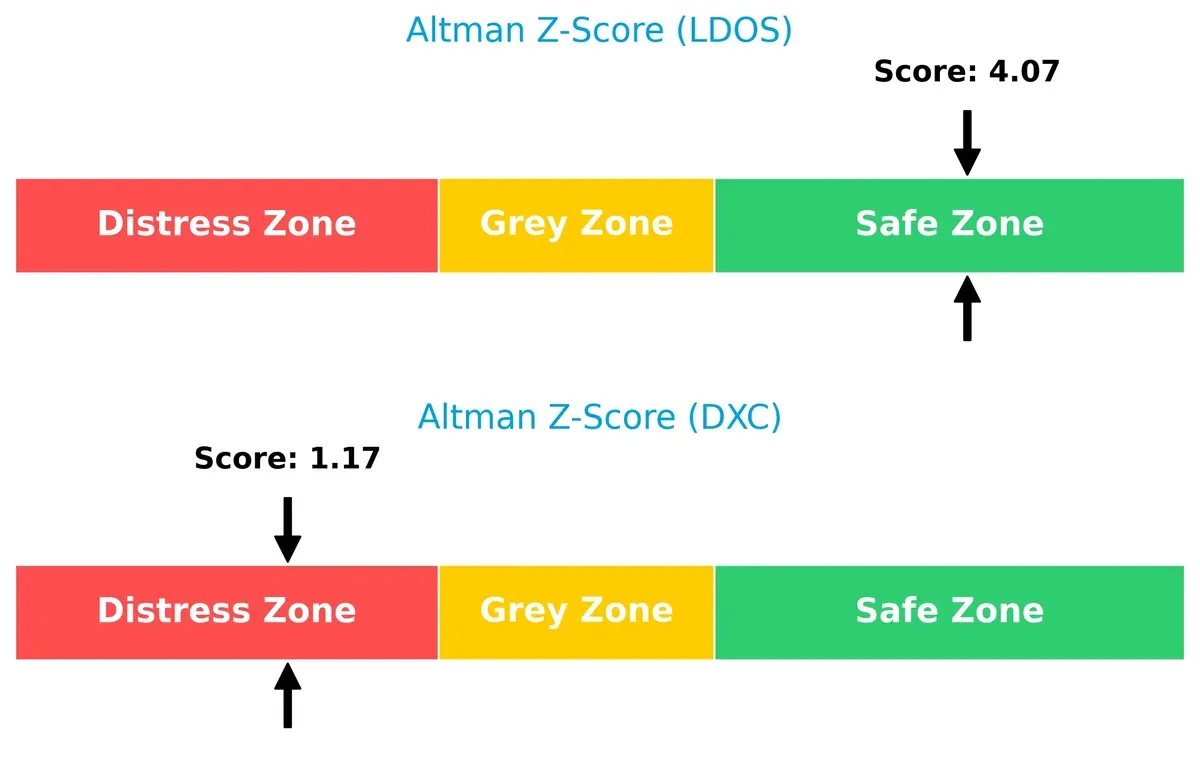
Leidos scores 4.07, placing it securely in the safe zone, indicating strong solvency and low bankruptcy risk in this cycle. DXC’s 1.16 score falls in the distress zone, flagging significant financial distress and elevated bankruptcy risk.
Financial Health: Quality of Operations
Piotroski F-Scores highlight operational quality and financial robustness differences:
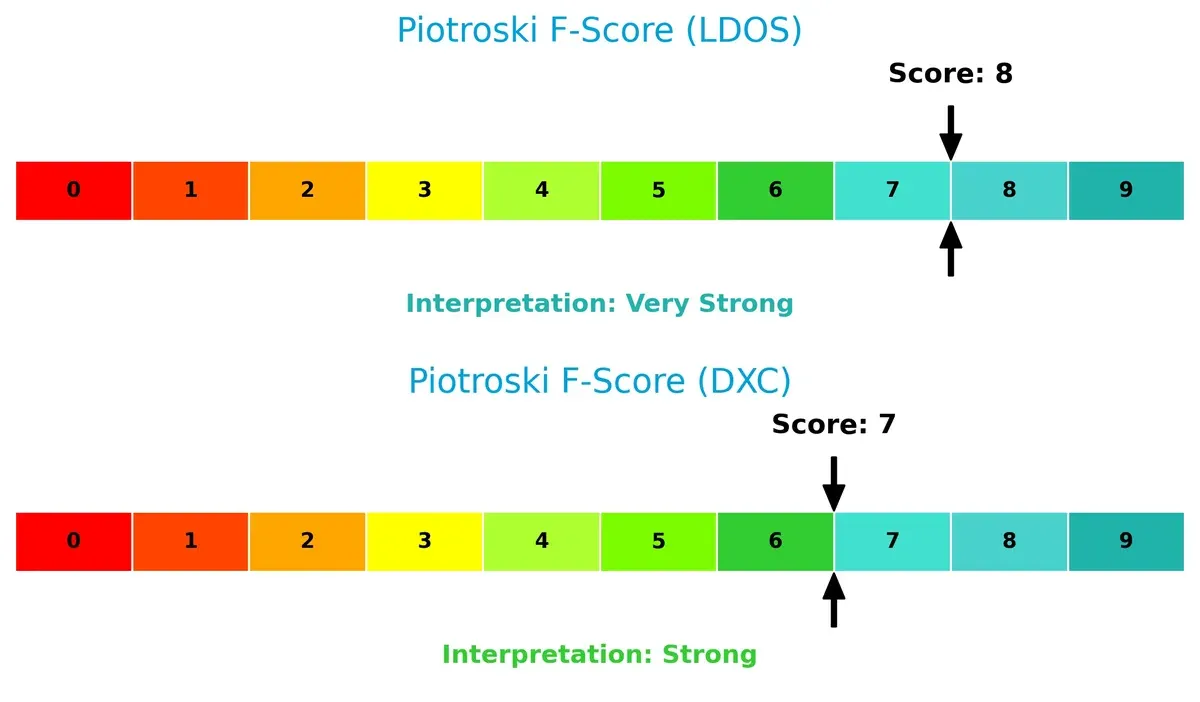
Leidos posts a very strong score of 8, reflecting superior profitability, liquidity, and operational efficiency. DXC’s score of 7 is strong but slightly weaker, hinting at minor internal red flags versus Leidos. This suggests Leidos maintains higher internal financial discipline and quality operations despite its leverage issues.
How are the two companies positioned?
This section dissects LDOS and DXC’s operational DNA by comparing revenue distribution and internal strengths and weaknesses. The goal is to confront their economic moats to reveal which business model offers a more resilient, sustainable competitive advantage today.
Revenue Segmentation: The Strategic Mix
The following visual comparison dissects how Leidos Holdings, Inc. and DXC Technology Company diversify their income streams and where their primary sector bets lie:
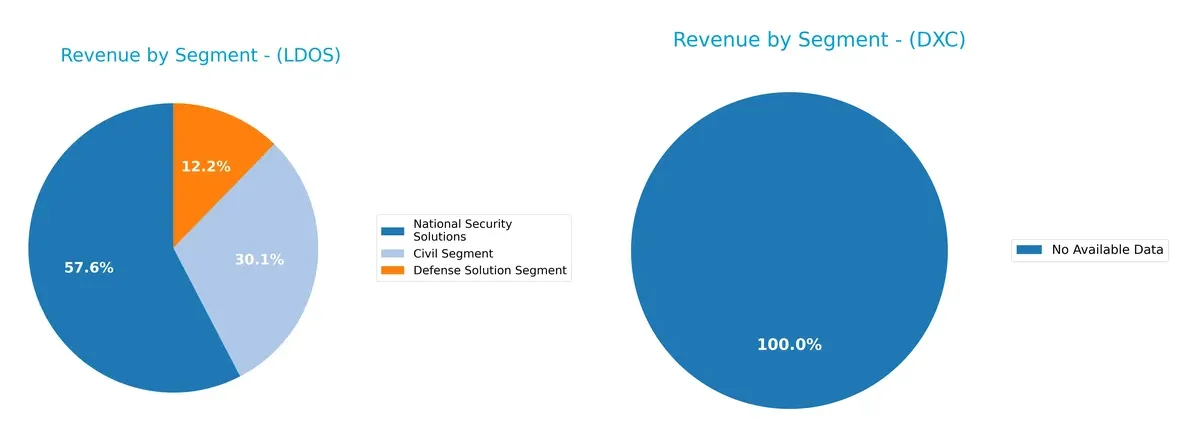
Leidos shows a diversified revenue mix, with $9.55B from National Security Solutions, $5B from Civil, and $2B from Defense in 2024. DXC lacks available segmentation data, preventing direct comparison. Leidos’ reliance on National Security anchors its stronghold in government ecosystems, reducing concentration risk through a balanced Civil segment. This mix signals robust infrastructure dominance, unlike a single-segment dependency that could expose firms to budget shifts.
Strengths and Weaknesses Comparison
This table compares the strengths and weaknesses of Leidos Holdings, Inc. and DXC Technology Company:
Leidos Strengths
- Strong profitability with 28.4% ROE and 13.9% ROIC
- Favorable asset turnover rates
- Diverse revenue streams across defense, civil, and national security
- Solid liquidity with quick ratio above 1
- Slightly favorable overall financial ratios
DXC Strengths
- Favorable valuation metrics with PE of 7.9 and PB below 1
- Favorable weighted average cost of capital
- Neutral liquidity and fixed asset turnover
- Slightly favorable overall financial ratios
Leidos Weaknesses
- Elevated debt-to-equity ratio at 1.2
- Unfavorable price-to-book ratio
- Heavy reliance on U.S. market with limited international exposure
- Net margin neutral but not leading
DXC Weaknesses
- Low net margin at 3.0%
- ROIC significantly below WACC at 4.4%
- Higher debt-to-equity at 1.41
- No dividend yield
- Interest coverage only neutral
Leidos exhibits strong profitability and asset efficiency, but carries some financial leverage risks and limited geographic diversification. DXC benefits from attractive valuation but suffers from weak profitability and capital efficiency, emphasizing the need for strategic financial improvements.
The Moat Duel: Analyzing Competitive Defensibility
A structural moat is the only lasting shield protecting profits from relentless competitive pressure and market erosion. Here’s how Leidos and DXC stack up:
Leidos Holdings, Inc.: Integrated Defense Systems Moat
Leidos’ moat stems from its specialized defense and intelligence contracts, creating high switching costs and steady government spending. This manifests in a strong ROIC growth of 67% over five years and stable margins. Expansion into health and civil sectors in 2026 should deepen its durable moat.
DXC Technology Company: Legacy Infrastructure Challenge
DXC relies on cost efficiency and broad IT outsourcing but faces a shrinking moat. Its ROIC trails WACC by over 1%, and profitability declines signal eroding competitive edge. Yet, recent EBIT growth hints at possible turnaround via cloud migration services, though market disruption risks persist.
Moat Strength: Specialized Integration vs. Cost-Driven Services
Leidos holds a wider and deeper moat with robust value creation and margin resilience. DXC’s declining ROIC and net income erosion expose vulnerability. Leidos is far better positioned to defend its market share in a competitive IT services landscape.
Which stock offers better returns?
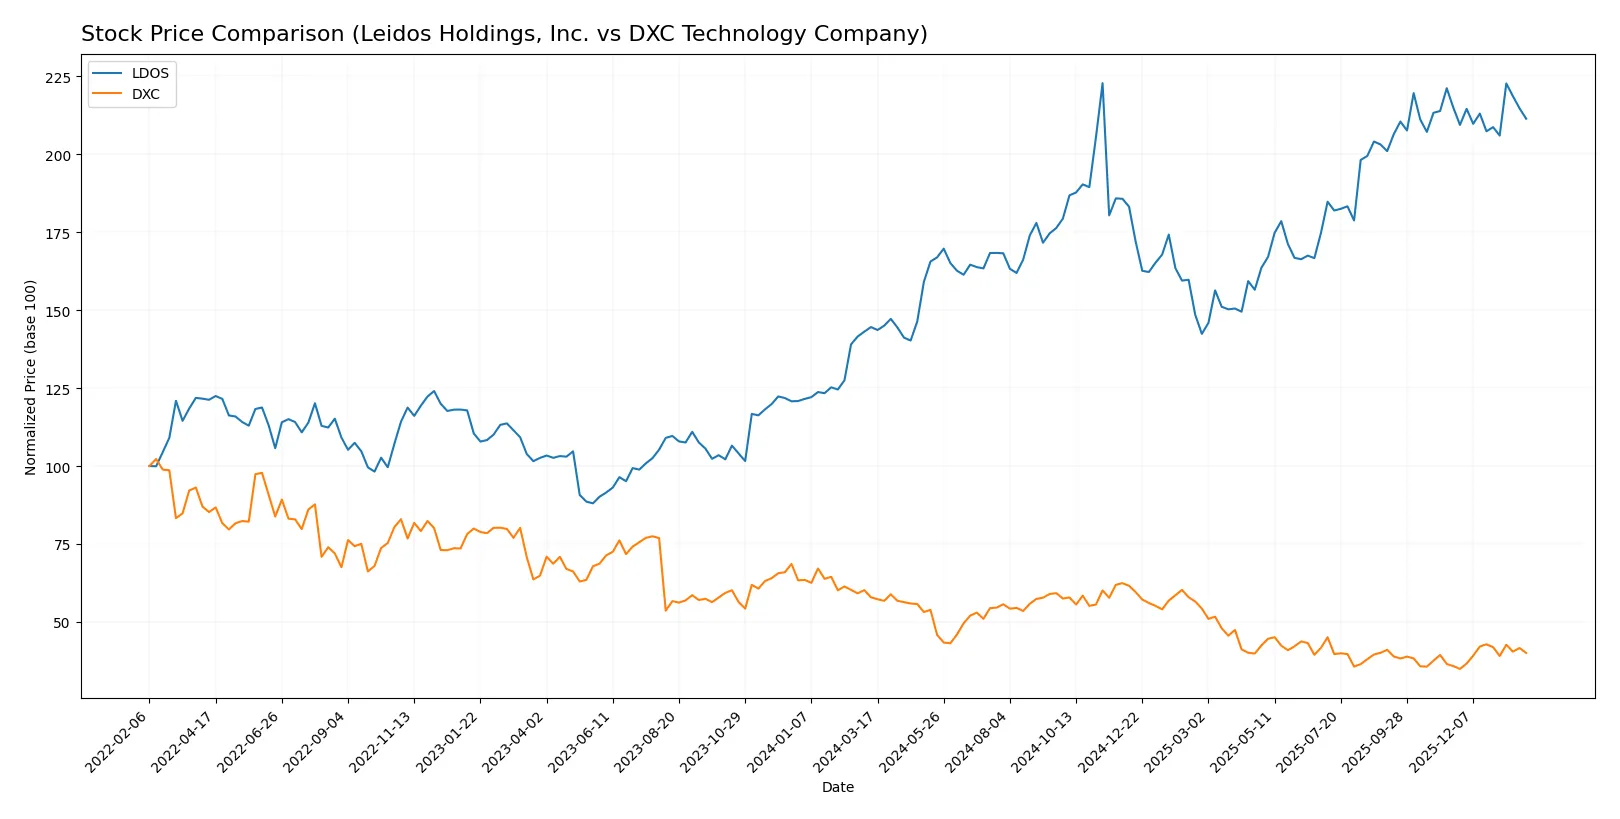
The past year showed contrasting stock price movements: Leidos Holdings surged sharply, while DXC Technology faced a notable decline with recent signs of recovery.
Trend Comparison
Leidos Holdings gained 46.23% over the past 12 months, marking a strong bullish trend despite recent deceleration and a high volatility of 20.68%. The stock hit a peak at 198.42 and bottomed at 124.91.
DXC Technology lost 30.82% in the same period, reflecting a bearish trend with accelerating decline. Volatility remained low at 3.0, with the stock ranging between 12.59 and 22.5. Recent months show an 11.77% rebound.
Leidos outperformed DXC significantly over the year. Despite DXC’s recent uptick, Leidos delivered the highest overall market performance in this timeframe.
Target Prices
Analysts present a clear target consensus for Leidos Holdings, Inc. and DXC Technology Company.
| Company | Target Low | Target High | Consensus |
|---|---|---|---|
| Leidos Holdings, Inc. | 204 | 230 | 219.8 |
| DXC Technology Company | 13 | 14 | 13.5 |
Leidos targets imply a 17% upside from the current 188 price, reflecting strong confidence. DXC’s modest upside signals cautious optimism near its 14.43 stock price.

Don’t Let Luck Decide Your Entry Point
Optimize your entry points with our advanced ProRealTime indicators. You’ll get efficient buy signals with precise price targets for maximum performance. Start outperforming now!
How do institutions grade them?
Leidos Holdings, Inc. Grades
The following table summarizes recent grades from established grading firms for Leidos Holdings, Inc.:
| Grading Company | Action | New Grade | Date |
|---|---|---|---|
| UBS | Maintain | Neutral | 2026-01-15 |
| Citigroup | Maintain | Buy | 2026-01-13 |
| Stifel | Downgrade | Hold | 2026-01-08 |
| B of A Securities | Maintain | Buy | 2025-11-07 |
| Truist Securities | Maintain | Buy | 2025-11-05 |
| UBS | Maintain | Neutral | 2025-11-05 |
| Cantor Fitzgerald | Maintain | Overweight | 2025-10-31 |
| Argus Research | Maintain | Buy | 2025-09-24 |
| RBC Capital | Upgrade | Outperform | 2025-09-04 |
| B of A Securities | Maintain | Buy | 2025-09-04 |
DXC Technology Company Grades
Below is a summary of recent grading actions from reputable firms for DXC Technology Company:
| Grading Company | Action | New Grade | Date |
|---|---|---|---|
| Stifel | Maintain | Hold | 2025-10-31 |
| JP Morgan | Maintain | Underweight | 2025-08-20 |
| Morgan Stanley | Maintain | Equal Weight | 2025-08-01 |
| RBC Capital | Maintain | Sector Perform | 2025-08-01 |
| JP Morgan | Maintain | Underweight | 2025-05-21 |
| RBC Capital | Maintain | Sector Perform | 2025-05-15 |
| BMO Capital | Maintain | Market Perform | 2025-05-15 |
| Morgan Stanley | Maintain | Equal Weight | 2025-05-15 |
| Guggenheim | Maintain | Neutral | 2025-05-12 |
| Susquehanna | Maintain | Neutral | 2025-04-23 |
Which company has the best grades?
Leidos Holdings, Inc. exhibits stronger consensus with multiple buy and outperform ratings. DXC Technology Company consistently receives hold, equal weight, or underweight grades. This divergence signals more positive institutional sentiment toward Leidos, potentially influencing investor confidence and demand.
Risks specific to each company
The following categories identify critical pressure points and systemic threats facing both firms in the 2026 market environment:
1. Market & Competition
Leidos Holdings, Inc. (LDOS)
- Operates in defense and health sectors with strong government contracts, facing moderate competitive pressure.
DXC Technology Company (DXC)
- Faces intense competition in global IT services with pressure to innovate and reduce costs.
2. Capital Structure & Debt
Leidos Holdings, Inc. (LDOS)
- Debt-to-equity of 1.2 signals elevated leverage; interest coverage is strong at 9.49, indicating manageable debt risk.
DXC Technology Company (DXC)
- Higher leverage with debt-to-equity at 1.41 and weaker interest coverage of 3.38 raises financial risk concerns.
3. Stock Volatility
Leidos Holdings, Inc. (LDOS)
- Beta of 0.592 shows lower volatility, reflecting stability in defense contracts and steady cash flows.
DXC Technology Company (DXC)
- Beta of 1.045 indicates higher price volatility, typical of IT services exposed to cyclical market changes.
4. Regulatory & Legal
Leidos Holdings, Inc. (LDOS)
- Subject to strict government regulations in defense and health sectors, with potential contract risks.
DXC Technology Company (DXC)
- Faces complex regulatory environments across multiple jurisdictions, increasing compliance costs and litigation risk.
5. Supply Chain & Operations
Leidos Holdings, Inc. (LDOS)
- Relies on specialized suppliers and government project timelines, posing operational risks if disruptions occur.
DXC Technology Company (DXC)
- Operates a complex global supply chain for IT infrastructure, vulnerable to geopolitical and technological disruptions.
6. ESG & Climate Transition
Leidos Holdings, Inc. (LDOS)
- Growing ESG focus in government contracts; climate transition could increase compliance costs but also create new opportunities.
DXC Technology Company (DXC)
- ESG integration is advancing but legacy IT systems and global footprint may delay transition and expose to reputational risks.
7. Geopolitical Exposure
Leidos Holdings, Inc. (LDOS)
- High exposure to U.S. defense and allied governments; geopolitical shifts may affect contract renewals and budgets.
DXC Technology Company (DXC)
- Global operations expose DXC to geopolitical tensions and regulatory changes across multiple regions.
Which company shows a better risk-adjusted profile?
Leidos faces its largest risk in regulatory and geopolitical exposure but benefits from strong cash flow stability and lower stock volatility. DXC struggles primarily with financial leverage and operational complexity, increasing its risk profile. I observe Leidos’ strong Altman Z-score (4.07, safe zone) versus DXC’s distress-level score (1.17), highlighting superior financial health. Leidos’ lower beta and higher interest coverage reinforce a better risk-adjusted profile amid 2026’s market uncertainties.
Final Verdict: Which stock to choose?
Leidos Holdings, Inc. (LDOS) shines as a cash-generating powerhouse with a durable competitive advantage. Its strong ROIC exceeding WACC signals efficient capital use and value creation. A point of vigilance remains its relatively high debt-to-equity ratio. LDOS suits investors targeting aggressive growth with a tolerance for leverage risks.
DXC Technology Company (DXC) offers a strategic moat in undervalued pricing supported by a low P/E and P/B ratio. Its balance sheet appears safer than LDOS’s, though the company struggles with declining profitability and value destruction. DXC fits portfolios favoring GARP—growth at a reasonable price—with a cautious eye on operational challenges.
If you prioritize durable profitability and value creation, LDOS outshines due to its strong and growing ROIC. However, if you seek value opportunities with better balance sheet stability and discounted valuation, DXC offers a compelling scenario despite its profitability headwinds. Both demand careful risk management aligned with specific investment strategies.
Disclaimer: Investment carries a risk of loss of initial capital. The past performance is not a reliable indicator of future results. Be sure to understand risks before making an investment decision.
Go Further
I encourage you to read the complete analyses of Leidos Holdings, Inc. and DXC Technology Company to enhance your investment decisions: