Home > Comparison > Technology > JKHY vs DXC
The strategic rivalry between Jack Henry & Associates and DXC Technology shapes the Information Technology Services sector’s evolution. Jack Henry operates as a specialized, mid-cap provider focused on financial technology solutions. DXC, by contrast, is a sprawling, global IT services heavyweight with broad consulting and infrastructure offerings. This head-to-head reflects a classic contrast between niche specialization and scale-driven diversification. This analysis aims to identify which profile delivers superior risk-adjusted returns for a balanced investment portfolio.

Table of contents
Companies Overview
Jack Henry & Associates and DXC Technology stand as key players in the IT services sector, shaping enterprise solutions globally.
Jack Henry & Associates, Inc.: Specialist in Financial Tech Solutions
Jack Henry & Associates dominates the U.S. financial technology market with core banking and payment processing solutions. Its revenue stems from servicing banks and credit unions through integrated software platforms like SilverLake and Episys. In 2026, the company emphasizes enhancing digital products and security services, reinforcing its competitive edge in financial institutions’ evolving demands.
DXC Technology Company: Global IT Services Powerhouse
DXC Technology leads with comprehensive IT services and digital transformation solutions across multiple continents. Its revenue engine combines Global Business Services and Infrastructure Services, focusing on analytics, cloud migration, and security. The strategic focus in 2026 remains on accelerating client innovation while managing risk and reducing operational costs through agile automation and multi-cloud management.
Strategic Collision: Similarities & Divergences
Both firms excel in IT services but diverge sharply in scope and specialization. Jack Henry targets the financial sector’s niche with proprietary banking software, while DXC pursues a broad, global approach with agile IT infrastructure and consulting. Their primary battleground is digital transformation, yet Jack Henry’s focus on financial institutions contrasts with DXC’s diversified client base. This yields distinctly different investment profiles rooted in specialization versus scale.
Income Statement Comparison
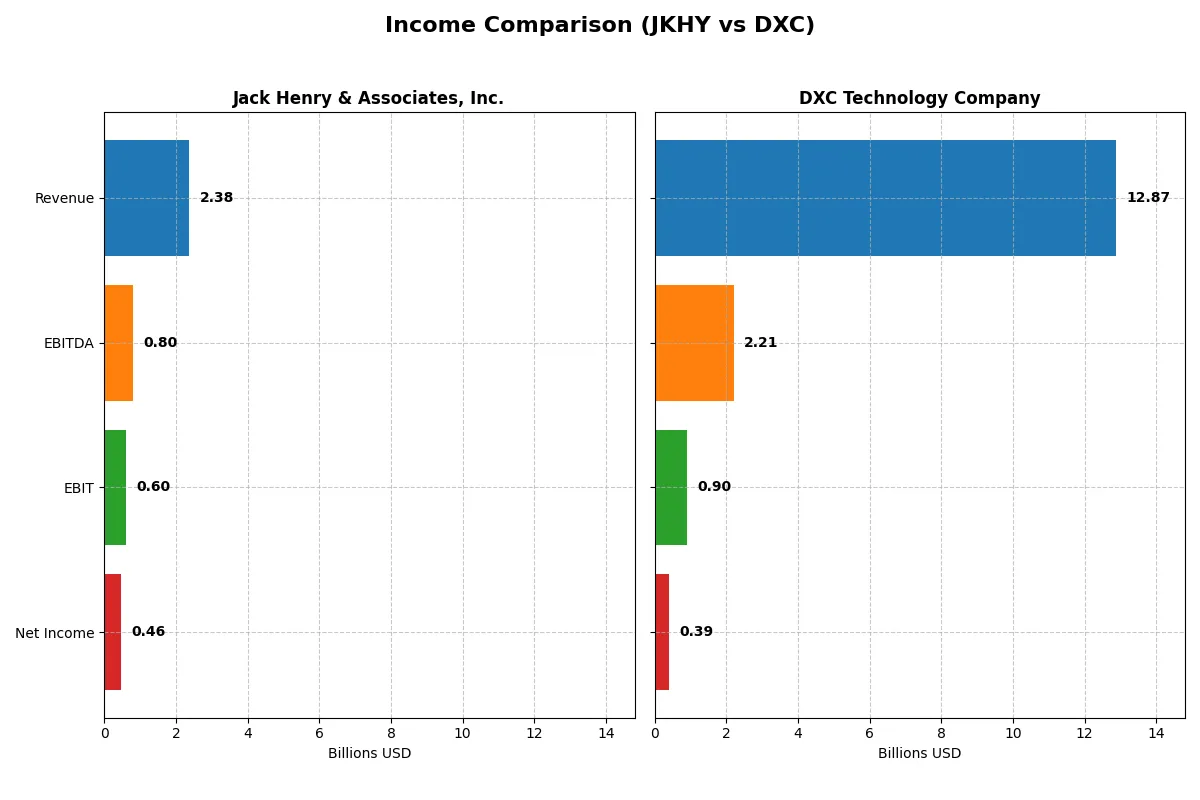
This comparison dissects the core profitability and scalability of both corporate engines to reveal who dominates the bottom line:
| Metric | Jack Henry & Associates, Inc. (JKHY) | DXC Technology Company (DXC) |
|---|---|---|
| Revenue | 2.38B | 12.87B |
| Cost of Revenue | 1.36B | 9.77B |
| Operating Expenses | 446M | 2.40B |
| Gross Profit | 1.01B | 3.10B |
| EBITDA | 801M | 2.21B |
| EBIT | 596M | 895M |
| Interest Expense | 10M | 265M |
| Net Income | 456M | 389M |
| EPS | 6.24 | 2.15 |
| Fiscal Year | 2025 | 2025 |
Income Statement Analysis: The Bottom-Line Duel
This income statement comparison exposes which company operates its corporate engine with superior efficiency and profit momentum.
Jack Henry & Associates, Inc. Analysis
Jack Henry’s revenue rose steadily from 1.76B in 2021 to 2.38B in 2025, with net income growing from 311M to 456M. Its gross margin remains robust at 42.7%, while net margin improved to 19.2%. The company shows strong momentum in 2025 with a 15.9% EBIT growth and favorable operating expense control.
DXC Technology Company Analysis
DXC’s revenue declined from 16.3B in 2021 to 12.9B in 2025, with net income swinging from 718M to 389M. Gross margin stands at a thinner 24.1%, and net margin remains low at 3.0%. Despite recent EBIT and net margin improvement in 2025, overall revenue and net income trends remain unfavorable over the period.
Margin Strength vs. Scale Decline
Jack Henry delivers consistent revenue and profit expansion with strong margins, reflecting efficient capital allocation and cost control. DXC struggles with declining top-line and profitability despite recent margin recoveries. For investors prioritizing stable growth and margin health, Jack Henry’s profile appears distinctly more attractive.
Financial Ratios Comparison
These vital ratios act as a diagnostic tool to expose the underlying fiscal health, valuation premiums, and capital efficiency of the companies compared below:
| Ratios | Jack Henry & Associates, Inc. (JKHY) | DXC Technology Company (DXC) |
|---|---|---|
| ROE | 21.4% | 12.0% |
| ROIC | 17.6% | 4.4% |
| P/E | 28.9 | 7.9 |
| P/B | 6.18 | 0.95 |
| Current Ratio | 1.27 | 1.22 |
| Quick Ratio | 1.27 | 1.22 |
| D/E | 0 | 1.41 |
| Debt-to-Assets | 0 | 34.4% |
| Interest Coverage | 54.5 | 2.63 |
| Asset Turnover | 0.78 | 0.97 |
| Fixed Asset Turnover | 10.75 | 6.82 |
| Payout ratio | 36.1% | 0% |
| Dividend yield | 1.25% | 0% |
| Fiscal Year | 2025 | 2025 |
Efficiency & Valuation Duel: The Vital Signs
Ratios act as a company’s DNA, exposing hidden risks and showcasing operational strengths critical for investment decisions.
Jack Henry & Associates, Inc.
Jack Henry posts a strong 21.4% ROE and 19.2% net margin, indicating robust profitability. Its P/E of 28.9 and P/B at 6.18 suggest the stock is expensive relative to earnings and book value. The company balances this with a modest 1.25% dividend yield, reflecting steady shareholder returns alongside reinvestment in R&D at 6.85% of revenue.
DXC Technology Company
DXC shows a moderate 12.1% ROE but a weak 3.0% net margin, signaling less efficient profitability. With a P/E of 7.9 and P/B near 0.95, the stock trades cheaply, appealing to value investors. However, DXC pays no dividend, and its capital allocation leans toward managing debt rather than growth or returns, presenting higher risk in shareholder rewards.
Premium Valuation vs. Operational Safety
Jack Henry’s superior profitability and healthy dividend contrast with DXC’s cheaper valuation but weaker margins and no payout. JKHY offers a safer profile with operational excellence, while DXC suits investors prioritizing value and turnaround potential despite elevated risks.
Which one offers the Superior Shareholder Reward?
I compare Jack Henry & Associates and DXC Technology’s distribution models. Jack Henry yields ~1.3% with a sustainable 36% payout ratio, supported by strong free cash flow of 8B. It also executes consistent buybacks, enhancing shareholder value. DXC pays no dividends, focusing on reinvestment but carries heavy debt (debt/equity ~1.4) and thinner margins. Its buybacks are minimal, limiting direct shareholder returns. Historically in tech services, steady dividends plus buybacks outperform uncertain growth gambles. I find Jack Henry’s balanced payout and buyback strategy delivers a superior total return profile for 2026 investors.
Comparative Score Analysis: The Strategic Profile
The radar chart reveals the fundamental DNA and trade-offs of Jack Henry & Associates, Inc. and DXC Technology Company, highlighting their financial strengths and valuation differences:

Jack Henry & Associates shows a balanced profile with strong asset efficiency (ROA score 5) and prudent leverage (Debt/Equity score 4). DXC Technology excels in discounted cash flow valuation (DCF score 5) and market valuation metrics (PE and PB scores 4 each), suggesting a growth or value advantage. However, DXC carries higher financial risk with a weaker debt position (score 2). Jack Henry relies on operational efficiency, while DXC leverages valuation appeal amid moderate asset returns.
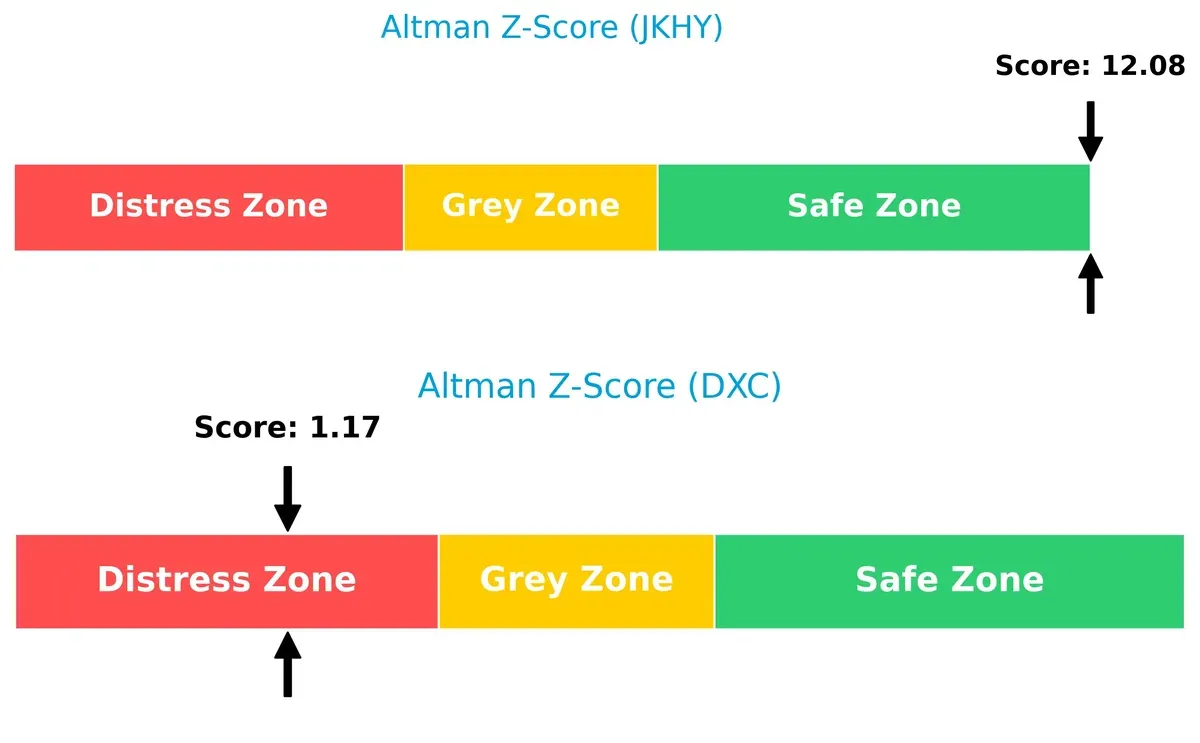
Bankruptcy Risk: Solvency Showdown
Jack Henry’s Altman Z-Score of 12.08 signals exceptional financial safety compared to DXC’s 1.17, which places it in distress zone. This stark contrast implies Jack Henry is structurally sound for long-term survival, while DXC faces heightened bankruptcy risk in this cycle:
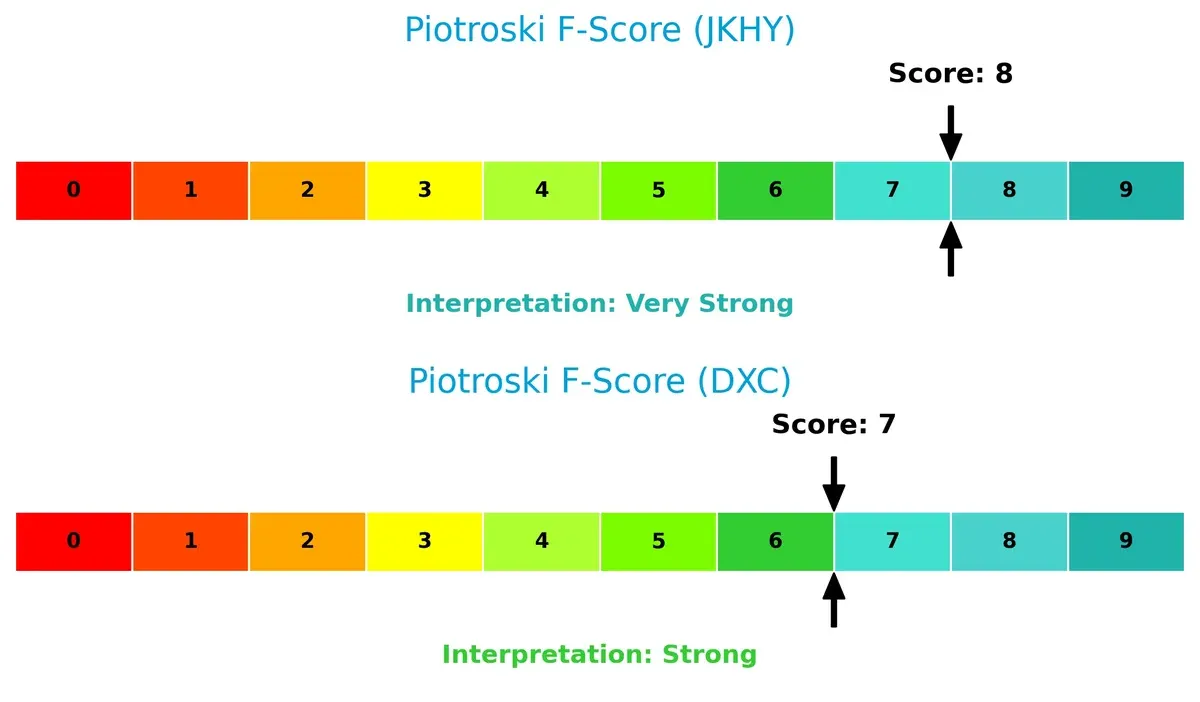
Financial Health: Quality of Operations
Jack Henry’s Piotroski F-Score of 8 indicates very strong financial health and operational quality. DXC’s score of 7 remains strong but trails slightly, suggesting some internal metrics could pose red flags relative to Jack Henry:
How are the two companies positioned?
This section dissects the operational DNA of JKHY and DXC by comparing revenue distribution by segment alongside their core strengths and weaknesses. The goal is to confront their economic moats and identify which model offers the most resilient, sustainable competitive advantage in today’s market.
Revenue Segmentation: The Strategic Mix
The following visual comparison dissects how Jack Henry & Associates, Inc. and DXC Technology Company diversify their income streams and where their primary sector bets lie:
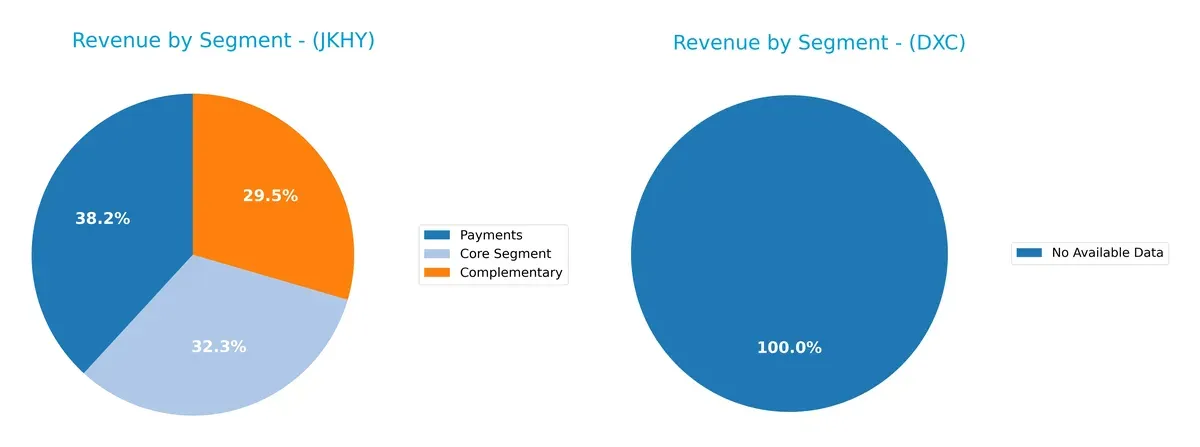
Jack Henry & Associates, Inc. shows a balanced revenue mix in 2025 with Payments at $873M, Core Segment $739M, and Complementary $675M. DXC Technology lacks segment data, leaving its diversification unclear. Jack Henry’s diversified revenue anchors it against sector volatility, reducing concentration risk. This mix fuels ecosystem lock-in through varied financial services, unlike a single-segment reliance that heightens vulnerability.
Strengths and Weaknesses Comparison
This table compares the strengths and weaknesses of Jack Henry & Associates, Inc. and DXC Technology Company:
Jack Henry & Associates, Inc. Strengths
- High profitability with 19.19% net margin and 21.39% ROE
- Strong capital efficiency with 17.63% ROIC vs 7.24% WACC
- Zero debt enhances financial stability
- Favorable quick ratio at 1.27 supports liquidity
- Solid fixed asset turnover at 10.75 indicates efficient asset use
DXC Technology Company Strengths
- Low valuation multiples with PE 7.92 and PB 0.95 suggest undervaluation
- Favorable WACC at 5.69% lowers capital costs
- Favorable quick ratio at 1.22 supports liquidity
- Neutral asset turnover at 0.97 shows moderate efficiency
- Favorable fixed asset turnover at 6.82 reflects decent asset management
Jack Henry & Associates, Inc. Weaknesses
- High valuation multiples with PE 28.88 and PB 6.18 may limit upside
- Neutral current ratio at 1.27 signals modest short-term liquidity
- Moderate asset turnover at 0.78 could constrain growth
- Dividend yield at 1.25% is only neutral
DXC Technology Company Weaknesses
- Low profitability with 3.02% net margin and 4.43% ROIC highlights operational challenges
- Significant debt with DE 1.41 and 34.43% debt to assets increases risk
- Interest coverage at 3.38 is only neutral, indicating limited buffer
- Zero dividend yield may deter income investors
Jack Henry & Associates demonstrates strong profitability and a pristine balance sheet but faces valuation concerns. DXC shows potential value appeal with lower multiples but struggles with profitability and higher leverage. These factors shape their strategic options differently.
The Moat Duel: Analyzing Competitive Defensibility
A structural moat is the only thing protecting long-term profits from relentless competition and market disruption. Let’s dissect the moats of two IT services giants:
Jack Henry & Associates, Inc.: Durable Switching Costs Moat
Jack Henry leverages strong switching costs embedded in its banking software ecosystem. This moat shows in its high 25% EBIT margin and growing 10.4% ROIC above WACC. In 2026, expanding digital payments and security solutions could deepen its defensibility.
DXC Technology Company: Fading Scale and Integration Moat
DXC relies on scale and global IT services integration, contrasting Jack Henry’s niche focus. However, DXC’s negative ROIC spread and declining profitability signal weakening competitive positioning. Recovery hinges on successful digital transformation wins in 2026.
Moat Strength Showdown: Switching Costs vs. Scale Integration
Jack Henry’s rising ROIC and consistent value creation reveal a wider, deeper moat than DXC’s eroding profitability and value destruction. Jack Henry stands far better equipped to defend and expand its market share amid evolving technology demands.
Which stock offers better returns?
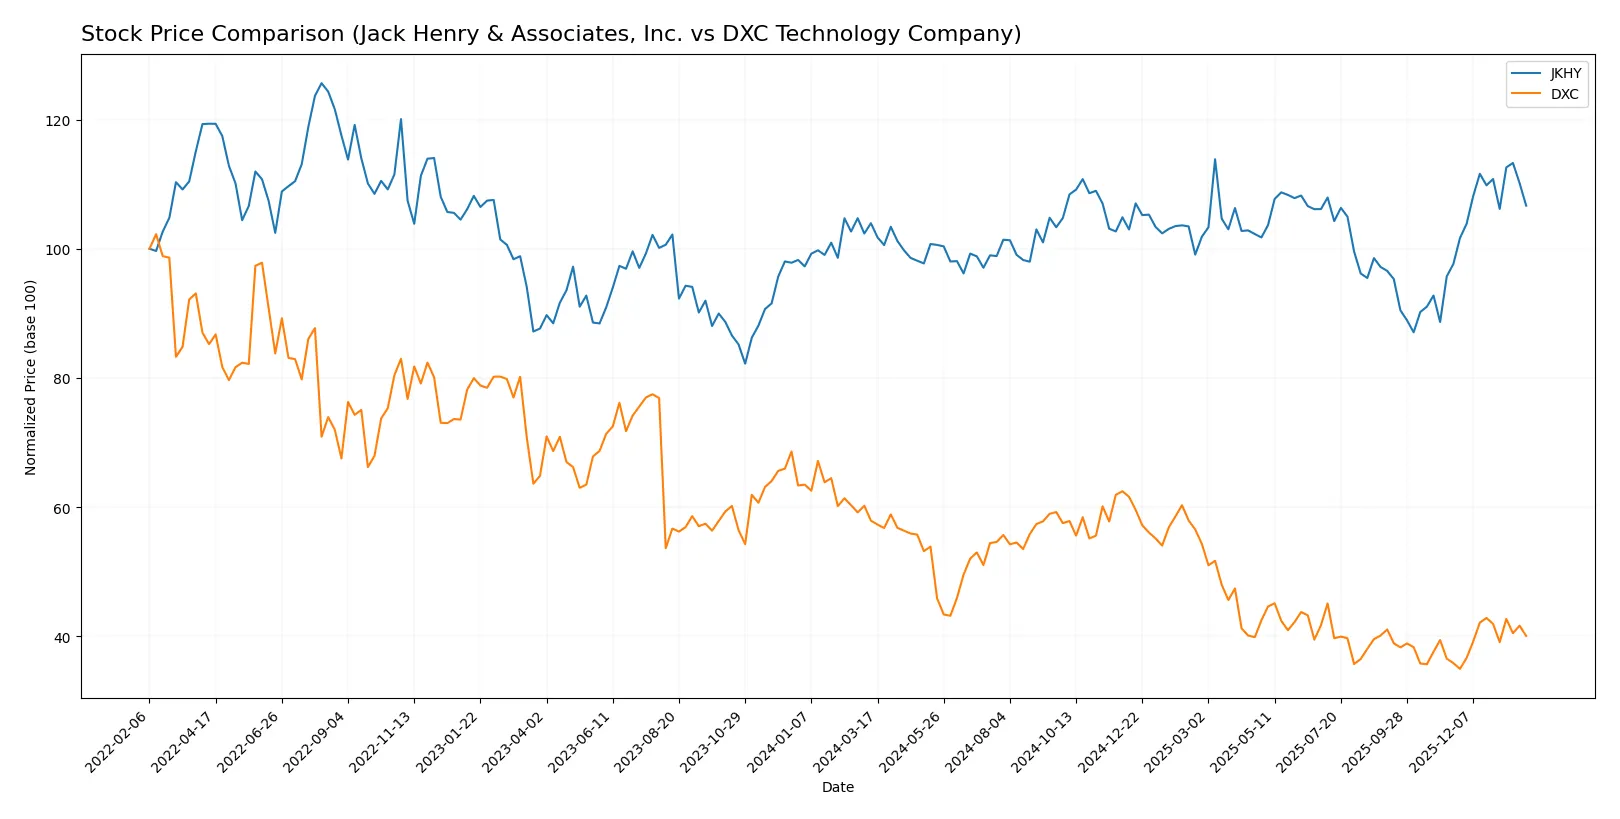
Stock prices over the past year reveal contrasting dynamics: Jack Henry & Associates, Inc. shows steady appreciation with accelerating momentum, while DXC Technology Company experiences a marked decline amid accelerating bearish pressure.
Trend Comparison
Jack Henry & Associates, Inc. exhibits a bullish trend with a 2.61% price increase over 12 months. The trend accelerates, peaking at $191.28 and bottoming at $146.26, supported by high volatility (9.21% std deviation).
DXC Technology Company faces a bearish trend, losing 30.82% in the same period. Despite recent acceleration, it has lower volatility (3.0% std deviation), with a high of $22.5 and a low of $12.59.
Comparing both, Jack Henry & Associates outperforms DXC, delivering positive market returns while DXC registers a significant loss over the past year.
Target Prices
Analysts present a cautiously optimistic consensus for Jack Henry & Associates and DXC Technology.
| Company | Target Low | Target High | Consensus |
|---|---|---|---|
| Jack Henry & Associates, Inc. | 181 | 220 | 203.14 |
| DXC Technology Company | 13 | 14 | 13.5 |
Jack Henry’s target consensus at 203.14 exceeds its current 179.21 price, signaling upside potential. DXC’s consensus of 13.5 sits slightly below the current 14.43 price, indicating a more cautious outlook.

Don’t Let Luck Decide Your Entry Point
Optimize your entry points with our advanced ProRealTime indicators. You’ll get efficient buy signals with precise price targets for maximum performance. Start outperforming now!
How do institutions grade them?
Jack Henry & Associates, Inc. Grades
The following table summarizes recent grades from established financial institutions for Jack Henry & Associates.
| Grading Company | Action | New Grade | Date |
|---|---|---|---|
| Wells Fargo | Maintain | Equal Weight | 2026-01-30 |
| DA Davidson | Maintain | Buy | 2026-01-29 |
| DA Davidson | Maintain | Buy | 2026-01-28 |
| Wolfe Research | Upgrade | Outperform | 2026-01-08 |
| UBS | Maintain | Neutral | 2026-01-08 |
| RBC Capital | Upgrade | Outperform | 2025-12-16 |
| Baird | Maintain | Neutral | 2025-12-15 |
| Keefe, Bruyette & Woods | Upgrade | Outperform | 2025-12-08 |
| Goldman Sachs | Maintain | Neutral | 2025-11-07 |
| Compass Point | Upgrade | Buy | 2025-11-06 |
DXC Technology Company Grades
The following table presents recent institutional grades for DXC Technology from recognized financial firms.
| Grading Company | Action | New Grade | Date |
|---|---|---|---|
| Stifel | Maintain | Hold | 2025-10-31 |
| JP Morgan | Maintain | Underweight | 2025-08-20 |
| Morgan Stanley | Maintain | Equal Weight | 2025-08-01 |
| RBC Capital | Maintain | Sector Perform | 2025-08-01 |
| JP Morgan | Maintain | Underweight | 2025-05-21 |
| RBC Capital | Maintain | Sector Perform | 2025-05-15 |
| BMO Capital | Maintain | Market Perform | 2025-05-15 |
| Morgan Stanley | Maintain | Equal Weight | 2025-05-15 |
| Guggenheim | Maintain | Neutral | 2025-05-12 |
| Susquehanna | Maintain | Neutral | 2025-04-23 |
Which company has the best grades?
Jack Henry & Associates has received more upgrades and higher ratings, including multiple Outperform and Buy grades. DXC Technology’s grades remain largely neutral to underweight, suggesting less bullish institutional sentiment that may affect investor confidence.
Risks specific to each company
The following categories identify the critical pressure points and systemic threats facing both firms in the 2026 market environment:
1. Market & Competition
Jack Henry & Associates, Inc.
- Focuses on niche financial services tech with stable client base, but faces pressure from fintech innovation.
DXC Technology Company
- Operates broadly in IT services with intense competition from global players and shifting client demands.
2. Capital Structure & Debt
Jack Henry & Associates, Inc.
- Zero debt, strong interest coverage, and conservative leverage reduce financial risk significantly.
DXC Technology Company
- High debt-to-equity ratio (1.41) raises leverage risk; interest coverage is moderate, signaling caution.
3. Stock Volatility
Jack Henry & Associates, Inc.
- Beta of 0.73 indicates lower volatility than market, offering defensive stability.
DXC Technology Company
- Beta above 1 (1.045) implies stock reacts more strongly to market swings, increasing risk.
4. Regulatory & Legal
Jack Henry & Associates, Inc.
- Faces typical financial tech regulations; limited international exposure lowers regulatory complexity.
DXC Technology Company
- Global operations expose DXC to varied regulations and potential compliance costs across regions.
5. Supply Chain & Operations
Jack Henry & Associates, Inc.
- Primarily software-focused with minimal physical supply chain risks.
DXC Technology Company
- Extensive infrastructure services depend on complex supply chains vulnerable to disruption.
6. ESG & Climate Transition
Jack Henry & Associates, Inc.
- Limited public ESG data but tech sector pressures to improve sustainability and data privacy.
DXC Technology Company
- Larger footprint with greater ESG exposure; transition risks tied to energy use and governance.
7. Geopolitical Exposure
Jack Henry & Associates, Inc.
- Primarily US-based, limiting geopolitical risk but also growth opportunities abroad.
DXC Technology Company
- Operates globally, facing risks from geopolitical tensions, trade policies, and regional instability.
Which company shows a better risk-adjusted profile?
Jack Henry & Associates shows a superior risk-adjusted profile, driven by its debt-free balance sheet, lower stock volatility, and focused market niche. DXC’s high leverage and global complexity increase its systemic risks. The stark contrast in Altman Z-scores—12.08 for Jack Henry versus 1.17 for DXC—signals Jack Henry’s financial safety and DXC’s distress zone risk. This underscores my concern about DXC’s capital structure and operational exposure in volatile global markets.
Final Verdict: Which stock to choose?
Jack Henry & Associates stands out for its durable competitive advantage and strong capital efficiency. Its superpower lies in consistently generating returns well above its cost of capital, fueling steady growth. The point of vigilance is its premium valuation, which could temper near-term upside. It fits well in an Aggressive Growth portfolio seeking quality and resilience.
DXC Technology’s strategic moat is its attractive valuation and free cash flow yield, offering a margin of safety. While it lacks Jack Henry’s profitability consistency, DXC appeals to investors prioritizing value and turnaround potential. Its financial risk profile is higher, but it suits a GARP (Growth at a Reasonable Price) approach focused on asymmetric risk-reward.
If you prioritize sustainable value creation and proven profitability, Jack Henry outshines with superior stability and growth durability. However, if you seek value exposure with potential for rebound, DXC offers a compelling scenario despite its financial challenges. Both profiles demand careful risk management aligned with your tolerance and investment horizon.
Disclaimer: Investment carries a risk of loss of initial capital. The past performance is not a reliable indicator of future results. Be sure to understand risks before making an investment decision.
Go Further
I encourage you to read the complete analyses of Jack Henry & Associates, Inc. and DXC Technology Company to enhance your investment decisions: