Home > Comparison > Technology > IBM vs DXC
The strategic rivalry between International Business Machines Corporation and DXC Technology Company defines the current trajectory of the global technology sector. IBM operates as a diversified technology powerhouse with a broad portfolio in software, consulting, infrastructure, and financing. DXC focuses on IT services and digital transformation solutions, emphasizing agility and cloud migration. This analysis evaluates which business model delivers superior risk-adjusted returns for a diversified investment portfolio in an evolving tech landscape.
Table of contents
Companies Overview
International Business Machines Corporation and DXC Technology Company stand as pivotal players in the IT services sector.
International Business Machines Corporation: Hybrid Cloud and Enterprise Solutions Leader
International Business Machines Corporation dominates as a technology titan with a $287B market cap, generating revenue from software, consulting, infrastructure, and financing. Its core revenue engine centers on hybrid cloud, AI, and enterprise software, including Red Hat open-source solutions. In 2026, it strategically focuses on expanding hybrid cloud platforms and AI-driven business automation to sustain its competitive edge.
DXC Technology Company: Digital Transformation and IT Outsourcing Specialist
DXC Technology Company operates as a mid-cap IT service provider with a $2.5B market cap, earning primarily through global business services and infrastructure. Its revenue derives from analytics, consulting, cloud migration, and IT outsourcing to accelerate clients’ digital transformations. In 2026, DXC emphasizes secure cloud migration, agile process automation, and enhancing multi-cloud management capabilities.
Strategic Collision: Similarities & Divergences
IBM and DXC share a commitment to digital transformation but diverge in scale and approach. IBM leverages a hybrid cloud and AI-centric model, while DXC focuses on agile cloud migration and IT outsourcing services. Their primary battleground lies in enterprise cloud infrastructure and business process automation. IBM’s vast scale contrasts with DXC’s nimble, specialized profile, shaping distinct investment considerations.
Income Statement Comparison
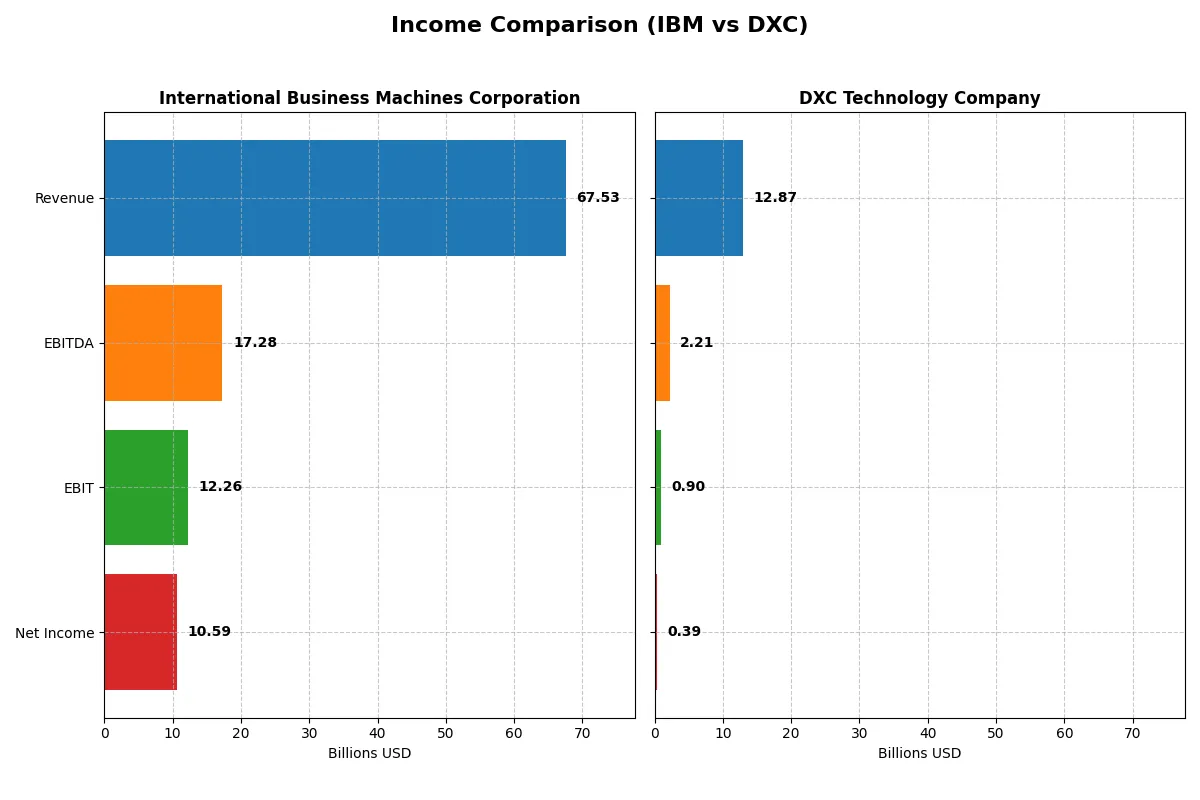
This data dissects the core profitability and scalability of both corporate engines to reveal who dominates the bottom line:
| Metric | International Business Machines Corporation (IBM) | DXC Technology Company (DXC) |
|---|---|---|
| Revenue | 67.5B | 12.9B |
| Cost of Revenue | 27.4B | 9.8B |
| Operating Expenses | 29.9B | 2.4B |
| Gross Profit | 40.2B | 3.1B |
| EBITDA | 17.3B | 2.2B |
| EBIT | 12.3B | 895M |
| Interest Expense | 1.9B | 265M |
| Net Income | 10.6B | 389M |
| EPS | 11.36 | 2.15 |
| Fiscal Year | 2025 | 2025 |
Income Statement Analysis: The Bottom-Line Duel
This income statement comparison reveals which company converts revenue into real profit more efficiently and sustains growth momentum.
International Business Machines Corporation Analysis
IBM’s revenue climbed steadily from 57B in 2021 to 67.5B in 2025, reflecting a 17.8% growth over five years. Net income soared 84.5% to 10.6B in 2025, supported by a strong gross margin near 60% and a net margin of 15.7%. IBM’s EBIT margin hit 18.2% in 2025, signaling robust operational efficiency and improving profitability momentum.
DXC Technology Company Analysis
DXC’s revenue declined from 16.3B in 2021 to 12.9B in 2025, a 20.9% contraction over five years. Net income fell 45.8% to 389M, despite a slight gross margin improvement to 24.1%. The 2025 EBIT margin of 7% and net margin of 3% reflect tepid profitability. However, DXC’s recent EPS growth (357% in one year) hints at a modest operational recovery from prior losses.
Margin Strength vs. Revenue Contraction
IBM outpaces DXC with superior revenue growth, margin expansion, and net income momentum. IBM’s consistent profitability and margin strength make it a fundamentally stronger earnings engine. Conversely, DXC’s shrinking top line and weak margins limit its earnings power despite recent EPS gains. Investors favor firms with resilient profit margins and growth, positioning IBM as the clearer fundamental winner.
Financial Ratios Comparison
These vital ratios act as a diagnostic tool to expose the underlying fiscal health, valuation premiums, and capital efficiency of the companies compared below:
| Ratios | IBM (IBM) | DXC (DXC) |
|---|---|---|
| ROE | 33.3% (2023) | 12.0% (2025) |
| ROIC | 7.8% (2023) | 4.4% (2025) |
| P/E | 19.9 (2023) | 7.9 (2025) |
| P/B | 6.6 (2023) | 1.0 (2025) |
| Current Ratio | 0.96 (2023) | 1.22 (2025) |
| Quick Ratio | 0.93 (2023) | 1.22 (2025) |
| D/E | 2.66 (2023) | 1.41 (2025) |
| Debt-to-Assets | 44.3% (2023) | 34.4% (2025) |
| Interest Coverage | 6.11 (2023) | 2.63 (2025) |
| Asset Turnover | 0.46 (2023) | 0.97 (2025) |
| Fixed Asset Turnover | 7.09 (2023) | 6.82 (2025) |
| Payout ratio | 80.5% (2023) | 0% (2025) |
| Dividend yield | 4.05% (2023) | 0% (2025) |
| Fiscal Year | 2023 | 2025 |
Efficiency & Valuation Duel: The Vital Signs
Financial ratios serve as a company’s DNA, exposing hidden risks and operational strengths critical for investment decisions.
International Business Machines Corporation
IBM reports a strong net margin of 15.7%, yet its ROE and ROIC register unfavorably at zero, signaling weak capital efficiency. The stock trades at a stretched P/E of 26.1, above market averages. IBM rewards shareholders with a 2.27% dividend yield, reflecting a mature payout strategy rather than aggressive reinvestment.
DXC Technology Company
DXC posts a modest net margin of 3.0% and a neutral ROE of 12.1%, indicating moderate profitability. Its valuation looks attractive with a P/E of 7.9 and a price-to-book near parity. DXC lacks dividend payouts, likely reinvesting cash flow to improve operations and reduce debt, consistent with its slightly favorable financial profile.
Premium Valuation vs. Operational Safety
IBM’s premium valuation contrasts with DXC’s bargain pricing and operational improvements. IBM offers steady dividends but struggles with capital returns, increasing risk. DXC’s lower valuation and reinvestment focus suggest growth potential with manageable risk. Value-oriented investors may favor DXC’s profile, while income seekers might lean toward IBM’s stability.
Which one offers the Superior Shareholder Reward?
I find IBM offers a more balanced shareholder reward than DXC in 2026. IBM yields 2.27%–4.9% in dividends with payout ratios around 59–102%, supported by strong free cash flow coverage above 80%. Its steady buyback programs complement dividends, sustaining total returns. DXC pays no dividends and relies solely on modest buybacks, with FCF coverage below 60%, signaling less capital returned to shareholders. IBM’s high dividend yield combined with prudent buybacks presents a more sustainable and attractive total return profile than DXC’s reinvestment-heavy model. I conclude IBM delivers superior shareholder reward in 2026.
Comparative Score Analysis: The Strategic Profile
The radar chart reveals the fundamental DNA and trade-offs of International Business Machines Corporation and DXC Technology Company, highlighting their distinct financial strengths and weaknesses:
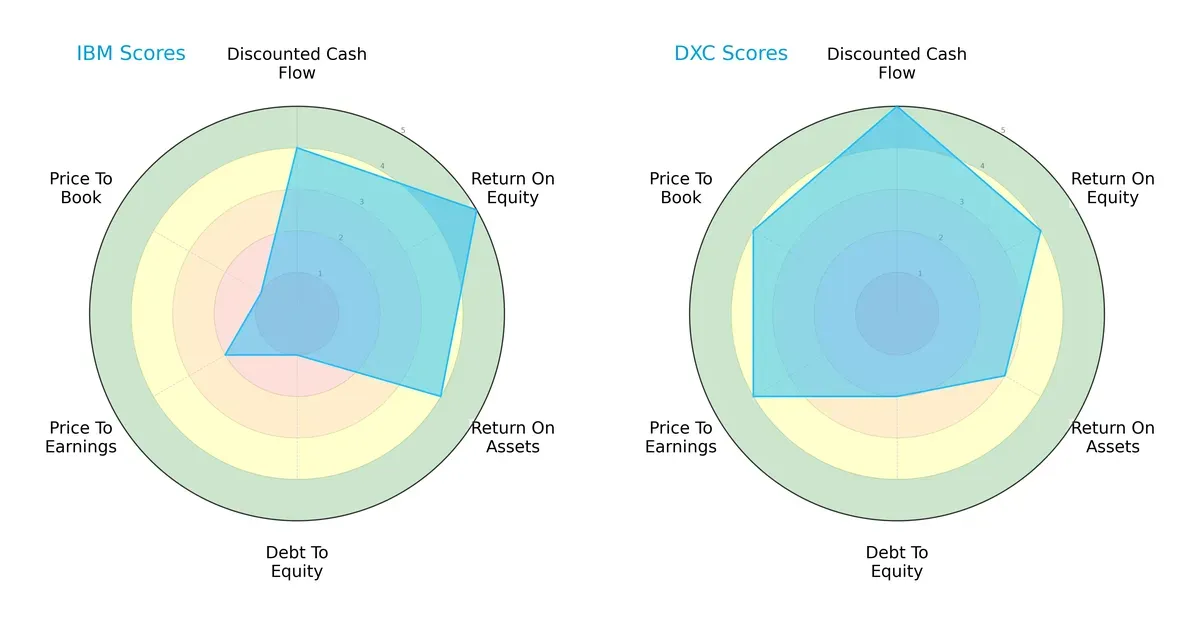
IBM shows strength in return on equity (5) and return on assets (4), reflecting efficient profit generation and asset use. However, it carries significant financial risk, indicated by a very unfavorable debt-to-equity score (1) and low valuation scores (P/E: 2, P/B: 1). DXC offers a more balanced profile with favorable discounted cash flow (5) and valuation metrics (P/E: 4, P/B: 4), paired with moderate leverage (debt-to-equity: 2). DXC relies on valuation advantages and cash flow strength, while IBM leans on operational efficiency but suffers from financial leverage risks.
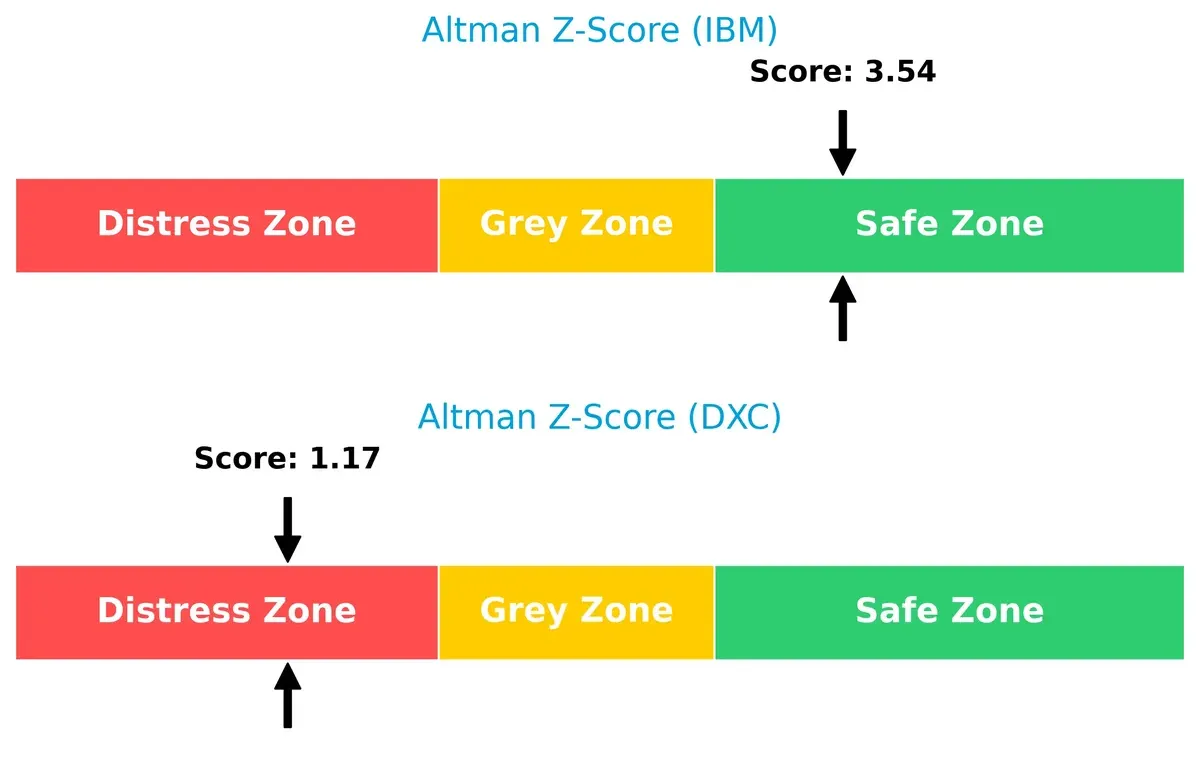
Bankruptcy Risk: Solvency Showdown
IBM’s Altman Z-Score of 3.54 places it comfortably in the safe zone, signaling solid long-term survival prospects. DXC, with a distress zone score of 1.17, faces elevated bankruptcy risk, suggesting fragile solvency in this cycle:
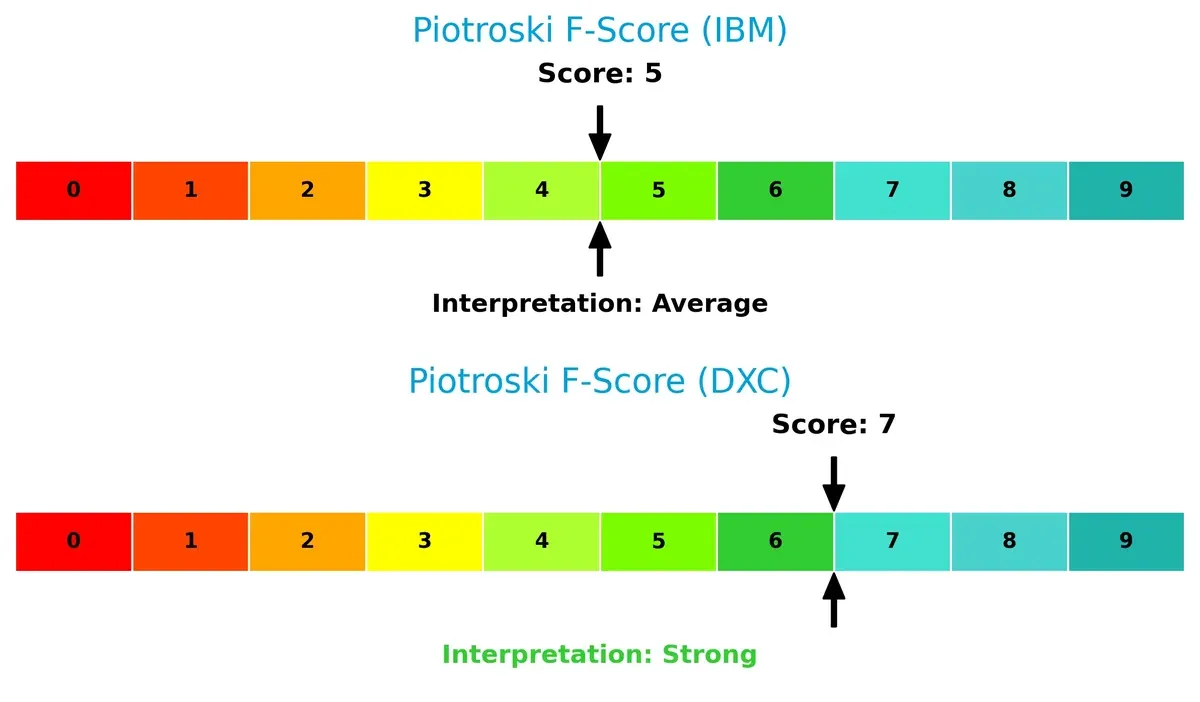
Financial Health: Quality of Operations
DXC’s Piotroski F-Score of 7 indicates strong financial health with robust internal controls and operational quality. IBM’s score of 5 is average, revealing potential red flags in profitability or efficiency metrics compared to DXC:
How are the two companies positioned?
This section dissects IBM and DXC’s operational DNA by comparing their revenue distribution and internal dynamics—strengths and weaknesses. The goal is to confront their economic moats to identify which model offers the most resilient, sustainable competitive advantage today.
Revenue Segmentation: The Strategic Mix
This visual comparison dissects how International Business Machines Corporation and DXC Technology Company diversify their income streams and where their primary sector bets lie:
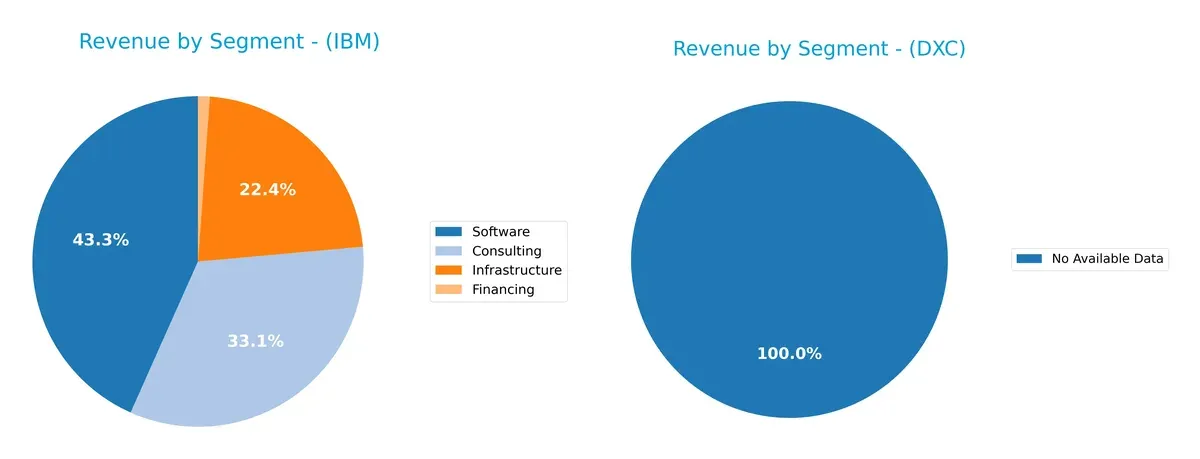
IBM displays a balanced revenue mix with Software at $27B, Consulting at $20.7B, and Infrastructure at $14B. This diversification anchors IBM’s ecosystem lock-in and reduces concentration risk. DXC lacks available segmentation data, preventing direct comparison. IBM’s multi-segment approach contrasts with typical industry peers that often pivot around a dominant segment, confirming IBM’s strategic breadth and infrastructure dominance.
Strengths and Weaknesses Comparison
This table compares the Strengths and Weaknesses of IBM and DXC based on diversification, profitability, financials, innovation, global presence, and market share:
IBM Strengths
- Diversified revenue streams across Software, Consulting, and Infrastructure
- Strong net margin at 15.69%
- Favorable dividend yield of 2.27%
- Low debt-to-assets ratio and strong interest coverage
- Global presence with significant Americas, EMEA, and Asia Pacific sales
DXC Strengths
- Favorable valuation ratios with PE at 7.92 and PB at 0.95
- Quick ratio indicates solid short-term liquidity
- Favorable WACC shows efficient capital cost
- Strong fixed asset turnover at 6.82
- Neutral ROE at 12.05% suggests moderate profitability
IBM Weaknesses
- Unfavorable ROE and ROIC at 0% indicate poor capital efficiency
- Poor liquidity ratios with zero current and quick ratios
- Unfavorable price-to-earnings ratio at 26.07
- Low asset turnover ratios suggest inefficient asset use
- Net margin lower than ideal for tech sector
DXC Weaknesses
- Low net margin at 3.02% signals weak profitability
- High debt-to-equity ratio of 1.41 increases financial risk
- Neutral interest coverage ratio at 3.38 is borderline
- No dividend yield reduces income appeal
- ROIC below WACC at 4.43% signals value destruction
Overall, IBM demonstrates strong global diversification and profitability but suffers from weak capital efficiency and liquidity. DXC shows valuation attractiveness and operational efficiency but struggles with profitability and higher leverage. These contrasts highlight different strategic and financial challenges each company faces.
The Moat Duel: Analyzing Competitive Defensibility
A durable structural moat shields long-term profits from competition’s relentless erosion. Let’s dissect the competitive moats of IBM and DXC Technology:
IBM: Intangible Assets Power a Hybrid Cloud Moat
IBM leverages its intangible assets, such as proprietary software and hybrid cloud expertise, to sustain high ROIC and margin stability. In 2026, expanding AI and automation solutions could deepen this advantage.
DXC Technology: Cost Efficiency Struggles Amid Legacy Pressure
DXC’s moat relies on cost-efficient IT outsourcing but lacks IBM’s intangible edge. Declining ROIC and shrinking revenue signal vulnerability. Growth hinges on modernizing legacy services or risk disruption.
Hybrid Cloud Innovation vs. Legacy Cost Efficiency
IBM’s intangible asset moat is deeper and more resilient than DXC’s cost-focused edge. IBM’s diversified software and consulting offerings better defend its market share in evolving tech landscapes.
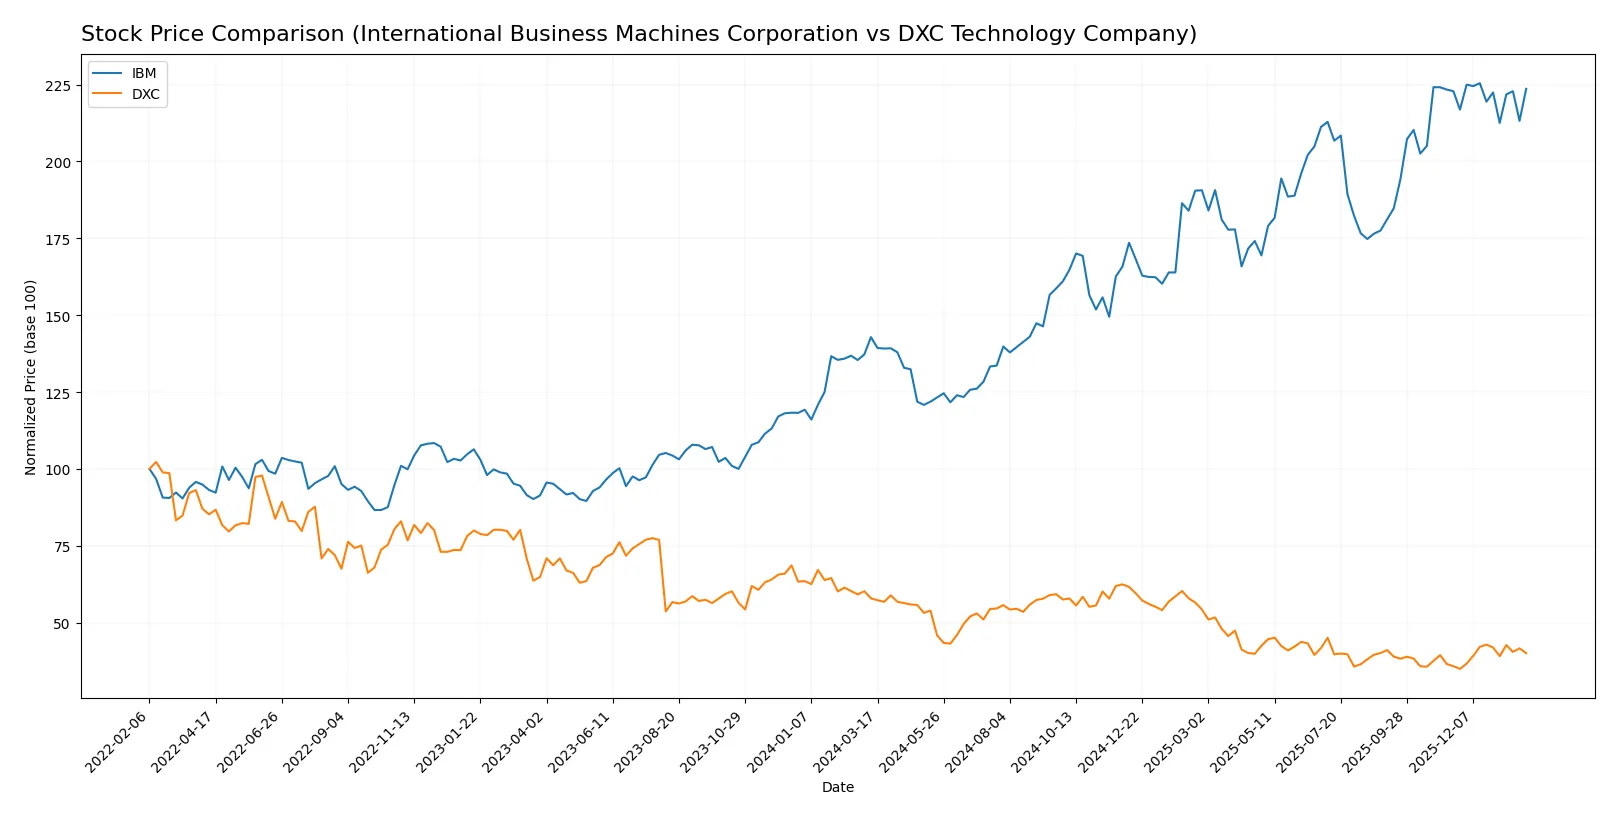
Which stock offers better returns?
The past year shows contrasting price dynamics: IBM surged 56.5% with decelerating momentum, while DXC declined 30.8% despite recent acceleration in gains.
Trend Comparison
IBM’s stock rose 56.5% over 12 months, signaling a strong bullish trend with decelerating price gains and high volatility. The highest price hit 309.24, and the lowest was 165.71.
DXC shares fell 30.8% over the same period, confirming a bearish trend with accelerating losses. Price volatility remained low, with a high of 22.5 and a low of 12.59.
IBM’s stock significantly outperformed DXC, delivering the highest market return despite slowing recent momentum. DXC’s trend remains negative but shows short-term recovery signs.
Target Prices
Analysts present a clear target consensus for both IBM and DXC Technology.
| Company | Target Low | Target High | Consensus |
|---|---|---|---|
| International Business Machines Corporation | 304 | 380 | 349.5 |
| DXC Technology Company | 13 | 14 | 13.5 |
IBM’s target consensus sits about 14% above its current price of 307, signaling moderate upside potential. DXC’s consensus is slightly below its current price of 14.43, indicating a more cautious outlook from analysts.

Don’t Let Luck Decide Your Entry Point
Optimize your entry points with our advanced ProRealTime indicators. You’ll get efficient buy signals with precise price targets for maximum performance. Start outperforming now!
How do institutions grade them?
International Business Machines Corporation Grades
The following table summarizes recent grades from major financial institutions for IBM:
| Grading Company | Action | New Grade | Date |
|---|---|---|---|
| JP Morgan | Maintain | Neutral | 2026-01-29 |
| Evercore ISI Group | Maintain | Outperform | 2026-01-29 |
| RBC Capital | Maintain | Outperform | 2026-01-29 |
| Jefferies | Maintain | Buy | 2026-01-29 |
| UBS | Maintain | Sell | 2026-01-29 |
| Stifel | Maintain | Buy | 2026-01-29 |
| Wedbush | Maintain | Outperform | 2026-01-29 |
| JP Morgan | Maintain | Neutral | 2026-01-21 |
| Evercore ISI Group | Maintain | Outperform | 2026-01-20 |
| B of A Securities | Maintain | Buy | 2026-01-13 |
DXC Technology Company Grades
The following table summarizes recent grades from major financial institutions for DXC:
| Grading Company | Action | New Grade | Date |
|---|---|---|---|
| Stifel | Maintain | Hold | 2025-10-31 |
| JP Morgan | Maintain | Underweight | 2025-08-20 |
| Morgan Stanley | Maintain | Equal Weight | 2025-08-01 |
| RBC Capital | Maintain | Sector Perform | 2025-08-01 |
| JP Morgan | Maintain | Underweight | 2025-05-21 |
| RBC Capital | Maintain | Sector Perform | 2025-05-15 |
| BMO Capital | Maintain | Market Perform | 2025-05-15 |
| Morgan Stanley | Maintain | Equal Weight | 2025-05-15 |
| Guggenheim | Maintain | Neutral | 2025-05-12 |
| Susquehanna | Maintain | Neutral | 2025-04-23 |
Which company has the best grades?
IBM has consistently received stronger grades, including multiple “Buy” and “Outperform” ratings. DXC’s grades cluster around “Hold” and “Equal Weight,” signaling more cautious views. Investors may perceive IBM as the more favored option among institutions.
Risks specific to each company
The following categories identify the critical pressure points and systemic threats facing both firms in the 2026 market environment:
1. Market & Competition
International Business Machines Corporation (IBM)
- Faces strong competition in hybrid cloud and AI markets; software segment growth under pressure from agile rivals.
DXC Technology Company (DXC)
- Competes in IT services with slimmer margins; digital transformation services face disruption from niche players.
2. Capital Structure & Debt
International Business Machines Corporation (IBM)
- Low debt-to-equity ratio signals conservative leverage; excellent interest coverage at 6.34x reduces refinancing risk.
DXC Technology Company (DXC)
- High debt-to-equity (1.41) raises financial risk; moderate interest coverage (3.38x) could strain in downturns.
3. Stock Volatility
International Business Machines Corporation (IBM)
- Beta of 0.698 indicates lower volatility than the market, offering defensive qualities.
DXC Technology Company (DXC)
- Beta at 1.045 shows moderate volatility, exposing investors to market swings.
4. Regulatory & Legal
International Business Machines Corporation (IBM)
- Global operations expose IBM to complex regulations, especially in data privacy and cybersecurity.
DXC Technology Company (DXC)
- DXC faces regulatory scrutiny in multiple jurisdictions, with heightened risks in cloud security compliance.
5. Supply Chain & Operations
International Business Machines Corporation (IBM)
- Robust infrastructure segment supports hybrid cloud, but legacy hardware demands challenge efficiency.
DXC Technology Company (DXC)
- Relies heavily on outsourcing and third-party vendors, increasing supply chain vulnerability.
6. ESG & Climate Transition
International Business Machines Corporation (IBM)
- Advanced ESG initiatives improve sustainability credentials, but transition costs remain significant.
DXC Technology Company (DXC)
- ESG efforts are improving but lag industry leaders, creating reputational and regulatory risks.
7. Geopolitical Exposure
International Business Machines Corporation (IBM)
- Extensive global footprint exposes IBM to geopolitical tensions affecting supply chains and market access.
DXC Technology Company (DXC)
- Primarily North America and Europe focused; less global exposure but vulnerable to regional instability.
Which company shows a better risk-adjusted profile?
IBM’s strongest risk is regulatory complexity and legacy operational burdens, while DXC’s key risk lies in its high leverage and financial distress signals. Despite IBM’s operational challenges, its conservative capital structure and lower stock volatility offer a more stable risk-adjusted profile. DXC’s distressed Altman Z-score (1.17) and heavy debt overshadow its favorable valuation metrics, raising caution. IBM remains the safer choice amid 2026’s market uncertainties.
Final Verdict: Which stock to choose?
International Business Machines Corporation (IBM) excels as a cash-generating powerhouse with robust income growth and a proven ability to sustain profitability. Its main point of vigilance is the declining ROIC trend, suggesting challenges in capital efficiency. IBM suits portfolios focused on stable income and moderate growth.
DXC Technology Company offers a strategic moat through its favorable valuation and improving free cash flow yield. While its profitability metrics lag behind IBM’s, DXC presents a more attractive safety profile relative to its price, positioning itself well for value-oriented investors. It fits portfolios focused on growth at a reasonable price (GARP).
If you prioritize steady income and a resilient franchise, IBM is the compelling choice due to its consistent profitability and strong cash generation. However, if you seek value with potential upside and a more favorable valuation, DXC offers better stability at a lower price point despite its operational headwinds. Both present analytical scenarios tailored to distinct investor risk tolerances.
Disclaimer: Investment carries a risk of loss of initial capital. The past performance is not a reliable indicator of future results. Be sure to understand risks before making an investment decision.
Go Further
I encourage you to read the complete analyses of International Business Machines Corporation and DXC Technology Company to enhance your investment decisions: